perf tools: Introduce an abstraction for AUX Area and Instruction Tracing
Subsystems (2)
Adrian Hunter
reviewerv8 cover perf tools: Introduce an abstraction for AUX Area and Instruction Tracing
Hi
Here is V8 patches for the introduction of an abstraction for using the AUX area and Instruction tracing. The patches for AUX area support have been applied, just leaving patches for Intel PT and Intel BTS. These have now been updated to reflect new Intel PT features, plus a couple of fixes.
The patches can also be found here:
http://git.infradead.org/users/ahunter/linux-perf.git
An example (unchanged from V3) perf.data file and build id archive can be found here:
http://git.infradead.org/~ahunter/tfr/
There is also a tar of the 3 most relevant files with debugging symbols. These need to be placed in under the correct paths in /usr/lib/debug to get symbols.
Changes in V8:
New patches:
perf auxtrace: Fix period type 'i' not working
perf tools: Fix perf-with-kcore handling of arguments containing spaces perf tools: Fix Intel PT 'instructions' sample period
perf tools: Add perf_pmu__format_bits()
perf tools: Validate config term maximum value
perf tools: Extend the event parser maximum error index perf tools: Add Intel PT support for PSB periods
perf tools: Add new Intel PT packet definitions
perf tools: Pass Intel PT information for decoding MTC and CYC perf tools: Add Intel PT support for decoding MTC packets perf tools: Add Intel PT support for using MTC packets
perf tools: Add Intel PT support for decoding CYC packets perf tools: Add Intel PT support for using CYC packets
perf tools: Add Intel PT support for decoding TRACESTOP packets perf tools: Update Intel PT documentation
Changes in V7:
Patches already applied:
perf db-export: Fix thread ref-counting
perf tools: Ensure thread-stack is flushed
perf tools: Allow auxtrace data alignment
perf tools: Add Intel PT instruction decoder
Copy the x86 instruction decoder into perf tools source
perf tools: Add Intel PT decoder
Fix Intel PT getting stuck in a loop
Check for being stuck in a loop. That can happen if a decoder error results in the decoder erroneously setting the ip to an address that is itself in an infinite loop that consumes no packets. The only way to be in a loop that consumes no packets is if it consists of unconditional branches. So the check for being stuck is if we see a repeating cycle of consecutive unconditional branches.
perf tools: Add Intel PT support
Add missing err check in intel-pt.
Fix missing thread__puts
Improve Intel PT sync to sideband events
To help synchronize trace data with sideband events the timestamp when returning to userspace is estimated.
That was not always being done if switch information was not available, but it is still useful for sync'ing to mmap changes, so simplify by doing it always when TSC is available. Also add log prints to help debug synchronization to sideband.
Improve Intel PT timestamp estimation
Intel PT uses timestamps to synchronize side-band information to trace data. However timestamps may not be frequent enough. To improve accuracy, an estimated timestamp is calculated based on the number of instructions executed since the last known timestamp.
This patch improves that estimate by taking into account the CPU frequency as represented by the Intel PT CBR (core-to-bus ratio) packet.
perf tools: Add Intel BTS support
Fix missing thread__puts
Add a fix for an infinite loop in intel_bts_process_buffer misplaced in a followup patch in the original patchkit
perf tools: Output sample flags and insn_len from intel_pt
Folded into: perf tools: Add Intel PT support
perf tools: Output sample flags and insn_len from intel_bts
Folded into: perf tools: Add Intel BTS support
perf tools: Intel PT to always update thread stack trace number
Folded into: perf tools: Add Intel PT support
perf tools: Intel BTS to always update thread stack trace number
Folded into: perf tools: Add Intel BTS support
Changes in V6:
Some minor expansion of commit messages.
Patches already applied:
perf tools: Disallow PMU events intel_pt and intel_bts until there is support
perf db-export: Fix thread ref-counting
New patch
perf tools: Ensure thread-stack is flushed
New patch
perf tools: Add Intel PT support
Support thread ref-counting
perf tools: Add Intel PT decoder
Fix a bug: FUP packet in PSB to update last IP
perf tools: Take Intel PT into use
Add Overview and Quickstart sections to intel_pt.txt
perf tools: Add Intel BTS support
Add Overview to intel_bts.txt
Support thread ref-counting
perf tools: Add example call-graph script
Add documentation comments to scripts
Changes in V5:
Patches already applied:
perf report: Fix placement of itrace option in documentation perf tools: Add AUX area tracing index
perf tools: Hit all build ids when AUX area tracing
perf tools: Add build option NO_AUXTRACE to exclude AUX area tracing perf auxtrace: Add option to synthesize events for transactions perf tools: Add support for PERF_RECORD_AUX
perf tools: Add support for PERF_RECORD_ITRACE_START perf tools: Add AUX area tracing Snapshot Mode
perf record: Add AUX area tracing Snapshot Mode support
perf tools: Disallow PMU events intel_pt and intel_bts until there is support
New patch
perf tools: Add Intel PT decoder
Style improvements pointed out by Acme: aligning '=', single line initializing Make use of zalloc() not malloc / memset
Make use of zfree
Map internal error codes to fixed constants for output
Change intel_pt_error_message() to intel_pt__strerror()
perf tools: Add Intel PT support
Make use of zfree
perf tools: Take Intel PT into use
Allow "intel_pt" PMU to be selected as an event
perf tools: Add Intel BTS support
Allow "intel_bts" PMU to be selected as an event Make use of zfree
Map internal error codes to fixed constants for output Let "intel_bts" show up in 'perf list'
perf tools: Output sample flags and insn_len from intel_bts
Map internal error codes to fixed constants for output
Changes on V4:
perf tools: Amend mmap ref counting for the AUX area mmap
Dropped because already applied
perf script: Always allow fields 'addr' and 'cpu' for auxtrace
Dropped because already applied
perf report: Add Instruction Tracing support
Dropped because already applied
perf report: Fix placement of itrace option in documentation
New patch
perf tools: Add AUX area tracing index
Change size checks for more flexibility i.e.
- don't mind if an indexed auxtrace_event is bigger than struct auxtrace_event
- don't mind if the auxtrace index does not fill the whole file section
Rename 'index' variable to 'ent' to avoid build errors on older gcc
perf tools: Add build option NO_AUXTRACE to exclude AUX area tracing
Fix whitespace alignment of NO_AUXTRACE=1
Add NO_AUXTRACE=1 to make_minimal
perf tools: Add support for PERF_RECORD_AUX
Expand commit message
perf tools: Add AUX area tracing Snapshot Mode
Whitespace fixups
perf record: Add AUX area tracing Snapshot Mode support
Whitespace fixups
Don't init static variables to 0 or NULL
perf tools: Add Intel PT packet decoder
Whitespace fixups
perf tools: Add Intel PT instruction decoder
Avoid build error on older (broken) gcc by adding -Wno-override-init Avoid build errors due to funny collate sequences i.e. use LC_COLLATE=C etc
perf tools: Add Intel PT decoder
Avoid build errors initializing structures to 0
perf tools: Add Intel PT support
Avoid build errors initializing structures to 0
Allow for perf_pmu__config_terms() having an extra parameter now Allow for parse_events() having an extra parameter now Rename 'div' variable to 'd' to avoid build errors Whitespace fixup
Remove a couple of unused enums
perf tools: Add Intel BTS support
Avoid build errors initializing structures to 0 Allow for parse_events() having an extra parameter now
perf tools: Put itrace options into an asciidoc include
New patch
Changes in V3:
New patch:
perf tools: Amend mmap ref counting for the AUX area mmap
Move some code under arch:
perf tools: Add Intel PT support
perf tools: Add Intel BTS support
Updated documentation:
perf report: Add Instruction Tracing support
perf auxtrace: Add option to synthesize events for transactions perf tools: Take Intel PT into use
perf tools: Add Intel BTS support
Patches already applied:
perf header: Add AUX area tracing feature
perf evlist: Add support for mmapping an AUX area buffer
perf tools: Add user events for AUX area tracing
perf tools: Add support for AUX area recording
perf record: Add basic AUX area tracing support
perf record: Extend -m option for AUX area tracing mmap pages perf tools: Add a user event for AUX area tracing errors
perf session: Add hooks to allow transparent decoding of AUX area tracing data perf session: Add instruction tracing options
perf auxtrace: Add helpers for AUX area tracing errors
perf auxtrace: Add helpers for queuing AUX area tracing data perf auxtrace: Add a heap for sorting AUX area tracing queues perf auxtrace: Add processing for AUX area tracing events
perf auxtrace: Add a hashtable for caching
perf tools: Add member to struct dso for an instruction cache perf script: Add Instruction Tracing support
perf inject: Re-pipe AUX area tracing events
perf inject: Add Instruction Tracing support
perf script: Add field option 'flags' to print sample flags
perf tools: Add aux_watermark member of struct perf_event_attr
Changes in V2:
Get rid of MIN()
perf auxtrace: Add helpers for AUX area tracing errors perf inject: Re-pipe AUX area tracing events
perf tools: Add build option NO_AUXTRACE to exclude AUX area tracing
Intel BTS can be used on most recent Intel CPUs. Intel PT is available on Broadwell.
Examples:
Trace 'ls' with Intel BTS userspace only
perf record --per-thread -e intel_bts//u ls perf report
perf script
Trace 'ls' with Intel BTS kernel and userspace
~/libexec/perf-core/perf-with-kcore record bts-ls --per-thread -e intel_bts// -- ls ~/libexec/perf-core/perf-with-kcore report bts-ls ~/libexec/perf-core/perf-with-kcore script bts-ls
Trace 'ls' with Intel PT userspace only
perf record -e intel_pt//u ls
perf report
perf script
Trace 'ls' with Intel PT kernel and userspace
~/libexec/perf-core/perf-with-kcore record pt-ls -e intel_pt// -- ls ~/libexec/perf-core/perf-with-kcore report pt-ls ~/libexec/perf-core/perf-with-kcore script pt-ls
The abstraction has two separate aspects:
1. recording AUX area data
2. processing AUX area data
Recording consists of mmapping a separate buffer and copying the data into the perf.data file. The buffer is an AUX area buffer. The data is written preceded by a new user event PERF_RECORD_AUXTRACE. The data is too big to fit in the event but follows immediately afterward. Session processing has to skip to get to the next event header in a similar fashion to the existing PERF_RECORD_HEADER_TRACING_DATA
event. The main recording patches are:
perf evlist: Add support for mmapping an AUX area buffer perf tools: Add user events for AUX area tracing perf tools: Add support for AUX area recording perf record: Add basic AUX area tracing support
Processing consists of providing hooks in session processing to enable a decoder to see all the events and deliver synthesized events transparently into the event stream. The main processing patch is:
perf session: Add hooks to allow transparent decoding of AUX area tracing data
Adrian Hunter (25):
perf auxtrace: Add Intel PT as an AUX area tracing type perf tools: Add Intel PT packet decoder
perf tools: Add Intel PT instruction decoder
perf tools: Add Intel PT log
perf tools: Add Intel PT decoder
perf tools: Add Intel PT support
perf tools: Take Intel PT into use
perf tools: Add Intel BTS support
perf tools: Put itrace options into an asciidoc include perf tools: Add example call-graph script
perf auxtrace: Fix period type 'i' not working
perf tools: Fix perf-with-kcore handling of arguments containing spaces perf tools: Fix Intel PT 'instructions' sample period
perf tools: Add perf_pmu__format_bits()
perf tools: Validate config term maximum value
perf tools: Extend the event parser maximum error index perf tools: Add Intel PT support for PSB periods
perf tools: Add new Intel PT packet definitions
perf tools: Pass Intel PT information for decoding MTC and CYC perf tools: Add Intel PT support for decoding MTC packets perf tools: Add Intel PT support for using MTC packets
perf tools: Add Intel PT support for decoding CYC packets perf tools: Add Intel PT support for using CYC packets
perf tools: Add Intel PT support for decoding TRACESTOP packets perf tools: Update Intel PT documentation
 tools/build/Makefile.build                         |    2 +
 tools/perf/.gitignore                              |    1 +
 tools/perf/Documentation/intel-bts.txt             |   86 +
 tools/perf/Documentation/intel-pt.txt              |  766 +++++++
 tools/perf/Documentation/itrace.txt                |   22 +
 tools/perf/Documentation/perf-inject.txt           |   23 +-
 tools/perf/Documentation/perf-report.txt           |   23 +-
 tools/perf/Documentation/perf-script.txt           |   23 +-
 tools/perf/Makefile.perf                           |   12 +-
 tools/perf/arch/x86/util/Build                     |    5 +
 tools/perf/arch/x86/util/auxtrace.c                |   83 +
 tools/perf/arch/x86/util/intel-bts.c               |  458 ++++
 tools/perf/arch/x86/util/intel-pt.c                | 1007 +++++++++
 tools/perf/arch/x86/util/pmu.c                     |   18 +
 tools/perf/perf-with-kcore.sh                      |   28 +-
 .../scripts/python/call-graph-from-postgresql.py   |  327 +++
 tools/perf/scripts/python/export-to-postgresql.py  |   47 +
 tools/perf/util/Build                              |    3 +
 tools/perf/util/auxtrace.c                         |   15 +-
 tools/perf/util/auxtrace.h                         |    2 +
 tools/perf/util/intel-bts.c                        |  933 ++++++++
 tools/perf/util/intel-bts.h                        |   43 +
 tools/perf/util/intel-pt-decoder/Build             |   11 +
 .../util/intel-pt-decoder/gen-insn-attr-x86.awk    |  386 ++++
 tools/perf/util/intel-pt-decoder/inat.c            |   96 +
 tools/perf/util/intel-pt-decoder/inat.h            |  221 ++
 tools/perf/util/intel-pt-decoder/inat_types.h      |   29 +
 tools/perf/util/intel-pt-decoder/insn.c            |  594 +++++
 tools/perf/util/intel-pt-decoder/insn.h            |  201 ++
 .../perf/util/intel-pt-decoder/intel-pt-decoder.c  | 2345 ++++++++++++++++++++
 .../perf/util/intel-pt-decoder/intel-pt-decoder.h  |  109 +
 .../util/intel-pt-decoder/intel-pt-insn-decoder.c  |  246 ++
 .../util/intel-pt-decoder/intel-pt-insn-decoder.h  |   65 +
 tools/perf/util/intel-pt-decoder/intel-pt-log.c    |  155 ++
 tools/perf/util/intel-pt-decoder/intel-pt-log.h    |   52 +
 .../util/intel-pt-decoder/intel-pt-pkt-decoder.c   |  518 +++++
 .../util/intel-pt-decoder/intel-pt-pkt-decoder.h   |   70 +
 .../perf/util/intel-pt-decoder/x86-opcode-map.txt  |  970 ++++++++
 tools/perf/util/intel-pt.c                         | 1956 ++++++++++++++++
 tools/perf/util/intel-pt.h                         |   56 +
 tools/perf/util/parse-events.c                     |    2 +-
 tools/perf/util/pmu.c                              |   51 +-
 tools/perf/util/pmu.h                              |    1 +
 43 files changed, 11970 insertions(+), 91 deletions(-)
 create mode 100644 tools/perf/Documentation/intel-bts.txt
 create mode 100644 tools/perf/Documentation/intel-pt.txt
 create mode 100644 tools/perf/Documentation/itrace.txt
 create mode 100644 tools/perf/arch/x86/util/auxtrace.c
 create mode 100644 tools/perf/arch/x86/util/intel-bts.c
 create mode 100644 tools/perf/arch/x86/util/intel-pt.c
 create mode 100644 tools/perf/arch/x86/util/pmu.c
 create mode 100644 tools/perf/scripts/python/call-graph-from-postgresql.py
 create mode 100644 tools/perf/util/intel-bts.c
 create mode 100644 tools/perf/util/intel-bts.h
 create mode 100644 tools/perf/util/intel-pt-decoder/Build
 create mode 100644 tools/perf/util/intel-pt-decoder/gen-insn-attr-x86.awk
 create mode 100644 tools/perf/util/intel-pt-decoder/inat.c
 create mode 100644 tools/perf/util/intel-pt-decoder/inat.h
 create mode 100644 tools/perf/util/intel-pt-decoder/inat_types.h
 create mode 100644 tools/perf/util/intel-pt-decoder/insn.c
 create mode 100644 tools/perf/util/intel-pt-decoder/insn.h
 create mode 100644 tools/perf/util/intel-pt-decoder/intel-pt-decoder.c
 create mode 100644 tools/perf/util/intel-pt-decoder/intel-pt-decoder.h
 create mode 100644 tools/perf/util/intel-pt-decoder/intel-pt-insn-decoder.c
 create mode 100644 tools/perf/util/intel-pt-decoder/intel-pt-insn-decoder.h
 create mode 100644 tools/perf/util/intel-pt-decoder/intel-pt-log.c
 create mode 100644 tools/perf/util/intel-pt-decoder/intel-pt-log.h
 create mode 100644 tools/perf/util/intel-pt-decoder/intel-pt-pkt-decoder.c
 create mode 100644 tools/perf/util/intel-pt-decoder/intel-pt-pkt-decoder.h
 create mode 100644 tools/perf/util/intel-pt-decoder/x86-opcode-map.txt
 create mode 100644 tools/perf/util/intel-pt.c
 create mode 100644 tools/perf/util/intel-pt.h
Regards
Adrian
Adrian Hunter
reviewerPATCH v8 1/25 perf auxtrace: Add Intel PT as an AUX area tracing type
Add the Intel Processor Trace type constant PERF_AUXTRACE_INTEL_PT.
---
 tools/perf/util/auxtrace.c | 1 +
 tools/perf/util/auxtrace.h | 1 +
 2 files changed, 2 insertions(+)
tools/perf/util/auxtrace.c +1 -0
@@ -884,6 +884,7 @@ int perf_event__process_auxtrace_info(struct perf_tool *tool __maybe_unused,fprintf (stdout," type: %u\n" , type);switch (type) { +case PERF_AUXTRACE_INTEL_PT :case PERF_AUXTRACE_UNKNOWN :default :return -EINVAL ;
tools/perf/util/auxtrace.h +1 -0
@@ -39,6 +39,7 @@ struct events_stats;enum auxtrace_type {PERF_AUXTRACE_UNKNOWN , +PERF_AUXTRACE_INTEL_PT , };enum itrace_period_type {
Signature · 1 line
1.9.1
tip-bot for Adrian Hunter
merge bot[tip:perf/core] perf auxtrace: Add Intel PT as an AUX area tracing type
perf auxtrace: Add Intel PT as an AUX area tracing type
Commit-ID:  55ea4ab4260f42b824450faa47fe4d129fce0918
Gitweb:     http://git.kernel.org/tip/55ea4ab4260f42b824450faa47fe4d129fce0918
Author:     Adrian Hunter <[email protected]>
AuthorDate: Fri, 17 Jul 2015 19:33:36 +0300
Committer:  Arnaldo Carvalho de Melo <[email protected]>
CommitDate: Mon, 17 Aug 2015 11:11:36 -0300
perf auxtrace: Add Intel PT as an AUX area tracing type
Add the Intel Processor Trace type constant PERF_AUXTRACE_INTEL_PT.
---
 tools/perf/util/auxtrace.c | 1 +
 tools/perf/util/auxtrace.h | 1 +
 2 files changed, 2 insertions(+)
tools/perf/util/auxtrace.c +1 -0
@@ -884,6 +884,7 @@ int perf_event__process_auxtrace_info(struct perf_tool *tool __maybe_unused,fprintf (stdout," type: %u\n" , type);switch (type) { +case PERF_AUXTRACE_INTEL_PT :case PERF_AUXTRACE_UNKNOWN :default :return -EINVAL ;
tools/perf/util/auxtrace.h +1 -0
@@ -39,6 +39,7 @@ struct events_stats;enum auxtrace_type {PERF_AUXTRACE_UNKNOWN , +PERF_AUXTRACE_INTEL_PT , };enum itrace_period_type {
Adrian Hunter
reviewerPATCH v8 2/25 perf tools: Add Intel PT packet decoder
In reply to Adrian HunterAdd support for decoding Intel Processor Trace packets.
This essentially provides intel_pt_get_packet() which takes a buffer of binary data and returns the decoded packet.
---
 tools/perf/util/Build                              |   1 +
 tools/perf/util/intel-pt-decoder/Build             |   1 +
 .../util/intel-pt-decoder/intel-pt-pkt-decoder.c   | 400 +++++++++++++++++++++
 .../util/intel-pt-decoder/intel-pt-pkt-decoder.h   |  64 ++++
 4 files changed, 466 insertions(+)
 create mode 100644 tools/perf/util/intel-pt-decoder/Build
 create mode 100644 tools/perf/util/intel-pt-decoder/intel-pt-pkt-decoder.c
 create mode 100644 tools/perf/util/intel-pt-decoder/intel-pt-pkt-decoder.h
tools/perf/util/Build +1 -0
@@ -76,6 +76,7 @@ libperf-$(CONFIG_X86) += tsc.o libperf-y += cloexec.o libperf-y += thread-stack.o libperf-$(CONFIG_AUXTRACE) += auxtrace.o +libperf-$(CONFIG_AUXTRACE) += intel-pt-decoder/ libperf-y += parse-branch-options.o libperf-$(CONFIG_LIBELF) += symbol-elf.o
tools/perf/util/intel-pt-decoder/Build new file +1 -0
@@ -0,0 +1 @@ +libperf-$(CONFIG_AUXTRACE) += intel-pt-pkt-decoder.o
tools/perf/util/intel-pt-decoder/intel-pt-pkt-decoder.c new file +400 -0
400 lines not on this page · raw message
tools/perf/util/intel-pt-decoder/intel-pt-pkt-decoder.h new file +64 -0
64 lines not on this page · raw message
Signature · 1 line
1.9.1
tip-bot for Adrian Hunter
merge bot[tip:perf/core] perf tools: Add Intel PT packet decoder
perf tools: Add Intel PT packet decoder
Commit-ID:  a4e925905c98fb83538c164878946d77d0df1433
Gitweb:     http://git.kernel.org/tip/a4e925905c98fb83538c164878946d77d0df1433
Author:     Adrian Hunter <[email protected]>
AuthorDate: Fri, 17 Jul 2015 19:33:37 +0300
Committer:  Arnaldo Carvalho de Melo <[email protected]>
CommitDate: Mon, 17 Aug 2015 11:11:36 -0300
perf tools: Add Intel PT packet decoder
Add support for decoding Intel Processor Trace packets.
This essentially provides intel_pt_get_packet() which takes a buffer of binary data and returns the decoded packet.
---
 tools/perf/util/Build                              |   1 +
 tools/perf/util/intel-pt-decoder/Build             |   1 +
 .../util/intel-pt-decoder/intel-pt-pkt-decoder.c   | 400 +++++++++++++++++++++
 .../util/intel-pt-decoder/intel-pt-pkt-decoder.h   |  64 ++++
 4 files changed, 466 insertions(+)
tools/perf/util/Build +1 -0
@@ -78,6 +78,7 @@ libperf-$(CONFIG_X86) += tsc.o libperf-y += cloexec.o libperf-y += thread-stack.o libperf-$(CONFIG_AUXTRACE) += auxtrace.o +libperf-$(CONFIG_AUXTRACE) += intel-pt-decoder/ libperf-y += parse-branch-options.o libperf-$(CONFIG_LIBELF) += symbol-elf.o
tools/perf/util/intel-pt-decoder/Build new file +1 -0
@@ -0,0 +1 @@ +libperf-$(CONFIG_AUXTRACE) += intel-pt-pkt-decoder.o
tools/perf/util/intel-pt-decoder/intel-pt-pkt-decoder.c new file +400 -0
400 lines not on this page · raw message
tools/perf/util/intel-pt-decoder/intel-pt-pkt-decoder.h new file +64 -0
64 lines not on this page · raw message
Adrian Hunter
reviewerPATCH v8 3/25 perf tools: Add Intel PT instruction decoder
In reply to Adrian HunterAdd support for decoding instructions for Intel Processor Trace. The kernel x86 instruction decoder is copied for this.
This essentially provides intel_pt_get_insn() which takes a binary buffer, uses the kernel's x86 instruction decoder to get details of the instruction and then categorizes it for consumption by an Intel PT decoder.
---
 tools/build/Makefile.build                         |   2 +
 tools/perf/.gitignore                              |   1 +
 tools/perf/Makefile.perf                           |  12 +-
 tools/perf/util/intel-pt-decoder/Build             |  12 +-
 .../util/intel-pt-decoder/gen-insn-attr-x86.awk    | 386 ++++++++
 tools/perf/util/intel-pt-decoder/inat.c            |  96 ++
 tools/perf/util/intel-pt-decoder/inat.h            | 221 +++++
 tools/perf/util/intel-pt-decoder/inat_types.h      |  29 +
 tools/perf/util/intel-pt-decoder/insn.c            | 594 +++++++++++++
 tools/perf/util/intel-pt-decoder/insn.h            | 201 +++++
 .../util/intel-pt-decoder/intel-pt-insn-decoder.c  | 246 ++++++
 .../util/intel-pt-decoder/intel-pt-insn-decoder.h  |  65 ++
 .../perf/util/intel-pt-decoder/x86-opcode-map.txt  | 970 +++++++++++++++++++++
 13 files changed, 2832 insertions(+), 3 deletions(-)
 create mode 100644 tools/perf/util/intel-pt-decoder/gen-insn-attr-x86.awk
 create mode 100644 tools/perf/util/intel-pt-decoder/inat.c
 create mode 100644 tools/perf/util/intel-pt-decoder/inat.h
 create mode 100644 tools/perf/util/intel-pt-decoder/inat_types.h
 create mode 100644 tools/perf/util/intel-pt-decoder/insn.c
 create mode 100644 tools/perf/util/intel-pt-decoder/insn.h
 create mode 100644 tools/perf/util/intel-pt-decoder/intel-pt-insn-decoder.c
 create mode 100644 tools/perf/util/intel-pt-decoder/intel-pt-insn-decoder.h
 create mode 100644 tools/perf/util/intel-pt-decoder/x86-opcode-map.txt
tools/build/Makefile.build +2 -0
@@ -57,6 +57,8 @@ quiet_cmd_cc_i_c = CPP $@ quiet_cmd_cc_s_c = AS $@ cmd_cc_s_c = $(CC) $(c_flags) -S -o $@ $< +quiet_cmd_gen = GEN $@ + # Link agregate command # If there's nothing to link, create empty $@ object. quiet_cmd_ld_multi = LD $@
tools/perf/.gitignore +1 -0
@@ -29,3 +29,4 @@ config.mak.autogen *.pyc *.pyo .config-detected +util/intel-pt-decoder/inat-tables.c
tools/perf/Makefile.perf +10 -2
@@ -76,6 +76,12 @@ include config/utilities.mak # # Define NO_AUXTRACE if you do not want AUX area tracing support +# As per kernel Makefile, avoid funny character set dependencies +unexport LC_ALL +LC_COLLATE=C +LC_NUMERIC=C +export LC_COLLATE LC_NUMERIC + ifeq ($(srctree),) srctree := $(patsubst %/,%,$(dir $(shell pwd))) srctree := $(patsubst %/,%,$(dir $(srctree)))
@@ -122,6 +128,7 @@ INSTALL = install
 FLEX    = flex
 BISON   = bison
 STRIP   = strip
+AWK     = awk

 LIB_DIR          = $(srctree)/tools/lib/api/
 TRACE_EVENT_DIR = $(srctree)/tools/lib/traceevent/
@@ -276,7 +283,7 @@ strip: $(PROGRAMS) $(OUTPUT)perf

 PERF_IN := $(OUTPUT)perf-in.o

-export srctree OUTPUT RM CC LD AR CFLAGS V BISON FLEX
+export srctree OUTPUT RM CC LD AR CFLAGS V BISON FLEX AWK
 build := -f $(srctree)/tools/build/Makefile.build dir=. obj

 $(PERF_IN): $(OUTPUT)PERF-VERSION-FILE $(OUTPUT)common-cmds.h FORCE
@@ -547,7 +554,8 @@ clean: $(LIBTRACEEVENT)-clean $(LIBAPI)-clean config-clean
 	$(Q)find . -name '*.o' -delete -o -name '\.*.cmd' -delete -o -name '\.*.d' -delete
 	$(Q)$(RM) $(OUTPUT).config-detected
 	$(call QUIET_CLEAN, core-progs) $(RM) $(ALL_PROGRAMS) perf perf-read-vdso32 perf-read-vdsox32
-	$(call QUIET_CLEAN, core-gen)   $(RM)  *.spec *.pyc *.pyo */*.pyc */*.pyo $(OUTPUT)common-cmds.h TAGS tags cscope* $(OUTPUT)PERF-VERSION-FILE $(OUTPUT)FEATURE-DUMP $(OUTPUT)util/*-bison* $(OUTPUT)util/*-flex*
+	$(call QUIET_CLEAN, core-gen)   $(RM)  *.spec *.pyc *.pyo */*.pyc */*.pyo $(OUTPUT)common-cmds.h TAGS tags cscope* $(OUTPUT)PERF-VERSION-FILE $(OUTPUT)FEATURE-DUMP $(OUTPUT)util/*-bison* $(OUTPUT)util/*-flex* \
+		$(OUTPUT)util/intel-pt-decoder/inat-tables.c
 	$(QUIET_SUBDIR0)Documentation $(QUIET_SUBDIR1) clean
 	$(python-clean)
tools/perf/util/intel-pt-decoder/Build +11 -1
@@ -1 +1,11 @@ -libperf-$(CONFIG_AUXTRACE) += intel-pt-pkt-decoder.o +libperf-$(CONFIG_AUXTRACE) += intel-pt-pkt-decoder.o intel-pt-insn-decoder.o + +inat_tables_script = util/intel-pt-decoder/gen-insn-attr-x86.awk +inat_tables_maps = util/intel-pt-decoder/x86-opcode-map.txt + +$(OUTPUT)util/intel-pt-decoder/inat-tables.c: $(inat_tables_script) $(inat_tables_maps) + @$(call echo-cmd,gen)$(AWK) -f $(inat_tables_script) $(inat_tables_maps) > $@ || rm -f $@ + +$(OUTPUT)util/intel-pt-decoder/intel-pt-insn-decoder.o: util/intel-pt-decoder/inat.c $(OUTPUT)util/intel-pt-decoder/inat-tables.c + +CFLAGS_intel-pt-insn-decoder.o += -I$(OUTPUT)util/intel-pt-decoder -Wno-override-init
tools/perf/util/intel-pt-decoder/gen-insn-attr-x86.awk new file +386 -0
386 lines not on this page · raw message
tools/perf/util/intel-pt-decoder/inat.c new file +96 -0
96 lines not on this page · raw message
tools/perf/util/intel-pt-decoder/inat.h new file +221 -0
221 lines not on this page · raw message
tools/perf/util/intel-pt-decoder/inat_types.h new file +29 -0
@@ -0,0 +1,29 @@ +#ifndef _ASM_X86_INAT_TYPES_H +#define _ASM_X86_INAT_TYPES_H +/* +* x86 instruction attributes +* +* Written by Masami Hiramatsu <[email protected]> +* +* This program is free software; you can redistribute it and/or modify +* it under the terms of the GNU General Public License as published by +* the Free Software Foundation; either version 2 of the License, or +* (at your option) any later version. +* +* This program is distributed in the hope that it will be useful, +* but WITHOUT ANY WARRANTY; without even the implied warranty of +* MERCHANTABILITY or FITNESS FOR A PARTICULAR PURPOSE. See the +* GNU General Public License for more details. +* +* You should have received a copy of the GNU General Public License +* along with this program; if not, write to the Free Software +* Foundation, Inc., 59 Temple Place - Suite 330, Boston, MA 02111-1307, USA. +* +*/ + +/* Instruction attributes */ +typedef unsigned int insn_attr_t ; +typedef unsigned char insn_byte_t ; +typedef signed int insn_value_t ; + +#endif
tools/perf/util/intel-pt-decoder/insn.c new file +594 -0
594 lines not on this page · raw message
tools/perf/util/intel-pt-decoder/insn.h new file +201 -0
201 lines not on this page · raw message
tools/perf/util/intel-pt-decoder/intel-pt-insn-decoder.c new file +246 -0
246 lines not on this page · raw message
tools/perf/util/intel-pt-decoder/intel-pt-insn-decoder.h new file +65 -0
65 lines not on this page · raw message
tools/perf/util/intel-pt-decoder/x86-opcode-map.txt new file +970 -0
970 lines not on this page · raw message
Signature · 1 line
1.9.1
Arnaldo Carvalho de Melo
maintainerRe: [PATCH V8 03/25] perf tools: Add Intel PT instruction decoder
Em Fri, Jul 17, 2015 at 07:33:38PM +0300, Adrian Hunter escreveu:
Quoted 7 lines
Add support for decoding instructions for Intel Processor Trace. The kernel x86 instruction decoder is copied for this.
This essentially provides
intel_pt_get_insn()which takes a binary buffer, uses the kernel's x86 instruction decoder to get details of the instruction and then categorizes it for consumption by an Intel PT decoder.
[acme@felicio linux]$ rm -rf /tmp/build/perf ; mkdir -p /tmp/build/perf ; make -C tools/perf O=/tmp/build/perf install-bin
make: Entering directory `/home/acme/git/linux/tools/perf'
BUILD: Doing 'make -j4' parallel build
Auto-detecting system features:
...                         dwarf: [ on  ]
...                         glibc: [ on  ]
...                          gtk2: [ on  ]
...                      libaudit: [ on  ]
...                        libbfd: [ on  ]
...                        libelf: [ on  ]
...                       libnuma: [ on  ]
...                       libperl: [ on  ]
...                     libpython: [ on  ]
...                      libslang: [ on  ]
...                     libunwind: [ on  ]
...            libdw-dwarf-unwind: [ on  ]
...                          zlib: [ on  ]
...                          lzma: [ on  ]
<SNIP>
  CC       /tmp/build/perf/util/thread-stack.o
  MKDIR    /tmp/build/perf/ui/tui/
  CC       /tmp/build/perf/ui/tui/setup.o
  CC       /tmp/build/perf/util/auxtrace.o
  MKDIR    /tmp/build/perf/ui/browsers/
  MKDIR    /tmp/build/perf/util/intel-pt-decoder/
  CC       /tmp/build/perf/ui/browsers/hists.o
  CC       /tmp/build/perf/util/intel-pt-decoder/intel-pt-pkt-decoder.o
  MKDIR    /tmp/build/perf/ui/tui/
  CC       /tmp/build/perf/ui/tui/util.o
  GEN      /tmp/build/perf/util/intel-pt-decoder/inat-tables.c
  MKDIR    /tmp/build/perf/util/scripting-engines/
  CC       /tmp/build/perf/util/scripting-engines/trace-event-perl.o
  CC       /tmp/build/perf/util/intel-pt-decoder/intel-pt-insn-decoder.o
  CC       /tmp/build/perf/ui/tui/helpline.o
  CC       /tmp/build/perf/ui/browsers/map.o
  CC       /tmp/build/perf/ui/browsers/scripts.o
  CC       /tmp/build/perf/ui/tui/progress.o
  MKDIR    /tmp/build/perf/util/scripting-engines/
  CC       /tmp/build/perf/util/scripting-engines/trace-event-python.o
util/intel-pt-decoder/intel-pt-insn-decoder.c:26:18: fatal error: insn.c: No such file or directory
 #include <insn.c>
                  ^
compilation terminated.
<SNIP>
make[4]: *** [/tmp/build/perf/util/intel-pt-decoder/intel-pt-insn-decoder.o] Error 1 make[3]: *** [intel-pt-decoder] Error 2
make[3]: *** Waiting for unfinished jobs....
MKDIR /tmp/build/perf/scripts/python/Perf-Trace-Util/
CC /tmp/build/perf/scripts/python/Perf-Trace-Util/Context.o
make[2]: *** [util] Error 2
make[2]: *** Waiting for unfinished jobs....
  LD       /tmp/build/perf/scripts/python/Perf-Trace-Util/libperf-in.o
  LD       /tmp/build/perf/scripts/perl/Perf-Trace-Util/libperf-in.o
  LD       /tmp/build/perf/scripts/libperf-in.o
make[1]: *** [/tmp/build/perf/libperf-in.o] Error 2
make: *** [install-bin] Error 2
make: Leaving directory `/home/acme/git/linux/tools/perf' [acme@felicio linux]$
It works if I just do:
cd tools/perf
make
- Arnaldo
Adrian Hunter
reviewerRe: [PATCH V8 03/25] perf tools: Add Intel PT instruction decoder
Quoted 55 lines · Arnaldo Carvalho de Melo
Em Fri, Jul 17, 2015 at 07:33:38PM +0300, Adrian Hunter escreveu:
Quoted 7 lines
Add support for decoding instructions for Intel Processor Trace. The kernel x86 instruction decoder is copied for this.
This essentially provides
intel_pt_get_insn()which takes a binary buffer, uses the kernel's x86 instruction decoder to get details of the instruction and then categorizes it for consumption by an Intel PT decoder.[acme@felicio linux]$ rm -rf
/tmp/build/perf; mkdir -p/tmp/build/perf; make -Ctools/perfO=/tmp/build/perf install-bin
make: Entering directory `/home/acme/git/linux/tools/perf'
BUILD: Doing 'make -j4' parallel buildAuto-detecting system features:
...                         dwarf: [ on  ]
...                         glibc: [ on  ]
...                          gtk2: [ on  ]
...                      libaudit: [ on  ]
...                        libbfd: [ on  ]
...                        libelf: [ on  ]
...                       libnuma: [ on  ]
...                       libperl: [ on  ]
...                     libpython: [ on  ]
...                      libslang: [ on  ]
...                     libunwind: [ on  ]
...            libdw-dwarf-unwind: [ on  ]
...                          zlib: [ on  ]
...                          lzma: [ on  ]
<SNIP>
  CC       /tmp/build/perf/util/thread-stack.o
  MKDIR    /tmp/build/perf/ui/tui/
  CC       /tmp/build/perf/ui/tui/setup.o
  CC       /tmp/build/perf/util/auxtrace.o
  MKDIR    /tmp/build/perf/ui/browsers/
  MKDIR    /tmp/build/perf/util/intel-pt-decoder/
  CC       /tmp/build/perf/ui/browsers/hists.o
  CC       /tmp/build/perf/util/intel-pt-decoder/intel-pt-pkt-decoder.o
  MKDIR    /tmp/build/perf/ui/tui/
  CC       /tmp/build/perf/ui/tui/util.o
  GEN      /tmp/build/perf/util/intel-pt-decoder/inat-tables.c
  MKDIR    /tmp/build/perf/util/scripting-engines/
  CC       /tmp/build/perf/util/scripting-engines/trace-event-perl.o
  CC       /tmp/build/perf/util/intel-pt-decoder/intel-pt-insn-decoder.o
  CC       /tmp/build/perf/ui/tui/helpline.o
  CC       /tmp/build/perf/ui/browsers/map.o
  CC       /tmp/build/perf/ui/browsers/scripts.o
  CC       /tmp/build/perf/ui/tui/progress.o
  MKDIR    /tmp/build/perf/util/scripting-engines/
  CC       /tmp/build/perf/util/scripting-engines/trace-event-python.o
util/intel-pt-decoder/intel-pt-insn-decoder.c:26:18: fatal error: insn.c: No such file or directory
 #include <insn.c>
                  ^
Quoted 1 line
compilation terminated.
I had a fix for this already but for some reason it fell in with the "for later" patches.
I will roll the fix in and send V9 of this patch.
Adrian Hunter
reviewerPATCH v9 3/25 perf tools: Add Intel PT instruction decoder
Add support for decoding instructions for Intel Processor Trace. The kernel x86 instruction decoder is copied for this.
This essentially provides intel_pt_get_insn() which takes a binary buffer, uses the kernel's x86 instruction decoder to get details of the instruction and then categorizes it for consumption by an Intel PT decoder.
---
Changes in V9:
insn.c is in the tools/perf sources and so should be included as "insn.c" not <insn.c>.
inat_types.h is in the kernel headers so is not needed in the tools/perf sources.
 tools/build/Makefile.build                         |   2 +
 tools/perf/.gitignore                              |   1 +
 tools/perf/Makefile.perf                           |  12 +-
 tools/perf/util/intel-pt-decoder/Build             |  12 +-
 .../util/intel-pt-decoder/gen-insn-attr-x86.awk    | 386 ++++++++
 tools/perf/util/intel-pt-decoder/inat.c            |  96 ++
 tools/perf/util/intel-pt-decoder/inat.h            | 221 +++++
 tools/perf/util/intel-pt-decoder/insn.c            | 594 +++++++++++++
 tools/perf/util/intel-pt-decoder/insn.h            | 201 +++++
 .../util/intel-pt-decoder/intel-pt-insn-decoder.c  | 246 ++++++
 .../util/intel-pt-decoder/intel-pt-insn-decoder.h  |  65 ++
 .../perf/util/intel-pt-decoder/x86-opcode-map.txt  | 970 +++++++++++++++++++++
 12 files changed, 2803 insertions(+), 3 deletions(-)
 create mode 100644 tools/perf/util/intel-pt-decoder/gen-insn-attr-x86.awk
 create mode 100644 tools/perf/util/intel-pt-decoder/inat.c
 create mode 100644 tools/perf/util/intel-pt-decoder/inat.h
 create mode 100644 tools/perf/util/intel-pt-decoder/insn.c
 create mode 100644 tools/perf/util/intel-pt-decoder/insn.h
 create mode 100644 tools/perf/util/intel-pt-decoder/intel-pt-insn-decoder.c
 create mode 100644 tools/perf/util/intel-pt-decoder/intel-pt-insn-decoder.h
 create mode 100644 tools/perf/util/intel-pt-decoder/x86-opcode-map.txt
tools/build/Makefile.build +2 -0
@@ -57,6 +57,8 @@ quiet_cmd_cc_i_c = CPP $@ quiet_cmd_cc_s_c = AS $@ cmd_cc_s_c = $(CC) $(c_flags) -S -o $@ $< +quiet_cmd_gen = GEN $@ + # Link agregate command # If there's nothing to link, create empty $@ object. quiet_cmd_ld_multi = LD $@
tools/perf/.gitignore +1 -0
@@ -29,3 +29,4 @@ config.mak.autogen *.pyc *.pyo .config-detected +util/intel-pt-decoder/inat-tables.c
tools/perf/Makefile.perf +10 -2
@@ -76,6 +76,12 @@ include config/utilities.mak # # Define NO_AUXTRACE if you do not want AUX area tracing support +# As per kernel Makefile, avoid funny character set dependencies +unexport LC_ALL +LC_COLLATE=C +LC_NUMERIC=C +export LC_COLLATE LC_NUMERIC + ifeq ($(srctree),) srctree := $(patsubst %/,%,$(dir $(shell pwd))) srctree := $(patsubst %/,%,$(dir $(srctree)))
@@ -135,6 +141,7 @@ INSTALL = install
 FLEX    = flex
 BISON   = bison
 STRIP   = strip
+AWK     = awk

 LIB_DIR          = $(srctree)/tools/lib/api/
 TRACE_EVENT_DIR = $(srctree)/tools/lib/traceevent/
@@ -289,7 +296,7 @@ strip: $(PROGRAMS) $(OUTPUT)perf

 PERF_IN := $(OUTPUT)perf-in.o

-export srctree OUTPUT RM CC LD AR CFLAGS V BISON FLEX
+export srctree OUTPUT RM CC LD AR CFLAGS V BISON FLEX AWK
 build := -f $(srctree)/tools/build/Makefile.build dir=. obj

 $(PERF_IN): $(OUTPUT)PERF-VERSION-FILE $(OUTPUT)common-cmds.h FORCE
@@ -565,7 +572,8 @@ clean: $(LIBTRACEEVENT)-clean $(LIBAPI)-clean config-clean
 	$(Q)find . -name '*.o' -delete -o -name '\.*.cmd' -delete -o -name '\.*.d' -delete
 	$(Q)$(RM) $(OUTPUT).config-detected
 	$(call QUIET_CLEAN, core-progs) $(RM) $(ALL_PROGRAMS) perf perf-read-vdso32 perf-read-vdsox32
-	$(call QUIET_CLEAN, core-gen)   $(RM)  *.spec *.pyc *.pyo */*.pyc */*.pyo $(OUTPUT)common-cmds.h TAGS tags cscope* $(OUTPUT)PERF-VERSION-FILE $(OUTPUT)FEATURE-DUMP $(OUTPUT)util/*-bison* $(OUTPUT)util/*-flex*
+	$(call QUIET_CLEAN, core-gen)   $(RM)  *.spec *.pyc *.pyo */*.pyc */*.pyo $(OUTPUT)common-cmds.h TAGS tags cscope* $(OUTPUT)PERF-VERSION-FILE $(OUTPUT)FEATURE-DUMP $(OUTPUT)util/*-bison* $(OUTPUT)util/*-flex* \
+		$(OUTPUT)util/intel-pt-decoder/inat-tables.c
 	$(QUIET_SUBDIR0)Documentation $(QUIET_SUBDIR1) clean
 	$(python-clean)
tools/perf/util/intel-pt-decoder/Build +11 -1
@@ -1 +1,11 @@ -libperf-$(CONFIG_AUXTRACE) += intel-pt-pkt-decoder.o +libperf-$(CONFIG_AUXTRACE) += intel-pt-pkt-decoder.o intel-pt-insn-decoder.o + +inat_tables_script = util/intel-pt-decoder/gen-insn-attr-x86.awk +inat_tables_maps = util/intel-pt-decoder/x86-opcode-map.txt + +$(OUTPUT)util/intel-pt-decoder/inat-tables.c: $(inat_tables_script) $(inat_tables_maps) + @$(call echo-cmd,gen)$(AWK) -f $(inat_tables_script) $(inat_tables_maps) > $@ || rm -f $@ + +$(OUTPUT)util/intel-pt-decoder/intel-pt-insn-decoder.o: util/intel-pt-decoder/inat.c $(OUTPUT)util/intel-pt-decoder/inat-tables.c + +CFLAGS_intel-pt-insn-decoder.o += -I$(OUTPUT)util/intel-pt-decoder -Wno-override-init
tools/perf/util/intel-pt-decoder/gen-insn-attr-x86.awk new file +386 -0
386 lines not on this page · raw message
tools/perf/util/intel-pt-decoder/inat.c new file +96 -0
96 lines not on this page · raw message
tools/perf/util/intel-pt-decoder/inat.h new file +221 -0
221 lines not on this page · raw message
tools/perf/util/intel-pt-decoder/insn.c new file +594 -0
594 lines not on this page · raw message
tools/perf/util/intel-pt-decoder/insn.h new file +201 -0
201 lines not on this page · raw message
tools/perf/util/intel-pt-decoder/intel-pt-insn-decoder.c new file +246 -0
246 lines not on this page · raw message
tools/perf/util/intel-pt-decoder/intel-pt-insn-decoder.h new file +65 -0
65 lines not on this page · raw message
tools/perf/util/intel-pt-decoder/x86-opcode-map.txt new file +970 -0
970 lines not on this page · raw message
Signature · 1 line
1.9.1
Arnaldo Carvalho de Melo
maintainerRe: [PATCH V9 03/25] perf tools: Add Intel PT instruction decoder
Em Thu, Aug 13, 2015 at 10:14:55AM +0300, Adrian Hunter escreveu:
Quoted 12 lines
Add support for decoding instructions for Intel Processor Trace. The kernel x86 instruction decoder is copied for this.
This essentially provides
intel_pt_get_insn()which takes a binary buffer, uses the kernel's x86 instruction decoder to get details of the instruction and then categorizes it for consumption by an Intel PT decoder.Signed-off-by Adrian Hunter <[email protected]>---
Quoted 7 lines
Changes in V9:
insn.cis in thetools/perfsources and so should be included as "insn.c" not <insn.c>.
inat_types.his in the kernel headers so is not needed in thetools/perfsources.
Thanks, now it builds with O=
- Arnaldo
tip-bot for Adrian Hunter
merge bot[tip:perf/core] perf tools: Add Intel PT instruction decoder
In reply to Adrian Hunterperf tools: Add Intel PT instruction decoder
Commit-ID:  237fae79f50d2d0c7bdeb039bc2c87fc6d52c7e7
Gitweb:     http://git.kernel.org/tip/237fae79f50d2d0c7bdeb039bc2c87fc6d52c7e7
Author:     Adrian Hunter <[email protected]>
AuthorDate: Thu, 13 Aug 2015 10:14:55 +0300
Committer:  Arnaldo Carvalho de Melo <[email protected]>
CommitDate: Mon, 17 Aug 2015 11:11:36 -0300
perf tools: Add Intel PT instruction decoder
Add support for decoding instructions for Intel Processor Trace. The kernel x86 instruction decoder is copied for this.
This essentially provides intel_pt_get_insn() which takes a binary buffer, uses the kernel's x86 instruction decoder to get details of the instruction and then categorizes it for consumption by an Intel PT decoder.
---
 tools/build/Makefile.build                         |   2 +
 tools/perf/.gitignore                              |   1 +
 tools/perf/Makefile.perf                           |  12 +-
 tools/perf/util/intel-pt-decoder/Build             |  12 +-
 .../util/intel-pt-decoder/gen-insn-attr-x86.awk    | 386 +++++++++++++++++++++
 tools/perf/util/intel-pt-decoder/inat.c            |  96 +++++
 .../perf/util/intel-pt-decoder}/inat.h             |   0
 .../perf/util/intel-pt-decoder}/insn.c             |   0
 .../perf/util/intel-pt-decoder}/insn.h             |   0
 .../util/intel-pt-decoder/intel-pt-insn-decoder.c  | 246 +++++++++++++
 .../util/intel-pt-decoder/intel-pt-insn-decoder.h  |  65 ++++
 .../perf/util/intel-pt-decoder}/x86-opcode-map.txt |   0
 12 files changed, 817 insertions(+), 3 deletions(-)
tools/build/Makefile.build +2 -0
@@ -57,6 +57,8 @@ quiet_cmd_cc_i_c = CPP $@ quiet_cmd_cc_s_c = AS $@ cmd_cc_s_c = $(CC) $(c_flags) -S -o $@ $< +quiet_cmd_gen = GEN $@ + # Link agregate command # If there's nothing to link, create empty $@ object. quiet_cmd_ld_multi = LD $@
tools/perf/.gitignore +1 -0
@@ -29,3 +29,4 @@ config.mak.autogen *.pyc *.pyo .config-detected +util/intel-pt-decoder/inat-tables.c
tools/perf/Makefile.perf +10 -2
@@ -76,6 +76,12 @@ include config/utilities.mak # # Define NO_AUXTRACE if you do not want AUX area tracing support +# As per kernel Makefile, avoid funny character set dependencies +unexport LC_ALL +LC_COLLATE=C +LC_NUMERIC=C +export LC_COLLATE LC_NUMERIC + ifeq ($(srctree),) srctree := $(patsubst %/,%,$(dir $(shell pwd))) srctree := $(patsubst %/,%,$(dir $(srctree)))
@@ -135,6 +141,7 @@ INSTALL = install
 FLEX    = flex
 BISON   = bison
 STRIP   = strip
+AWK     = awk

 LIB_DIR          = $(srctree)/tools/lib/api/
 TRACE_EVENT_DIR = $(srctree)/tools/lib/traceevent/
@@ -289,7 +296,7 @@ strip: $(PROGRAMS) $(OUTPUT)perf

 PERF_IN := $(OUTPUT)perf-in.o

-export srctree OUTPUT RM CC LD AR CFLAGS V BISON FLEX
+export srctree OUTPUT RM CC LD AR CFLAGS V BISON FLEX AWK
 build := -f $(srctree)/tools/build/Makefile.build dir=. obj

 $(PERF_IN): $(OUTPUT)PERF-VERSION-FILE $(OUTPUT)common-cmds.h FORCE
@@ -565,7 +572,8 @@ clean: $(LIBTRACEEVENT)-clean $(LIBAPI)-clean config-clean
 	$(Q)find . -name '*.o' -delete -o -name '\.*.cmd' -delete -o -name '\.*.d' -delete
 	$(Q)$(RM) $(OUTPUT).config-detected
 	$(call QUIET_CLEAN, core-progs) $(RM) $(ALL_PROGRAMS) perf perf-read-vdso32 perf-read-vdsox32
-	$(call QUIET_CLEAN, core-gen)   $(RM)  *.spec *.pyc *.pyo */*.pyc */*.pyo $(OUTPUT)common-cmds.h TAGS tags cscope* $(OUTPUT)PERF-VERSION-FILE $(OUTPUT)FEATURE-DUMP $(OUTPUT)util/*-bison* $(OUTPUT)util/*-flex*
+	$(call QUIET_CLEAN, core-gen)   $(RM)  *.spec *.pyc *.pyo */*.pyc */*.pyo $(OUTPUT)common-cmds.h TAGS tags cscope* $(OUTPUT)PERF-VERSION-FILE $(OUTPUT)FEATURE-DUMP $(OUTPUT)util/*-bison* $(OUTPUT)util/*-flex* \
+		$(OUTPUT)util/intel-pt-decoder/inat-tables.c
 	$(QUIET_SUBDIR0)Documentation $(QUIET_SUBDIR1) clean
 	$(python-clean)
tools/perf/util/intel-pt-decoder/Build +11 -1
@@ -1 +1,11 @@ -libperf-$(CONFIG_AUXTRACE) += intel-pt-pkt-decoder.o +libperf-$(CONFIG_AUXTRACE) += intel-pt-pkt-decoder.o intel-pt-insn-decoder.o + +inat_tables_script = util/intel-pt-decoder/gen-insn-attr-x86.awk +inat_tables_maps = util/intel-pt-decoder/x86-opcode-map.txt + +$(OUTPUT)util/intel-pt-decoder/inat-tables.c: $(inat_tables_script) $(inat_tables_maps) + @$(call echo-cmd,gen)$(AWK) -f $(inat_tables_script) $(inat_tables_maps) > $@ || rm -f $@ + +$(OUTPUT)util/intel-pt-decoder/intel-pt-insn-decoder.o: util/intel-pt-decoder/inat.c $(OUTPUT)util/intel-pt-decoder/inat-tables.c + +CFLAGS_intel-pt-insn-decoder.o += -I$(OUTPUT)util/intel-pt-decoder -Wno-override-init
tools/perf/util/intel-pt-decoder/gen-insn-attr-x86.awk new file +386 -0
386 lines not on this page · raw message
tools/perf/util/intel-pt-decoder/inat.c new file +96 -0
96 lines not on this page · raw message
tools/perf/util/intel-pt-decoder/inat.h renamed from arch/x86/include/asm/inat.h +0 -0
tools/perf/util/intel-pt-decoder/insn.c renamed from arch/x86/lib/insn.c +0 -0
tools/perf/util/intel-pt-decoder/insn.h renamed from arch/x86/include/asm/insn.h +0 -0
tools/perf/util/intel-pt-decoder/intel-pt-insn-decoder.c new file +246 -0
246 lines not on this page · raw message
tools/perf/util/intel-pt-decoder/intel-pt-insn-decoder.h new file +65 -0
65 lines not on this page · raw message
tools/perf/util/intel-pt-decoder/x86-opcode-map.txt renamed from arch/x86/lib/x86-opcode-map.txt +0 -0
Adrian Hunter
reviewerPATCH v8 4/25 perf tools: Add Intel PT log
In reply to Adrian HunterAdd a facility to log Intel Processor Trace decoding. The log is intended for debugging purposes only.
The log file name is "intel_pt.log" and is opened in the current directory. The log contains a record of all packets and instructions decoded and can get very large (10 MB would be a small one).
---
 tools/perf/util/intel-pt-decoder/Build          |   2 +-
 tools/perf/util/intel-pt-decoder/intel-pt-log.c | 155 ++++++++++++++++++++++++
 tools/perf/util/intel-pt-decoder/intel-pt-log.h |  52 ++++++++
 3 files changed, 208 insertions(+), 1 deletion(-)
 create mode 100644 tools/perf/util/intel-pt-decoder/intel-pt-log.c
 create mode 100644 tools/perf/util/intel-pt-decoder/intel-pt-log.h
tools/perf/util/intel-pt-decoder/Build +1 -1
@@ -1,4 +1,4 @@ -libperf-$(CONFIG_AUXTRACE) += intel-pt-pkt-decoder.o intel-pt-insn-decoder.o +libperf-$(CONFIG_AUXTRACE) += intel-pt-pkt-decoder.o intel-pt-insn-decoder.o intel-pt-log.o inat_tables_script = util/intel-pt-decoder/gen-insn-attr-x86.awk inat_tables_maps = util/intel-pt-decoder/x86-opcode-map.txt
tools/perf/util/intel-pt-decoder/intel-pt-log.c new file +155 -0
155 lines not on this page · raw message
tools/perf/util/intel-pt-decoder/intel-pt-log.h new file +52 -0
52 lines not on this page · raw message
Signature · 1 line
1.9.1
tip-bot for Adrian Hunter
merge bot[tip:perf/core] perf tools: Add Intel PT log
perf tools: Add Intel PT log
Commit-ID:  53af92849d793662e943d61bb16f7d3eb2d7a072
Gitweb:     http://git.kernel.org/tip/53af92849d793662e943d61bb16f7d3eb2d7a072
Author:     Adrian Hunter <[email protected]>
AuthorDate: Fri, 17 Jul 2015 19:33:39 +0300
Committer:  Arnaldo Carvalho de Melo <[email protected]>
CommitDate: Mon, 17 Aug 2015 11:11:36 -0300
perf tools: Add Intel PT log
Add a facility to log Intel Processor Trace decoding. The log is intended for debugging purposes only.
The log file name is "intel_pt.log" and is opened in the current directory. The log contains a record of all packets and instructions decoded and can get very large (10 MB would be a small one).
---
 tools/perf/util/intel-pt-decoder/Build          |   2 +-
 tools/perf/util/intel-pt-decoder/intel-pt-log.c | 155 ++++++++++++++++++++++++
 tools/perf/util/intel-pt-decoder/intel-pt-log.h |  52 ++++++++
 3 files changed, 208 insertions(+), 1 deletion(-)
tools/perf/util/intel-pt-decoder/Build +1 -1
@@ -1,4 +1,4 @@ -libperf-$(CONFIG_AUXTRACE) += intel-pt-pkt-decoder.o intel-pt-insn-decoder.o +libperf-$(CONFIG_AUXTRACE) += intel-pt-pkt-decoder.o intel-pt-insn-decoder.o intel-pt-log.o inat_tables_script = util/intel-pt-decoder/gen-insn-attr-x86.awk inat_tables_maps = util/intel-pt-decoder/x86-opcode-map.txt
tools/perf/util/intel-pt-decoder/intel-pt-log.c new file +155 -0
155 lines not on this page · raw message
tools/perf/util/intel-pt-decoder/intel-pt-log.h new file +52 -0
52 lines not on this page · raw message
Adrian Hunter
reviewerPATCH v8 5/25 perf tools: Add Intel PT decoder
In reply to Adrian HunterAdd support for decoding an Intel Processor Trace.
Intel PT trace data must be 'decoded' which involves walking the object code and matching the trace data packets.
The decoder requests a buffer of binary data via a get_trace() call-back, which it decodes using instruction information which it gets via another call-back walk_insn().
---
 tools/perf/util/intel-pt-decoder/Build             |    2 +-
 .../perf/util/intel-pt-decoder/intel-pt-decoder.c  | 1816 ++++++++++++++++++++
 .../perf/util/intel-pt-decoder/intel-pt-decoder.h  |  104 ++
 3 files changed, 1921 insertions(+), 1 deletion(-)
 create mode 100644 tools/perf/util/intel-pt-decoder/intel-pt-decoder.c
 create mode 100644 tools/perf/util/intel-pt-decoder/intel-pt-decoder.h
tools/perf/util/intel-pt-decoder/Build +1 -1
@@ -1,4 +1,4 @@ -libperf-$(CONFIG_AUXTRACE) += intel-pt-pkt-decoder.o intel-pt-insn-decoder.o intel-pt-log.o +libperf-$(CONFIG_AUXTRACE) += intel-pt-pkt-decoder.o intel-pt-insn-decoder.o intel-pt-log.o intel-pt-decoder.o inat_tables_script = util/intel-pt-decoder/gen-insn-attr-x86.awk inat_tables_maps = util/intel-pt-decoder/x86-opcode-map.txt
tools/perf/util/intel-pt-decoder/intel-pt-decoder.c new file +1816 -0
1,816 lines not on this page · raw message
tools/perf/util/intel-pt-decoder/intel-pt-decoder.h new file +104 -0
104 lines not on this page · raw message
Signature · 1 line
1.9.1
tip-bot for Adrian Hunter
merge bot[tip:perf/core] perf tools: Add Intel PT decoder
perf tools: Add Intel PT decoder
Commit-ID:  f4aa081949e7b6b01e711229c5a47ee3482a169c
Gitweb:     http://git.kernel.org/tip/f4aa081949e7b6b01e711229c5a47ee3482a169c
Author:     Adrian Hunter <[email protected]>
AuthorDate: Fri, 17 Jul 2015 19:33:40 +0300
Committer:  Arnaldo Carvalho de Melo <[email protected]>
CommitDate: Mon, 17 Aug 2015 11:11:36 -0300
perf tools: Add Intel PT decoder
Add support for decoding an Intel Processor Trace.
Intel PT trace data must be 'decoded' which involves walking the object code and matching the trace data packets.
The decoder requests a buffer of binary data via a get_trace() call-back, which it decodes using instruction information which it gets via another call-back walk_insn().
---
 tools/perf/util/intel-pt-decoder/Build             |    2 +-
 .../perf/util/intel-pt-decoder/intel-pt-decoder.c  | 1816 ++++++++++++++++++++
 .../perf/util/intel-pt-decoder/intel-pt-decoder.h  |  104 ++
 3 files changed, 1921 insertions(+), 1 deletion(-)
tools/perf/util/intel-pt-decoder/Build +1 -1
@@ -1,4 +1,4 @@ -libperf-$(CONFIG_AUXTRACE) += intel-pt-pkt-decoder.o intel-pt-insn-decoder.o intel-pt-log.o +libperf-$(CONFIG_AUXTRACE) += intel-pt-pkt-decoder.o intel-pt-insn-decoder.o intel-pt-log.o intel-pt-decoder.o inat_tables_script = util/intel-pt-decoder/gen-insn-attr-x86.awk inat_tables_maps = util/intel-pt-decoder/x86-opcode-map.txt
tools/perf/util/intel-pt-decoder/intel-pt-decoder.c new file +1816 -0
1,816 lines not on this page · raw message
tools/perf/util/intel-pt-decoder/intel-pt-decoder.h new file +104 -0
104 lines not on this page · raw message
Adrian Hunter
reviewerPATCH v8 6/25 perf tools: Add Intel PT support
In reply to Adrian HunterAdd support for Intel Processor Trace.
Intel PT support fits within the new auxtrace infrastructure. Recording is supporting by identifying the Intel PT PMU, parsing options and setting up events.
Decoding is supported by queuing up trace data by cpu or thread and then decoding synchronously delivering synthesized event samples into the session processing for tools to consume.
---
 tools/perf/arch/x86/util/Build      |    2 +
 tools/perf/arch/x86/util/intel-pt.c |  752 ++++++++++++++
 tools/perf/util/Build               |    1 +
 tools/perf/util/intel-pt.c          | 1911 +++++++++++++++++++++++++++++++++++
 tools/perf/util/intel-pt.h          |   51 +
 5 files changed, 2717 insertions(+)
 create mode 100644 tools/perf/arch/x86/util/intel-pt.c
 create mode 100644 tools/perf/util/intel-pt.c
 create mode 100644 tools/perf/util/intel-pt.h
tools/perf/arch/x86/util/Build +2 -0
@@ -6,3 +6,5 @@ libperf-$(CONFIG_DWARF) += dwarf-regs.o libperf-$(CONFIG_LIBUNWIND) += unwind-libunwind.o libperf-$(CONFIG_LIBDW_DWARF_UNWIND) += unwind-libdw.o + +libperf-$(CONFIG_AUXTRACE) += intel-pt.o
tools/perf/arch/x86/util/intel-pt.c new file +752 -0
752 lines not on this page · raw message
tools/perf/util/Build +1 -0
@@ -77,6 +77,7 @@ libperf-y += cloexec.o libperf-y += thread-stack.o libperf-$(CONFIG_AUXTRACE) += auxtrace.o libperf-$(CONFIG_AUXTRACE) += intel-pt-decoder/ +libperf-$(CONFIG_AUXTRACE) += intel-pt.o libperf-y += parse-branch-options.o libperf-$(CONFIG_LIBELF) += symbol-elf.o
tools/perf/util/intel-pt.c new file +1911 -0
1,911 lines not on this page · raw message
tools/perf/util/intel-pt.h new file +51 -0
51 lines not on this page · raw message
Signature · 1 line
1.9.1
tip-bot for Adrian Hunter
merge bot[tip:perf/core] perf tools: Add Intel PT support
perf tools: Add Intel PT support
Commit-ID:  90e457f7be0870052724b2d9c2c106e5847f2c19
Gitweb:     http://git.kernel.org/tip/90e457f7be0870052724b2d9c2c106e5847f2c19
Author:     Adrian Hunter <[email protected]>
AuthorDate: Fri, 17 Jul 2015 19:33:41 +0300
Committer:  Arnaldo Carvalho de Melo <[email protected]>
CommitDate: Mon, 17 Aug 2015 11:11:36 -0300
perf tools: Add Intel PT support
Add support for Intel Processor Trace.
Intel PT support fits within the new auxtrace infrastructure. Recording is supporting by identifying the Intel PT PMU, parsing options and setting up events.
Decoding is supported by queuing up trace data by cpu or thread and then decoding synchronously delivering synthesized event samples into the session processing for tools to consume.
---
 tools/perf/arch/x86/util/Build      |    2 +
 tools/perf/arch/x86/util/intel-pt.c |  752 ++++++++++++++
 tools/perf/util/Build               |    1 +
 tools/perf/util/intel-pt.c          | 1911 +++++++++++++++++++++++++++++++++++
 tools/perf/util/intel-pt.h          |   51 +
 5 files changed, 2717 insertions(+)
tools/perf/arch/x86/util/Build +2 -0
@@ -6,3 +6,5 @@ libperf-$(CONFIG_DWARF) += dwarf-regs.o libperf-$(CONFIG_LIBUNWIND) += unwind-libunwind.o libperf-$(CONFIG_LIBDW_DWARF_UNWIND) += unwind-libdw.o + +libperf-$(CONFIG_AUXTRACE) += intel-pt.o
tools/perf/arch/x86/util/intel-pt.c new file +752 -0
752 lines not on this page · raw message
tools/perf/util/Build +1 -0
@@ -79,6 +79,7 @@ libperf-y += cloexec.o libperf-y += thread-stack.o libperf-$(CONFIG_AUXTRACE) += auxtrace.o libperf-$(CONFIG_AUXTRACE) += intel-pt-decoder/ +libperf-$(CONFIG_AUXTRACE) += intel-pt.o libperf-y += parse-branch-options.o libperf-$(CONFIG_LIBELF) += symbol-elf.o
tools/perf/util/intel-pt.c new file +1911 -0
1,911 lines not on this page · raw message
tools/perf/util/intel-pt.h new file +51 -0
51 lines not on this page · raw message
Adrian Hunter
reviewerPATCH v8 7/25 perf tools: Take Intel PT into use
In reply to Adrian HunterTo record an AUX area, the weak function auxtrace_record__init() must be implemented.
Equally to decode an AUX area, the AUX area tracing type must be added to the perf_event__process_auxtrace_info() function.
This patch makes those two changes plus hooks up default config for the intel_pt PMU. Also some brief documentation is provided for using the tools with intel_pt.
E.g:
[root@perf4 ~]# dmesg
451 [0.405807] Performance Events: PEBS fmt2+, 16-deep LBR, Broadwell events, full-width counters, Intel PMU driver. [root@perf4 ~]# perf --version
perf version 4.1.g53874a
[root@perf4 ~]# perf record -e intel_pt//u -a sleep 10
[ perf record: Woken up 1 times to write data ]
[ perf record: Captured and wrote 0.383 MB perf.data ]
[root@perf4 ~]# perf evlist
intel_pt//u
sched:sched_switch
dummy:u
[root@perf4 ~]# perf report --stdio
# To display the perf.data header info, please use --header/--header-only options.
#
#
# Total Lost Samples: 0
#
# Samples: 0 of event 'intel_pt//u'
# Event count (approx.): 0
#
  # Overhead  Command  Shared Object  Symbol
  # ........  .......  .............  ......
#
# Samples: 393 of event 'sched:sched_switch'
# Event count (approx.): 393
#
  # Overhead  Command         Shared Object     Symbol
  # ........  ..............  ................  ..............
    49.62%  swapper         [kernel.vmlinux]  [k] __schedule
    10.69%  rcu_sched       [kernel.vmlinux]  [k] __schedule
     6.62%  rcuos/0         [kernel.vmlinux]  [k] __schedule
     5.60%  kworker/0:1     [kernel.vmlinux]  [k] __schedule
     3.56%  rcuos/3         [kernel.vmlinux]  [k] __schedule
     3.05%  kworker/u384:2  [kernel.vmlinux]  [k] __schedule
     2.54%  kworker/2:0     [kernel.vmlinux]  [k] __schedule
     2.54%  tuned           [kernel.vmlinux]  [k] __schedule
  <SNIP>
  # Samples: 0  of event 'dummy:u'
  # Event count (approx.): 0
  #
  # Overhead  Command  Shared Object  Symbol
  # ........  .......  .............  ......
# Samples: 28 of event 'instructions:u'
# Event count (approx.): 5030172
#
  # Overhead  Command     Shared Object        Symbol
  # ........  ..........  ...................  ................................
  #
    21.43%  tuned       libpython2.7.so.1.0  [.] PyEval_EvalFrameEx
                 |
                 ---PyEval_EvalFrameEx
                    |
                    |--83.33%-- PyEval_EvalCodeEx
                    |          PyEval_EvalFrameEx
                    |          |
                    |          |--60.00%-- PyEval_EvalCodeEx
                    |          |          PyEval_EvalFrameEx
                    |          |          PyEval_EvalFrameEx
                    |          |
                    |           --40.00%-- PyEval_EvalFrameEx
                    |
                     --16.67%-- PyEval_EvalFrameEx
                               PyEval_EvalCodeEx
                               PyEval_EvalFrameEx
                               PyEval_EvalCodeEx
                               PyEval_EvalFrameEx
                               PyEval_EvalFrameEx

    14.29%  tuned       libpython2.7.so.1.0  [.] _PyType_Lookup
                 |
                 ---_PyType_Lookup
                    _PyObject_GenericGetAttrWithDict
                    PyEval_EvalFrameEx
                    PyEval_EvalCodeEx
                    PyEval_EvalFrameEx
                    PyEval_EvalCodeEx
                    PyEval_EvalFrameEx
                    |
                    |--75.00%-- PyEval_EvalFrameEx
                    |
                     --25.00%-- PyEval_EvalCodeEx
                               PyEval_EvalFrameEx
                               PyEval_EvalFrameEx

     3.57%  irqbalance  irqbalance           [.] 0x0000000000004038
            |
            ---0x4038
               0x4761
               0x4761
               0x4761
               0x49f1
               0x2295

     3.57%  irqbalance  libc-2.17.so         [.] __GI_____strtoull_l_internal
            |
            ---__GI_____strtoull_l_internal
               0x6f49
               0x229a

     3.57%  irqbalance  libc-2.17.so         [.] __strchrnul
            |
            ---__strchrnul
               vfprintf
               __vsprintf_chk
               __sprintf_chk
               0x2724
               0x4038
               0x2331

     3.57%  irqbalance  libc-2.17.so         [.] __strstr_sse42
            |
            ---__strstr_sse42
               0x71e0
               0x229f
# And now to some userspace ftrace on uninstrumented binaries 8-) :
# Hand edited to make it a bit more compact, replacing /home/acme/bin/perf
# with /bin/perf:
[root@perf4 ~]# perf script
     perf 8921 [3] 7.310889: 1 branches:u:            0 [unknown] ([unknown]) => 7fcecadbf257 __GI___ioctl (/usr/lib64/libc-2.17.so)
     perf 8921 [3] 7.310889: 1 branches:u: 7fcecadbf25f __GI___ioctl (/usr/lib64/libc-2.17.so) => 481689 perf_evlist__enable (/bin/perf)
     perf 8921 [3] 7.310889: 1 branches:u:       481694 perf_evlist__enable (/bin/perf) => 481614 perf_evlist__enable (/bin/perf)
     perf 8921 [3] 7.310889: 1 branches:u:       481630 perf_evlist__enable (/bin/perf) => 4816d8 perf_evlist__enable (/bin/perf)
     perf 8921 [3] 7.310889: 1 branches:u:       4816de perf_evlist__enable (/bin/perf) => 48164f perf_evlist__enable (/bin/perf)
     perf 8921 [3] 7.310889: 1 branches:u:       481652 perf_evlist__enable (/bin/perf) => 48165f perf_evlist__enable (/bin/perf)
     perf 8921 [3] 7.310889: 1 branches:u:       481684 perf_evlist__enable (/bin/perf) => 41d250 ioctl@plt (/bin/perf)
     perf 8921 [3] 7.310889: 1 branches:u:       41d250 ioctl@plt (/bin/perf) => 7fcecadbf250 __GI___ioctl (/usr/lib64/libc-2.17.so)
     perf 8921 [3] 7.310889: 1 branches:u: 7fcecadbf255 __GI___ioctl (/usr/lib64/libc-2.17.so) => 0 [unknown] ([unknown])
     perf 8921 [3] 7.310890: 1 branches:u:            0 [unknown] ([unknown]) => 7fcecadbf257 __GI___ioctl (/usr/lib64/libc-2.17.so)
     perf 8921 [3] 7.310890: 1 branches:u: 7fcecadbf25f __GI___ioctl (/usr/lib64/libc-2.17.so) => 481689 perf_evlist__enable (/bin/perf)
     perf 8921 [3] 7.310890: 1 branches:u:       481694 perf_evlist__enable (/bin/perf) => 481614 perf_evlist__enable (/bin/perf)
     perf 8921 [3] 7.310890: 1 branches:u:       481652 perf_evlist__enable (/bin/perf) => 48165f perf_evlist__enable (/bin/perf)
     perf 8921 [3] 7.310890: 1 branches:u:       481684 perf_evlist__enable (/bin/perf) => 41d250 ioctl@plt (/bin/perf)
     perf 8921 [3] 7.310890: 1 branches:u:       41d250 ioctl@plt (/bin/perf) => 7fcecadbf250 __GI___ioctl (/usr/lib64/libc-2.17.so)
     perf 8921 [3] 7.310890: 1 branches:u: 7fcecadbf255 __GI___ioctl (/usr/lib64/libc-2.17.so) => 0 [unknown] ([unknown])
     perf 8921 [3] 7.310893: 1 branches:u:            0 [unknown] ([unknown]) => 7fcecadbf257 __GI___ioctl (/usr/lib64/libc-2.17.so)
     perf 8921 [3] 7.310893: 1 branches:u: 7fcecadbf25f __GI___ioctl (/usr/lib64/libc-2.17.so) => 481689 perf_evlist__enable (/bin/perf)
     perf 8921 [3] 7.310893: 1 branches:u:       4816a8 perf_evlist__enable (/bin/perf) => 4815f8 perf_evlist__enable (/bin/perf)
     perf 8921 [3] 7.310893: 1 branches:u:       4815fe perf_evlist__enable (/bin/perf) => 481614 perf_evlist__enable (/bin/perf)
     perf 8921 [3] 7.310893: 1 branches:u:       481652 perf_evlist__enable (/bin/perf) => 48165f perf_evlist__enable (/bin/perf)
     perf 8921 [3] 7.310893: 1 branches:u:       481684 perf_evlist__enable (/bin/perf) => 41d250 ioctl@plt (/bin/perf)
     perf 8921 [3] 7.310893: 1 branches:u:       41d250 ioctl@plt (/bin/perf) => 7fcecadbf250 __GI___ioctl (/usr/lib64/libc-2.17.so)
     perf 8921 [3] 7.310893: 1 branches:u: 7fcecadbf255 __GI___ioctl (/usr/lib64/libc-2.17.so) => 0 [unknown] ([unknown])
     perf 8921 [3] 7.310956: 1 branches:u:            0 [unknown] ([unknown]) => 7fcecadbf257 __GI___ioctl (/usr/lib64/libc-2.17.so)
     perf 8921 [3] 7.310956: 1 branches:u: 7fcecadbf25f __GI___ioctl (/usr/lib64/libc-2.17.so) => 481689 perf_evlist__enable (/bin/perf)
     perf 8921 [3] 7.310956: 1 branches:u:       481694 perf_evlist__enable (/bin/perf) => 481614 perf_evlist__enable (/bin/perf)
     perf 8921 [3] 7.310956: 1 branches:u:       481630 perf_evlist__enable (/bin/perf) => 4816d8 perf_evlist__enable (/bin/perf)
     perf 8921 [3] 7.310956: 1 branches:u:       4816de perf_evlist__enable (/bin/perf) => 48164f perf_evlist__enable (/bin/perf)
     perf 8921 [3] 7.310956: 1 branches:u:       481652 perf_evlist__enable (/bin/perf) => 48165f perf_evlist__enable (/bin/perf)
     perf 8921 [3] 7.310956: 1 branches:u:       481684 perf_evlist__enable (/bin/perf) => 41d250 ioctl@plt (/bin/perf)
     perf 8921 [3] 7.310956: 1 branches:u:       41d250 ioctl@plt (/bin/perf) => 7fcecadbf250 __GI___ioctl (/usr/lib64/libc-2.17.so)
     perf 8921 [3] 7.310956: 1 branches:u: 7fcecadbf255 __GI___ioctl (/usr/lib64/libc-2.17.so) => 0 [unknown] ([unknown])
     perf 8921 [3] 7.310961: 1 branches:u:            0 [unknown] ([unknown]) => 7fcecadbf257 __GI___ioctl (/usr/lib64/libc-2.17.so)
     perf 8921 [3] 7.310961: 1 branches:u: 7fcecadbf25f __GI___ioctl (/usr/lib64/libc-2.17.so) => 481689 perf_evlist__enable (/bin/perf)
     perf 8921 [3] 7.310961: 1 branches:u:       481694 perf_evlist__enable (/bin/perf) => 481614 perf_evlist__enable (/bin/perf)
     perf 8921 [3] 7.310961: 1 branches:u:       481652 perf_evlist__enable (/bin/perf) => 48165f perf_evlist__enable (/bin/perf)
     perf 8921 [3] 7.310961: 1 branches:u:       481684 perf_evlist__enable (/bin/perf) => 41d250 ioctl@plt (/bin/perf)
     perf 8921 [3] 7.310961: 1 branches:u:       41d250 ioctl@plt (/bin/perf) => 7fcecadbf250 __GI___ioctl (/usr/lib64/libc-2.17.so)
     perf 8921 [3] 7.310961: 1 branches:u: 7fcecadbf255 __GI___ioctl (/usr/lib64/libc-2.17.so) => 0 [unknown] ([unknown])
     perf 8921 [3] 7.310968: 1 branches:u:            0 [unknown] ([unknown]) => 7fcecadbf257 __GI___ioctl (/usr/lib64/libc-2.17.so)
     perf 8921 [3] 7.310968: 1 branches:u: 7fcecadbf25f __GI___ioctl (/usr/lib64/libc-2.17.so) => 481689 perf_evlist__enable (/bin/perf)
     perf 8921 [3] 7.310968: 1 branches:u:       4816a8 perf_evlist__enable (/bin/perf) => 4815f8 perf_evlist__enable (/bin/perf)
     perf 8921 [3] 7.310968: 1 branches:u:       4815fe perf_evlist__enable (/bin/perf) => 481614 perf_evlist__enable (/bin/perf)
     perf 8921 [3] 7.310968: 1 branches:u:       481652 perf_evlist__enable (/bin/perf) => 48165f perf_evlist__enable (/bin/perf)
     perf 8921 [3] 7.310968: 1 branches:u:       481684 perf_evlist__enable (/bin/perf) => 41d250 ioctl@plt (/bin/perf)
     perf 8921 [3] 7.310968: 1 branches:u:       41d250 ioctl@plt (/bin/perf) => 7fcecadbf250 __GI___ioctl (/usr/lib64/libc-2.17.so)
     perf 8921 [3] 7.310968: 1 branches:u: 7fcecadbf255 __GI___ioctl (/usr/lib64/libc-2.17.so) => 0 [unknown] ([unknown])
     perf 8921 [3] 7.311040: 1 branches:u:            0 [unknown] ([unknown]) => 7fcecadbf257 __GI___ioctl (/usr/lib64/libc-2.17.so)
     perf 8921 [3] 7.311040: 1 branches:u: 7fcecadbf25f __GI___ioctl (/usr/lib64/libc-2.17.so) => 481689 perf_evlist__enable (/bin/perf)
     perf 8921 [3] 7.311040: 1 branches:u:       481694 perf_evlist__enable (/bin/perf) => 481614 perf_evlist__enable (/bin/perf)
     perf 8921 [3] 7.311040: 1 branches:u:       481630 perf_evlist__enable (/bin/perf) => 4816d8 perf_evlist__enable (/bin/perf)
     perf 8921 [3] 7.311040: 1 branches:u:       4816de perf_evlist__enable (/bin/perf) => 48164f perf_evlist__enable (/bin/perf)
     perf 8921 [3] 7.311040: 1 branches:u:       481652 perf_evlist__enable (/bin/perf) => 48165f perf_evlist__enable (/bin/perf)
     perf 8921 [3] 7.311040: 1 branches:u:       481684 perf_evlist__enable (/bin/perf) => 41d250 ioctl@plt (/bin/perf)
     perf 8921 [3] 7.311040: 1 branches:u:       41d250 ioctl@plt (/bin/perf) => 7fcecadbf250 __GI___ioctl (/usr/lib64/libc-2.17.so)
     perf 8921 [3] 7.311040: 1 branches:u: 7fcecadbf255 __GI___ioctl (/usr/lib64/libc-2.17.so) => 0 [unknown] ([unknown])
     perf 8921 [3] 7.311046: 1 branches:u:            0 [unknown] ([unknown]) => 7fcecadbf257 __GI___ioctl (/usr/lib64/libc-2.17.so)
     perf 8921 [3] 7.311046: 1 branches:u: 7fcecadbf25f __GI___ioctl (/usr/lib64/libc-2.17.so) => 481689 perf_evlist__enable (/bin/perf)
     perf 8921 [3] 7.311046: 1 branches:u:       481694 perf_evlist__enable (/bin/perf) => 481614 perf_evlist__enable (/bin/perf)
     perf 8921 [3] 7.311046: 1 branches:u:       481652 perf_evlist__enable (/bin/perf) => 48165f perf_evlist__enable (/bin/perf)
     perf 8921 [3] 7.311046: 1 branches:u:       481684 perf_evlist__enable (/bin/perf) => 41d250 ioctl@plt (/bin/perf)
     perf 8921 [3] 7.311046: 1 branches:u:       41d250 ioctl@plt (/bin/perf) => 7fcecadbf250 __GI___ioctl (/usr/lib64/libc-2.17.so)
     perf 8921 [3] 7.311046: 1 branches:u: 7fcecadbf255 __GI___ioctl (/usr/lib64/libc-2.17.so) => 0 [unknown] ([unknown])
     perf 8921 [3] 7.311050: 1 branches:u:            0 [unknown] ([unknown]) => 7fcecadbf257 __GI___ioctl (/usr/lib64/libc-2.17.so)
     perf 8921 [3] 7.311050: 1 branches:u: 7fcecadbf25f __GI___ioctl (/usr/lib64/libc-2.17.so) => 481689 perf_evlist__enable (/bin/perf)
:
---
 tools/perf/Documentation/intel-pt.txt | 588 ++++++++++++++++++++++++++++++++++
 tools/perf/arch/x86/util/Build        |   2 +
 tools/perf/arch/x86/util/auxtrace.c   |  38 +++
 tools/perf/arch/x86/util/pmu.c        |  15 +
 tools/perf/util/auxtrace.c            |   5 +-
 tools/perf/util/pmu.c                 |   4 +-
 6 files changed, 649 insertions(+), 3 deletions(-)
 create mode 100644 tools/perf/Documentation/intel-pt.txt
 create mode 100644 tools/perf/arch/x86/util/auxtrace.c
 create mode 100644 tools/perf/arch/x86/util/pmu.c
tools/perf/Documentation/intel-pt.txt new file +588 -0
@@ -0,0 +1,588 @@ +Intel Processor Trace +===================== + +Overview +======== + +Intel Processor Trace (Intel PT) is an extension of Intel Architecture that +collects information about software execution such as control flow, execution +modes and timings and formats it into highly compressed binary packets. +Technical details are documented in the Intel 64 and IA-32 Architectures +Software Developer Manuals, Chapter 36 Intel Processor Trace. + +Intel PT is first supported in Intel Core M and 5th generation Intel Core +processors that are based on the Intel micro-architecture code name Broadwell. + +Trace data is collected by 'perf record' and stored within the perf.data file. +See below for options to 'perf record'. + +Trace data must be 'decoded' which involves walking the object code and matching +the trace data packets. For example a TNT packet only tells whether a +conditional branch was taken or not taken, so to make use of that packet the +decoder must know precisely which instruction was being executed. + +Decoding is done on-the-fly. The decoder outputs samples in the same format as +samples output by perf hardware events, for example as though the "instructions" +or "branches" events had been recorded. Presently 3 tools support this: +'perf script', 'perf report' and 'perf inject'. See below for more information +on using those tools. + +The main distinguishing feature of Intel PT is that the decoder can determine +the exact flow of software execution. Intel PT can be used to understand why +and how did software get to a certain point, or behave a certain way. The +software does not have to be recompiled, so Intel PT works with debug or release +builds, however the executed images are needed - which makes use in JIT-compiled +environments, or with self-modified code, a challenge. Also symbols need to be +provided to make sense of addresses. + +A limitation of Intel PT is that it produces huge amounts of trace data +(hundreds of megabytes per second per core) which takes a long time to decode, +for example two or three orders of magnitude longer than it took to collect. +Another limitation is the performance impact of tracing, something that will +vary depending on the use-case and architecture. + + +Quickstart +========== + +It is important to start small. That is because it is easy to capture vastly +more data than can possibly be processed. + +The simplest thing to do with Intel PT is userspace profiling of small programs. +Data is captured with 'perf record' e.g. to trace 'ls' userspace-only: + + perf record -e intel_pt//u ls + +And profiled with 'perf report' e.g. + + perf report + +To also trace kernel space presents a problem, namely kernel self-modifying +code. A fairly good kernel image is available in /proc/kcore but to get an +accurate image a copy of /proc/kcore needs to be made under the same conditions +as the data capture. A script perf-with-kcore can do that, but beware that the +script makes use of 'sudo' to copy /proc/kcore. If you have perf installed +locally from the source tree you can do: + + ~/libexec/perf-core/perf-with-kcore record pt_ls -e intel_pt// -- ls + +which will create a directory named 'pt_ls' and put the perf.data file and +copies of /proc/kcore, /proc/kallsyms and /proc/modules into it. Then to use +'perf report' becomes: + + ~/libexec/perf-core/perf-with-kcore report pt_ls + +Because samples are synthesized after-the-fact, the sampling period can be +selected for reporting. e.g. sample every microsecond + + ~/libexec/perf-core/perf-with-kcore report pt_ls --itrace=i1usge + +See the sections below for more information about the --itrace option. + +Beware the smaller the period, the more samples that are produced, and the +longer it takes to process them. + +Also note that the coarseness of Intel PT timing information will start to +distort the statistical value of the sampling as the sampling period becomes +smaller. + +To represent software control flow, "branches" samples are produced. By default +a branch sample is synthesized for every single branch. To get an idea what +data is available you can use the 'perf script' tool with no parameters, which +will list all the samples. + + perf record -e intel_pt//u ls + perf script + +An interesting field that is not printed by default is 'flags' which can be +displayed as follows: + + perf script -Fcomm,tid,pid,time,cpu,event,trace,ip,sym,dso,addr,symoff,flags + +The flags are "bcrosyiABEx" which stand for branch, call, return, conditional, +system, asynchronous, interrupt, transaction abort, trace begin, trace end, and +in transaction, respectively. + +While it is possible to create scripts to analyze the data, an alternative +approach is available to export the data to a postgresql database. Refer to +script export-to-postgresql.py for more details, and to script +call-graph-from-postgresql.py for an example of using the database. + +As mentioned above, it is easy to capture too much data. One way to limit the +data captured is to use 'snapshot' mode which is explained further below. +Refer to 'new snapshot option' and 'Intel PT modes of operation' further below. + +Another problem that will be experienced is decoder errors. They can be caused +by inability to access the executed image, self-modified or JIT-ed code, or the +inability to match side-band information (such as context switches and mmaps) +which results in the decoder not knowing what code was executed. + +There is also the problem of perf not being able to copy the data fast enough, +resulting in data lost because the buffer was full. See 'Buffer handling' below +for more details. + + +perf record +=========== + +new event +--------- + +The Intel PT kernel driver creates a new PMU for Intel PT. PMU events are +selected by providing the PMU name followed by the "config" separated by slashes. +An enhancement has been made to allow default "config" e.g. the option + + -e intel_pt// + +will use a default config value. Currently that is the same as + + -e intel_pt/tsc,noretcomp=0/ + +which is the same as + + -e intel_pt/tsc=1,noretcomp=0/ + +The config terms are listed in /sys/devices/intel_pt/format. They are bit +fields within the config member of the struct perf_event_attr which is +passed to the kernel by the perf_event_open system call. They correspond to bit +fields in the IA32_RTIT_CTL MSR. Here is a list of them and their definitions: + + $ for f in `ls /sys/devices/intel_pt/format`;do + > echo $f + > cat /sys/devices/intel_pt/format/$f + > done + noretcomp + config:11 + tsc + config:10 + +Note that the default config must be overridden for each term i.e. + + -e intel_pt/noretcomp=0/ + +is the same as: + + -e intel_pt/tsc=1,noretcomp=0/ + +So, to disable TSC packets use: + + -e intel_pt/tsc=0/ + +It is also possible to specify the config value explicitly: + + -e intel_pt/config=0x400/ + +Note that, as with all events, the event is suffixed with event modifiers: + + u userspace + k kernel + h hypervisor + G guest + H host + p precise ip + +'h', 'G' and 'H' are for virtualization which is not supported by Intel PT. +'p' is also not relevant to Intel PT. So only options 'u' and 'k' are +meaningful for Intel PT. + +perf_event_attr is displayed if the -vv option is used e.g. + + ------------------------------------------------------------ + perf_event_attr: + type 6 + size 112 + config 0x400 + { sample_period, sample_freq } 1 + sample_type IP|TID|TIME|CPU|IDENTIFIER + read_format ID + disabled 1 + inherit 1 + exclude_kernel 1 + exclude_hv 1 + enable_on_exec 1 + sample_id_all 1 + ------------------------------------------------------------ + sys_perf_event_open: pid 31104 cpu 0 group_fd -1 flags 0x8 + sys_perf_event_open: pid 31104 cpu 1 group_fd -1 flags 0x8 + sys_perf_event_open: pid 31104 cpu 2 group_fd -1 flags 0x8 + sys_perf_event_open: pid 31104 cpu 3 group_fd -1 flags 0x8 + ------------------------------------------------------------ + + +new snapshot option +------------------- + +To select snapshot mode a new option has been added: + + -S + +Optionally it can be followed by the snapshot size e.g. + + -S0x100000 + +The default snapshot size is the auxtrace mmap size. If neither auxtrace mmap size +nor snapshot size is specified, then the default is 4MiB for privileged users +(or if /proc/sys/kernel/perf_event_paranoid < 0), 128KiB for unprivileged users. +If an unprivileged user does not specify mmap pages, the mmap pages will be +reduced as described in the 'new auxtrace mmap size option' section below. + +The snapshot size is displayed if the option -vv is used e.g. + + Intel PT snapshot size: %zu + + +new auxtrace mmap size option +--------------------------- + +Intel PT buffer size is specified by an addition to the -m option e.g. + + -m,16 + +selects a buffer size of 16 pages i.e. 64KiB. + +Note that the existing functionality of -m is unchanged. The auxtrace mmap size +is specified by the optional addition of a comma and the value. + +The default auxtrace mmap size for Intel PT is 4MiB/page_size for privileged users +(or if /proc/sys/kernel/perf_event_paranoid < 0), 128KiB for unprivileged users. +If an unprivileged user does not specify mmap pages, the mmap pages will be +reduced from the default 512KiB/page_size to 256KiB/page_size, otherwise the +user is likely to get an error as they exceed their mlock limit (Max locked +memory as shown in /proc/self/limits). Note that perf does not count the first +512KiB (actually /proc/sys/kernel/perf_event_mlock_kb minus 1 page) per cpu +against the mlock limit so an unprivileged user is allowed 512KiB per cpu plus +their mlock limit (which defaults to 64KiB but is not multiplied by the number +of cpus). + +In full-trace mode, powers of two are allowed for buffer size, with a minimum +size of 2 pages. In snapshot mode, it is the same but the minimum size is +1 page. + +The mmap size and auxtrace mmap size are displayed if the -vv option is used e.g. + + mmap length 528384 + auxtrace mmap length 4198400 + + +Intel PT modes of operation +--------------------------- + +Intel PT can be used in 2 modes: + full-trace mode + snapshot mode + +Full-trace mode traces continuously e.g. + + perf record -e intel_pt//u uname + +Snapshot mode captures the available data when a signal is sent e.g. + + perf record -v -e intel_pt//u -S ./loopy 1000000000 & + [1] 11435 + kill -USR2 11435 + Recording AUX area tracing snapshot + +Note that the signal sent is SIGUSR2. +Note that "Recording AUX area tracing snapshot" is displayed because the -v +option is used. + +The 2 modes cannot be used together. + + +Buffer handling +--------------- + +There may be buffer limitations (i.e. single ToPa entry) which means that actual +buffer sizes are limited to powers of 2 up to 4MiB (MAX_ORDER). In order to +provide other sizes, and in particular an arbitrarily large size, multiple +buffers are logically concatenated. However an interrupt must be used to switch +between buffers. That has two potential problems: + a) the interrupt may not be handled in time so that the current buffer + becomes full and some trace data is lost. + b) the interrupts may slow the system and affect the performance + results. + +If trace data is lost, the driver sets 'truncated' in the PERF_RECORD_AUX event +which the tools report as an error. + +In full-trace mode, the driver waits for data to be copied out before allowing +the (logical) buffer to wrap-around. If data is not copied out quickly enough, +again 'truncated' is set in the PERF_RECORD_AUX event. If the driver has to +wait, the intel_pt event gets disabled. Because it is difficult to know when +that happens, perf tools always re-enable the intel_pt event after copying out +data. + + +Intel PT and build ids +---------------------- + +By default "perf record" post-processes the event stream to find all build ids +for executables for all addresses sampled. Deliberately, Intel PT is not +decoded for that purpose (it would take too long). Instead the build ids for +all executables encountered (due to mmap, comm or task events) are included +in the perf.data file. + +To see buildids included in the perf.data file use the command: + + perf buildid-list + +If the perf.data file contains Intel PT data, that is the same as: + + perf buildid-list --with-hits + + +Snapshot mode and event disabling +--------------------------------- + +In order to make a snapshot, the intel_pt event is disabled using an IOCTL, +namely PERF_EVENT_IOC_DISABLE. However doing that can also disable the +collection of side-band information. In order to prevent that, a dummy +software event has been introduced that permits tracking events (like mmaps) to +continue to be recorded while intel_pt is disabled. That is important to ensure +there is complete side-band information to allow the decoding of subsequent +snapshots. + +A test has been created for that. To find the test: + + perf test list + ... + 23: Test using a dummy software event to keep tracking + +To run the test: + + perf test 23 + 23: Test using a dummy software event to keep tracking : Ok + + +perf record modes (nothing new here) +------------------------------------ + +perf record essentially operates in one of three modes: + per thread + per cpu + workload only + +"per thread" mode is selected by -t or by --per-thread (with -p or -u or just a +workload). +"per cpu" is selected by -C or -a. +"workload only" mode is selected by not using the other options but providing a +command to run (i.e. the workload). + +In per-thread mode an exact list of threads is traced. There is no inheritance. +Each thread has its own event buffer. + +In per-cpu mode all processes (or processes from the selected cgroup i.e. -G +option, or processes selected with -p or -u) are traced. Each cpu has its own +buffer. Inheritance is allowed. + +In workload-only mode, the workload is traced but with per-cpu buffers. +Inheritance is allowed. Note that you can now trace a workload in per-thread +mode by using the --per-thread option. + + +Privileged vs non-privileged users +---------------------------------- + +Unless /proc/sys/kernel/perf_event_paranoid is set to -1, unprivileged users +have memory limits imposed upon them. That affects what buffer sizes they can +have as outlined above. + +Unless /proc/sys/kernel/perf_event_paranoid is set to -1, unprivileged users are +not permitted to use tracepoints which means there is insufficient side-band +information to decode Intel PT in per-cpu mode, and potentially workload-only +mode too if the workload creates new processes. + +Note also, that to use tracepoints, read-access to debugfs is required. So if +debugfs is not mounted or the user does not have read-access, it will again not +be possible to decode Intel PT in per-cpu mode. + + +sched_switch tracepoint +----------------------- + +The sched_switch tracepoint is used to provide side-band data for Intel PT +decoding. sched_switch events are automatically added. e.g. the second event +shown below + + $ perf record -vv -e intel_pt//u uname + ------------------------------------------------------------ + perf_event_attr: + type 6 + size 112 + config 0x400 + { sample_period, sample_freq } 1 + sample_type IP|TID|TIME|CPU|IDENTIFIER + read_format ID + disabled 1 + inherit 1 + exclude_kernel 1 + exclude_hv 1 + enable_on_exec 1 + sample_id_all 1 + ------------------------------------------------------------ + sys_perf_event_open: pid 31104 cpu 0 group_fd -1 flags 0x8 + sys_perf_event_open: pid 31104 cpu 1 group_fd -1 flags 0x8 + sys_perf_event_open: pid 31104 cpu 2 group_fd -1 flags 0x8 + sys_perf_event_open: pid 31104 cpu 3 group_fd -1 flags 0x8 + ------------------------------------------------------------ + perf_event_attr: + type 2 + size 112 + config 0x108 + { sample_period, sample_freq } 1 + sample_type IP|TID|TIME|CPU|PERIOD|RAW|IDENTIFIER + read_format ID + inherit 1 + sample_id_all 1 + exclude_guest 1 + ------------------------------------------------------------ + sys_perf_event_open: pid -1 cpu 0 group_fd -1 flags 0x8 + sys_perf_event_open: pid -1 cpu 1 group_fd -1 flags 0x8 + sys_perf_event_open: pid -1 cpu 2 group_fd -1 flags 0x8 + sys_perf_event_open: pid -1 cpu 3 group_fd -1 flags 0x8 + ------------------------------------------------------------ + perf_event_attr: + type 1 + size 112 + config 0x9 + { sample_period, sample_freq } 1 + sample_type IP|TID|TIME|IDENTIFIER + read_format ID + disabled 1 + inherit 1 + exclude_kernel 1 + exclude_hv 1 + mmap 1 + comm 1 + enable_on_exec 1 + task 1 + sample_id_all 1 + mmap2 1 + comm_exec 1 + ------------------------------------------------------------ + sys_perf_event_open: pid 31104 cpu 0 group_fd -1 flags 0x8 + sys_perf_event_open: pid 31104 cpu 1 group_fd -1 flags 0x8 + sys_perf_event_open: pid 31104 cpu 2 group_fd -1 flags 0x8 + sys_perf_event_open: pid 31104 cpu 3 group_fd -1 flags 0x8 + mmap size 528384B + AUX area mmap length 4194304 + perf event ring buffer mmapped per cpu + Synthesizing auxtrace information + Linux + [ perf record: Woken up 1 times to write data ] + [ perf record: Captured and wrote 0.042 MB perf.data ] + +Note, the sched_switch event is only added if the user is permitted to use it +and only in per-cpu mode. + +Note also, the sched_switch event is only added if TSC packets are requested. +That is because, in the absence of timing information, the sched_switch events +cannot be matched against the Intel PT trace. + + +perf script +=========== + +By default, perf script will decode trace data found in the perf.data file. +This can be further controlled by new option --itrace. + + +New --itrace option +------------------- + +Having no option is the same as + + --itrace + +which, in turn, is the same as + + --itrace=ibxe + +The letters are: + + i synthesize "instructions" events + b synthesize "branches" events + x synthesize "transactions" events + c synthesize branches events (calls only) + r synthesize branches events (returns only) + e synthesize tracing error events + d create a debug log + g synthesize a call chain (use with i or x) + +"Instructions" events look like they were recorded by "perf record -e +instructions". + +"Branches" events look like they were recorded by "perf record -e branches". "c" +and "r" can be combined to get calls and returns. + +"Transactions" events correspond to the start or end of transactions. The +'flags' field can be used in perf script to determine whether the event is a +tranasaction start, commit or abort. + +Error events are new. They show where the decoder lost the trace. Error events +are quite important. Users must know if what they are seeing is a complete +picture or not. + +The "d" option will cause the creation of a file "intel_pt.log" containing all +decoded packets and instructions. Note that this option slows down the decoder +and that the resulting file may be very large. + +In addition, the period of the "instructions" event can be specified. e.g. + + --itrace=i10us + +sets the period to 10us i.e. one instruction sample is synthesized for each 10 +microseconds of trace. Alternatives to "us" are "ms" (milliseconds), +"ns" (nanoseconds), "t" (TSC ticks) or "i" (instructions). + +"ms", "us" and "ns" are converted to TSC ticks. + +The timing information included with Intel PT does not give the time of every +instruction. Consequently, for the purpose of sampling, the decoder estimates +the time since the last timing packet based on 1 tick per instruction. The time +on the sample is *not* adjusted and reflects the last known value of TSC. + +For Intel PT, the default period is 100us. + +Also the call chain size (default 16, max. 1024) for instructions or +transactions events can be specified. e.g. + + --itrace=ig32 + --itrace=xg32 + +To disable trace decoding entirely, use the option --no-itrace. + + +dump option +----------- + +perf script has an option (-D) to "dump" the events i.e. display the binary +data. + +When -D is used, Intel PT packets are displayed. The packet decoder does not +pay attention to PSB packets, but just decodes the bytes - so the packets seen +by the actual decoder may not be identical in places where the data is corrupt. +One example of that would be when the buffer-switching interrupt has been too +slow, and the buffer has been filled completely. In that case, the last packet +in the buffer might be truncated and immediately followed by a PSB as the trace +continues in the next buffer. + +To disable the display of Intel PT packets, combine the -D option with +--no-itrace. + + +perf report +=========== + +By default, perf report will decode trace data found in the perf.data file. +This can be further controlled by new option --itrace exactly the same as +perf script, with the exception that the default is --itrace=igxe. + + +perf inject +=========== + +perf inject also accepts the --itrace option in which case tracing data is +removed and replaced with the synthesized events. e.g. + + perf inject --itrace -i perf.data -o perf.data.new
tools/perf/arch/x86/util/Build +2 -0
@@ -1,5 +1,6 @@ libperf-y += header.o libperf-y += tsc.o +libperf-y += pmu.o libperf-y += kvm-stat.o libperf-$(CONFIG_DWARF) += dwarf-regs.o
@@ -7,4 +8,5 @@ libperf-$(CONFIG_DWARF) += dwarf-regs.o
 libperf-$(CONFIG_LIBUNWIND)          += unwind-libunwind.o
 libperf-$(CONFIG_LIBDW_DWARF_UNWIND) += unwind-libdw.o

+libperf-$(CONFIG_AUXTRACE) += auxtrace.o
 libperf-$(CONFIG_AUXTRACE) += intel-pt.o
tools/perf/arch/x86/util/auxtrace.c new file +38 -0
@@ -0,0 +1,38 @@ +/* +* auxtrace.c: AUX area tracing support +* Copyright (c) 2013-2014, Intel Corporation. +* +* This program is free software; you can redistribute it and/or modify it +* under the terms and conditions of the GNU General Public License, +* version 2, as published by the Free Software Foundation. +* +* This program is distributed in the hope it will be useful, but WITHOUT +* ANY WARRANTY; without even the implied warranty of MERCHANTABILITY or +* FITNESS FOR A PARTICULAR PURPOSE. See the GNU General Public License for +* more details. +* +*/ + +#include "../../util/header.h" +#include "../../util/auxtrace.h" +#include "../../util/intel-pt.h" + +struct auxtrace_record *auxtrace_record__init (struct perf_evlist *evlist__maybe_unused , +int *err) +{ +char buffer[64 ]; +int ret; + + *err =0 ; + + ret =get_cpuid (buffer,sizeof (buffer)); +if (ret) { + *err = ret; +return NULL ; + } + +if (!strncmp (buffer,"GenuineIntel," ,13 )) +return intel_pt_recording_init (err); + +return NULL ; +}
tools/perf/arch/x86/util/pmu.c new file +15 -0
@@ -0,0 +1,15 @@ +#include <string.h> + +#include <linux/perf_event.h> + +#include "../../util/intel-pt.h" +#include "../../util/pmu.h" + +struct perf_event_attr *perf_pmu__get_default_config (struct perf_pmu *pmu__maybe_unused ) +{ +#ifdef HAVE_AUXTRACE_SUPPORT +if (!strcmp (pmu->name,INTEL_PT_PMU_NAME )) +return intel_pt_pmu_default_config (pmu); +#endif +return NULL ; +}
tools/perf/util/auxtrace.c +4 -1
@@ -47,6 +47,8 @@#include "debug.h" #include "parse-options.h" +#include "intel-pt.h" +int auxtrace_mmap__mmap (struct auxtrace_mmap *mm,struct auxtrace_mmap_params *mp,void *userpg,int fd)
@@ -876,7 +878,7 @@ static bool auxtrace__dont_decode(struct perf_session *session)int perf_event__process_auxtrace_info (struct perf_tool *tool__maybe_unused ,union perf_event *event, -struct perf_session *session__maybe_unused ) +struct perf_session *session) {enum auxtrace_type type = event->auxtrace_info.type;
@@ -885,6 +887,7 @@ int perf_event__process_auxtrace_info(struct perf_tool *tool __maybe_unused,switch (type) {case PERF_AUXTRACE_INTEL_PT : +return intel_pt_process_auxtrace_info (event, session);case PERF_AUXTRACE_UNKNOWN :default :return -EINVAL ;
tools/perf/util/pmu.c +2 -2
@@ -462,8 +462,8 @@ static struct perf_pmu *pmu_lookup(const char *name)LIST_HEAD (aliases);__u32 type; -/* No support for intel_bts or intel_pt so disallow them */ -if (!strcmp (name,"intel_bts" ) || !strcmp (name,"intel_pt" )) +/* No support for intel_bts so disallow it */ +if (!strcmp (name,"intel_bts" ))return NULL ;/*
Signature · 1 line
1.9.1
tip-bot for Adrian Hunter
merge bot[tip:perf/core] perf tools: Take Intel PT into use
perf tools: Take Intel PT into use
Commit-ID:  5efb1d5489520ce72232bbc28e9156f0ebddc44e
Gitweb:     http://git.kernel.org/tip/5efb1d5489520ce72232bbc28e9156f0ebddc44e
Author:     Adrian Hunter <[email protected]>
AuthorDate: Fri, 17 Jul 2015 19:33:42 +0300
Committer:  Arnaldo Carvalho de Melo <[email protected]>
CommitDate: Mon, 17 Aug 2015 11:11:37 -0300
perf tools: Take Intel PT into use
To record an AUX area, the weak function auxtrace_record__init() must be implemented.
Equally to decode an AUX area, the AUX area tracing type must be added to the perf_event__process_auxtrace_info() function.
This patch makes those two changes plus hooks up default config for the intel_pt PMU. Also some brief documentation is provided for using the tools with intel_pt.
Commiter note:
E.g:
[root@perf4 ~]# dmesg
451 [0.405807] Performance Events: PEBS fmt2+, 16-deep LBR, Broadwell events, full-width counters, Intel PMU driver. [root@perf4 ~]# perf --version
perf version 4.1.g53874a
[root@perf4 ~]# perf record -e intel_pt//u -a sleep 10
[ perf record: Woken up 1 times to write data ]
[ perf record: Captured and wrote 0.383 MB perf.data ]
[root@perf4 ~]# perf evlist
intel_pt//u
sched:sched_switch
dummy:u
[root@perf4 ~]# perf report --stdio
# To display the perf.data header info, please use --header/--header-only options.
#
#
# Total Lost Samples: 0
#
# Samples: 0 of event 'intel_pt//u'
# Event count (approx.): 0
#
  # Overhead  Command  Shared Object  Symbol
  # ........  .......  .............  ......
#
# Samples: 393 of event 'sched:sched_switch'
# Event count (approx.): 393
#
  # Overhead  Command         Shared Object     Symbol
  # ........  ..............  ................  ..............
    49.62%  swapper         [kernel.vmlinux]  [k] __schedule
    10.69%  rcu_sched       [kernel.vmlinux]  [k] __schedule
     6.62%  rcuos/0         [kernel.vmlinux]  [k] __schedule
     5.60%  kworker/0:1     [kernel.vmlinux]  [k] __schedule
     3.56%  rcuos/3         [kernel.vmlinux]  [k] __schedule
     3.05%  kworker/u384:2  [kernel.vmlinux]  [k] __schedule
     2.54%  kworker/2:0     [kernel.vmlinux]  [k] __schedule
     2.54%  tuned           [kernel.vmlinux]  [k] __schedule
  <SNIP>
  # Samples: 0  of event 'dummy:u'
  # Event count (approx.): 0
  #
  # Overhead  Command  Shared Object  Symbol
  # ........  .......  .............  ......
# Samples: 28 of event 'instructions:u'
# Event count (approx.): 5030172
#
  # Overhead  Command     Shared Object        Symbol
  # ........  ..........  ...................  ................................
  #
    21.43%  tuned       libpython2.7.so.1.0  [.] PyEval_EvalFrameEx
                 |
                 ---PyEval_EvalFrameEx
                    |
                    |--83.33%-- PyEval_EvalCodeEx
                    |          PyEval_EvalFrameEx
                    |          |
                    |          |--60.00%-- PyEval_EvalCodeEx
                    |          |          PyEval_EvalFrameEx
                    |          |          PyEval_EvalFrameEx
                    |          |
                    |           --40.00%-- PyEval_EvalFrameEx
                    |
                     --16.67%-- PyEval_EvalFrameEx
                               PyEval_EvalCodeEx
                               PyEval_EvalFrameEx
                               PyEval_EvalCodeEx
                               PyEval_EvalFrameEx
                               PyEval_EvalFrameEx

    14.29%  tuned       libpython2.7.so.1.0  [.] _PyType_Lookup
                 |
                 ---_PyType_Lookup
                    _PyObject_GenericGetAttrWithDict
                    PyEval_EvalFrameEx
                    PyEval_EvalCodeEx
                    PyEval_EvalFrameEx
                    PyEval_EvalCodeEx
                    PyEval_EvalFrameEx
                    |
                    |--75.00%-- PyEval_EvalFrameEx
                    |
                     --25.00%-- PyEval_EvalCodeEx
                               PyEval_EvalFrameEx
                               PyEval_EvalFrameEx

     3.57%  irqbalance  irqbalance           [.] 0x0000000000004038
            |
            ---0x4038
               0x4761
               0x4761
               0x4761
               0x49f1
               0x2295

     3.57%  irqbalance  libc-2.17.so         [.] __GI_____strtoull_l_internal
            |
            ---__GI_____strtoull_l_internal
               0x6f49
               0x229a

     3.57%  irqbalance  libc-2.17.so         [.] __strchrnul
            |
            ---__strchrnul
               vfprintf
               __vsprintf_chk
               __sprintf_chk
               0x2724
               0x4038
               0x2331

     3.57%  irqbalance  libc-2.17.so         [.] __strstr_sse42
            |
            ---__strstr_sse42
               0x71e0
               0x229f
# And now to some userspace ftrace on uninstrumented binaries 8-) :
# Hand edited to make it a bit more compact, replacing /home/acme/bin/perf
# with /bin/perf:
[root@perf4 ~]# perf script
     perf 8921 [3] 7.310889: 1 branches:u:            0 [unknown] ([unknown]) => 7fcecadbf257 __GI___ioctl (/usr/lib64/libc-2.17.so)
     perf 8921 [3] 7.310889: 1 branches:u: 7fcecadbf25f __GI___ioctl (/usr/lib64/libc-2.17.so) => 481689 perf_evlist__enable (/bin/perf)
     perf 8921 [3] 7.310889: 1 branches:u:       481694 perf_evlist__enable (/bin/perf) => 481614 perf_evlist__enable (/bin/perf)
     perf 8921 [3] 7.310889: 1 branches:u:       481630 perf_evlist__enable (/bin/perf) => 4816d8 perf_evlist__enable (/bin/perf)
     perf 8921 [3] 7.310889: 1 branches:u:       4816de perf_evlist__enable (/bin/perf) => 48164f perf_evlist__enable (/bin/perf)
     perf 8921 [3] 7.310889: 1 branches:u:       481652 perf_evlist__enable (/bin/perf) => 48165f perf_evlist__enable (/bin/perf)
     perf 8921 [3] 7.310889: 1 branches:u:       481684 perf_evlist__enable (/bin/perf) => 41d250 ioctl@plt (/bin/perf)
     perf 8921 [3] 7.310889: 1 branches:u:       41d250 ioctl@plt (/bin/perf) => 7fcecadbf250 __GI___ioctl (/usr/lib64/libc-2.17.so)
     perf 8921 [3] 7.310889: 1 branches:u: 7fcecadbf255 __GI___ioctl (/usr/lib64/libc-2.17.so) => 0 [unknown] ([unknown])
     perf 8921 [3] 7.310890: 1 branches:u:            0 [unknown] ([unknown]) => 7fcecadbf257 __GI___ioctl (/usr/lib64/libc-2.17.so)
     perf 8921 [3] 7.310890: 1 branches:u: 7fcecadbf25f __GI___ioctl (/usr/lib64/libc-2.17.so) => 481689 perf_evlist__enable (/bin/perf)
     perf 8921 [3] 7.310890: 1 branches:u:       481694 perf_evlist__enable (/bin/perf) => 481614 perf_evlist__enable (/bin/perf)
     perf 8921 [3] 7.310890: 1 branches:u:       481652 perf_evlist__enable (/bin/perf) => 48165f perf_evlist__enable (/bin/perf)
     perf 8921 [3] 7.310890: 1 branches:u:       481684 perf_evlist__enable (/bin/perf) => 41d250 ioctl@plt (/bin/perf)
     perf 8921 [3] 7.310890: 1 branches:u:       41d250 ioctl@plt (/bin/perf) => 7fcecadbf250 __GI___ioctl (/usr/lib64/libc-2.17.so)
     perf 8921 [3] 7.310890: 1 branches:u: 7fcecadbf255 __GI___ioctl (/usr/lib64/libc-2.17.so) => 0 [unknown] ([unknown])
     perf 8921 [3] 7.310893: 1 branches:u:            0 [unknown] ([unknown]) => 7fcecadbf257 __GI___ioctl (/usr/lib64/libc-2.17.so)
     perf 8921 [3] 7.310893: 1 branches:u: 7fcecadbf25f __GI___ioctl (/usr/lib64/libc-2.17.so) => 481689 perf_evlist__enable (/bin/perf)
     perf 8921 [3] 7.310893: 1 branches:u:       4816a8 perf_evlist__enable (/bin/perf) => 4815f8 perf_evlist__enable (/bin/perf)
     perf 8921 [3] 7.310893: 1 branches:u:       4815fe perf_evlist__enable (/bin/perf) => 481614 perf_evlist__enable (/bin/perf)
     perf 8921 [3] 7.310893: 1 branches:u:       481652 perf_evlist__enable (/bin/perf) => 48165f perf_evlist__enable (/bin/perf)
     perf 8921 [3] 7.310893: 1 branches:u:       481684 perf_evlist__enable (/bin/perf) => 41d250 ioctl@plt (/bin/perf)
     perf 8921 [3] 7.310893: 1 branches:u:       41d250 ioctl@plt (/bin/perf) => 7fcecadbf250 __GI___ioctl (/usr/lib64/libc-2.17.so)
     perf 8921 [3] 7.310893: 1 branches:u: 7fcecadbf255 __GI___ioctl (/usr/lib64/libc-2.17.so) => 0 [unknown] ([unknown])
     perf 8921 [3] 7.310956: 1 branches:u:            0 [unknown] ([unknown]) => 7fcecadbf257 __GI___ioctl (/usr/lib64/libc-2.17.so)
     perf 8921 [3] 7.310956: 1 branches:u: 7fcecadbf25f __GI___ioctl (/usr/lib64/libc-2.17.so) => 481689 perf_evlist__enable (/bin/perf)
     perf 8921 [3] 7.310956: 1 branches:u:       481694 perf_evlist__enable (/bin/perf) => 481614 perf_evlist__enable (/bin/perf)
     perf 8921 [3] 7.310956: 1 branches:u:       481630 perf_evlist__enable (/bin/perf) => 4816d8 perf_evlist__enable (/bin/perf)
     perf 8921 [3] 7.310956: 1 branches:u:       4816de perf_evlist__enable (/bin/perf) => 48164f perf_evlist__enable (/bin/perf)
     perf 8921 [3] 7.310956: 1 branches:u:       481652 perf_evlist__enable (/bin/perf) => 48165f perf_evlist__enable (/bin/perf)
     perf 8921 [3] 7.310956: 1 branches:u:       481684 perf_evlist__enable (/bin/perf) => 41d250 ioctl@plt (/bin/perf)
     perf 8921 [3] 7.310956: 1 branches:u:       41d250 ioctl@plt (/bin/perf) => 7fcecadbf250 __GI___ioctl (/usr/lib64/libc-2.17.so)
     perf 8921 [3] 7.310956: 1 branches:u: 7fcecadbf255 __GI___ioctl (/usr/lib64/libc-2.17.so) => 0 [unknown] ([unknown])
     perf 8921 [3] 7.310961: 1 branches:u:            0 [unknown] ([unknown]) => 7fcecadbf257 __GI___ioctl (/usr/lib64/libc-2.17.so)
     perf 8921 [3] 7.310961: 1 branches:u: 7fcecadbf25f __GI___ioctl (/usr/lib64/libc-2.17.so) => 481689 perf_evlist__enable (/bin/perf)
     perf 8921 [3] 7.310961: 1 branches:u:       481694 perf_evlist__enable (/bin/perf) => 481614 perf_evlist__enable (/bin/perf)
     perf 8921 [3] 7.310961: 1 branches:u:       481652 perf_evlist__enable (/bin/perf) => 48165f perf_evlist__enable (/bin/perf)
     perf 8921 [3] 7.310961: 1 branches:u:       481684 perf_evlist__enable (/bin/perf) => 41d250 ioctl@plt (/bin/perf)
     perf 8921 [3] 7.310961: 1 branches:u:       41d250 ioctl@plt (/bin/perf) => 7fcecadbf250 __GI___ioctl (/usr/lib64/libc-2.17.so)
     perf 8921 [3] 7.310961: 1 branches:u: 7fcecadbf255 __GI___ioctl (/usr/lib64/libc-2.17.so) => 0 [unknown] ([unknown])
     perf 8921 [3] 7.310968: 1 branches:u:            0 [unknown] ([unknown]) => 7fcecadbf257 __GI___ioctl (/usr/lib64/libc-2.17.so)
     perf 8921 [3] 7.310968: 1 branches:u: 7fcecadbf25f __GI___ioctl (/usr/lib64/libc-2.17.so) => 481689 perf_evlist__enable (/bin/perf)
     perf 8921 [3] 7.310968: 1 branches:u:       4816a8 perf_evlist__enable (/bin/perf) => 4815f8 perf_evlist__enable (/bin/perf)
     perf 8921 [3] 7.310968: 1 branches:u:       4815fe perf_evlist__enable (/bin/perf) => 481614 perf_evlist__enable (/bin/perf)
     perf 8921 [3] 7.310968: 1 branches:u:       481652 perf_evlist__enable (/bin/perf) => 48165f perf_evlist__enable (/bin/perf)
     perf 8921 [3] 7.310968: 1 branches:u:       481684 perf_evlist__enable (/bin/perf) => 41d250 ioctl@plt (/bin/perf)
     perf 8921 [3] 7.310968: 1 branches:u:       41d250 ioctl@plt (/bin/perf) => 7fcecadbf250 __GI___ioctl (/usr/lib64/libc-2.17.so)
     perf 8921 [3] 7.310968: 1 branches:u: 7fcecadbf255 __GI___ioctl (/usr/lib64/libc-2.17.so) => 0 [unknown] ([unknown])
     perf 8921 [3] 7.311040: 1 branches:u:            0 [unknown] ([unknown]) => 7fcecadbf257 __GI___ioctl (/usr/lib64/libc-2.17.so)
     perf 8921 [3] 7.311040: 1 branches:u: 7fcecadbf25f __GI___ioctl (/usr/lib64/libc-2.17.so) => 481689 perf_evlist__enable (/bin/perf)
     perf 8921 [3] 7.311040: 1 branches:u:       481694 perf_evlist__enable (/bin/perf) => 481614 perf_evlist__enable (/bin/perf)
     perf 8921 [3] 7.311040: 1 branches:u:       481630 perf_evlist__enable (/bin/perf) => 4816d8 perf_evlist__enable (/bin/perf)
     perf 8921 [3] 7.311040: 1 branches:u:       4816de perf_evlist__enable (/bin/perf) => 48164f perf_evlist__enable (/bin/perf)
     perf 8921 [3] 7.311040: 1 branches:u:       481652 perf_evlist__enable (/bin/perf) => 48165f perf_evlist__enable (/bin/perf)
     perf 8921 [3] 7.311040: 1 branches:u:       481684 perf_evlist__enable (/bin/perf) => 41d250 ioctl@plt (/bin/perf)
     perf 8921 [3] 7.311040: 1 branches:u:       41d250 ioctl@plt (/bin/perf) => 7fcecadbf250 __GI___ioctl (/usr/lib64/libc-2.17.so)
     perf 8921 [3] 7.311040: 1 branches:u: 7fcecadbf255 __GI___ioctl (/usr/lib64/libc-2.17.so) => 0 [unknown] ([unknown])
     perf 8921 [3] 7.311046: 1 branches:u:            0 [unknown] ([unknown]) => 7fcecadbf257 __GI___ioctl (/usr/lib64/libc-2.17.so)
     perf 8921 [3] 7.311046: 1 branches:u: 7fcecadbf25f __GI___ioctl (/usr/lib64/libc-2.17.so) => 481689 perf_evlist__enable (/bin/perf)
     perf 8921 [3] 7.311046: 1 branches:u:       481694 perf_evlist__enable (/bin/perf) => 481614 perf_evlist__enable (/bin/perf)
     perf 8921 [3] 7.311046: 1 branches:u:       481652 perf_evlist__enable (/bin/perf) => 48165f perf_evlist__enable (/bin/perf)
     perf 8921 [3] 7.311046: 1 branches:u:       481684 perf_evlist__enable (/bin/perf) => 41d250 ioctl@plt (/bin/perf)
     perf 8921 [3] 7.311046: 1 branches:u:       41d250 ioctl@plt (/bin/perf) => 7fcecadbf250 __GI___ioctl (/usr/lib64/libc-2.17.so)
     perf 8921 [3] 7.311046: 1 branches:u: 7fcecadbf255 __GI___ioctl (/usr/lib64/libc-2.17.so) => 0 [unknown] ([unknown])
     perf 8921 [3] 7.311050: 1 branches:u:            0 [unknown] ([unknown]) => 7fcecadbf257 __GI___ioctl (/usr/lib64/libc-2.17.so)
     perf 8921 [3] 7.311050: 1 branches:u: 7fcecadbf25f __GI___ioctl (/usr/lib64/libc-2.17.so) => 481689 perf_evlist__enable (/bin/perf)
:
---
 tools/perf/Documentation/intel-pt.txt | 588 ++++++++++++++++++++++++++++++++++
 tools/perf/arch/x86/util/Build        |   2 +
 tools/perf/arch/x86/util/auxtrace.c   |  38 +++
 tools/perf/arch/x86/util/pmu.c        |  15 +
 tools/perf/util/auxtrace.c            |   5 +-
 tools/perf/util/pmu.c                 |   4 +-
 6 files changed, 649 insertions(+), 3 deletions(-)
tools/perf/Documentation/intel-pt.txt new file +588 -0
@@ -0,0 +1,588 @@ +Intel Processor Trace +===================== + +Overview +======== + +Intel Processor Trace (Intel PT) is an extension of Intel Architecture that +collects information about software execution such as control flow, execution +modes and timings and formats it into highly compressed binary packets. +Technical details are documented in the Intel 64 and IA-32 Architectures +Software Developer Manuals, Chapter 36 Intel Processor Trace. + +Intel PT is first supported in Intel Core M and 5th generation Intel Core +processors that are based on the Intel micro-architecture code name Broadwell. + +Trace data is collected by 'perf record' and stored within the perf.data file. +See below for options to 'perf record'. + +Trace data must be 'decoded' which involves walking the object code and matching +the trace data packets. For example a TNT packet only tells whether a +conditional branch was taken or not taken, so to make use of that packet the +decoder must know precisely which instruction was being executed. + +Decoding is done on-the-fly. The decoder outputs samples in the same format as +samples output by perf hardware events, for example as though the "instructions" +or "branches" events had been recorded. Presently 3 tools support this: +'perf script', 'perf report' and 'perf inject'. See below for more information +on using those tools. + +The main distinguishing feature of Intel PT is that the decoder can determine +the exact flow of software execution. Intel PT can be used to understand why +and how did software get to a certain point, or behave a certain way. The +software does not have to be recompiled, so Intel PT works with debug or release +builds, however the executed images are needed - which makes use in JIT-compiled +environments, or with self-modified code, a challenge. Also symbols need to be +provided to make sense of addresses. + +A limitation of Intel PT is that it produces huge amounts of trace data +(hundreds of megabytes per second per core) which takes a long time to decode, +for example two or three orders of magnitude longer than it took to collect. +Another limitation is the performance impact of tracing, something that will +vary depending on the use-case and architecture. + + +Quickstart +========== + +It is important to start small. That is because it is easy to capture vastly +more data than can possibly be processed. + +The simplest thing to do with Intel PT is userspace profiling of small programs. +Data is captured with 'perf record' e.g. to trace 'ls' userspace-only: + + perf record -e intel_pt//u ls + +And profiled with 'perf report' e.g. + + perf report + +To also trace kernel space presents a problem, namely kernel self-modifying +code. A fairly good kernel image is available in /proc/kcore but to get an +accurate image a copy of /proc/kcore needs to be made under the same conditions +as the data capture. A script perf-with-kcore can do that, but beware that the +script makes use of 'sudo' to copy /proc/kcore. If you have perf installed +locally from the source tree you can do: + + ~/libexec/perf-core/perf-with-kcore record pt_ls -e intel_pt// -- ls + +which will create a directory named 'pt_ls' and put the perf.data file and +copies of /proc/kcore, /proc/kallsyms and /proc/modules into it. Then to use +'perf report' becomes: + + ~/libexec/perf-core/perf-with-kcore report pt_ls + +Because samples are synthesized after-the-fact, the sampling period can be +selected for reporting. e.g. sample every microsecond + + ~/libexec/perf-core/perf-with-kcore report pt_ls --itrace=i1usge + +See the sections below for more information about the --itrace option. + +Beware the smaller the period, the more samples that are produced, and the +longer it takes to process them. + +Also note that the coarseness of Intel PT timing information will start to +distort the statistical value of the sampling as the sampling period becomes +smaller. + +To represent software control flow, "branches" samples are produced. By default +a branch sample is synthesized for every single branch. To get an idea what +data is available you can use the 'perf script' tool with no parameters, which +will list all the samples. + + perf record -e intel_pt//u ls + perf script + +An interesting field that is not printed by default is 'flags' which can be +displayed as follows: + + perf script -Fcomm,tid,pid,time,cpu,event,trace,ip,sym,dso,addr,symoff,flags + +The flags are "bcrosyiABEx" which stand for branch, call, return, conditional, +system, asynchronous, interrupt, transaction abort, trace begin, trace end, and +in transaction, respectively. + +While it is possible to create scripts to analyze the data, an alternative +approach is available to export the data to a postgresql database. Refer to +script export-to-postgresql.py for more details, and to script +call-graph-from-postgresql.py for an example of using the database. + +As mentioned above, it is easy to capture too much data. One way to limit the +data captured is to use 'snapshot' mode which is explained further below. +Refer to 'new snapshot option' and 'Intel PT modes of operation' further below. + +Another problem that will be experienced is decoder errors. They can be caused +by inability to access the executed image, self-modified or JIT-ed code, or the +inability to match side-band information (such as context switches and mmaps) +which results in the decoder not knowing what code was executed. + +There is also the problem of perf not being able to copy the data fast enough, +resulting in data lost because the buffer was full. See 'Buffer handling' below +for more details. + + +perf record +=========== + +new event +--------- + +The Intel PT kernel driver creates a new PMU for Intel PT. PMU events are +selected by providing the PMU name followed by the "config" separated by slashes. +An enhancement has been made to allow default "config" e.g. the option + + -e intel_pt// + +will use a default config value. Currently that is the same as + + -e intel_pt/tsc,noretcomp=0/ + +which is the same as + + -e intel_pt/tsc=1,noretcomp=0/ + +The config terms are listed in /sys/devices/intel_pt/format. They are bit +fields within the config member of the struct perf_event_attr which is +passed to the kernel by the perf_event_open system call. They correspond to bit +fields in the IA32_RTIT_CTL MSR. Here is a list of them and their definitions: + + $ for f in `ls /sys/devices/intel_pt/format`;do + > echo $f + > cat /sys/devices/intel_pt/format/$f + > done + noretcomp + config:11 + tsc + config:10 + +Note that the default config must be overridden for each term i.e. + + -e intel_pt/noretcomp=0/ + +is the same as: + + -e intel_pt/tsc=1,noretcomp=0/ + +So, to disable TSC packets use: + + -e intel_pt/tsc=0/ + +It is also possible to specify the config value explicitly: + + -e intel_pt/config=0x400/ + +Note that, as with all events, the event is suffixed with event modifiers: + + u userspace + k kernel + h hypervisor + G guest + H host + p precise ip + +'h', 'G' and 'H' are for virtualization which is not supported by Intel PT. +'p' is also not relevant to Intel PT. So only options 'u' and 'k' are +meaningful for Intel PT. + +perf_event_attr is displayed if the -vv option is used e.g. + + ------------------------------------------------------------ + perf_event_attr: + type 6 + size 112 + config 0x400 + { sample_period, sample_freq } 1 + sample_type IP|TID|TIME|CPU|IDENTIFIER + read_format ID + disabled 1 + inherit 1 + exclude_kernel 1 + exclude_hv 1 + enable_on_exec 1 + sample_id_all 1 + ------------------------------------------------------------ + sys_perf_event_open: pid 31104 cpu 0 group_fd -1 flags 0x8 + sys_perf_event_open: pid 31104 cpu 1 group_fd -1 flags 0x8 + sys_perf_event_open: pid 31104 cpu 2 group_fd -1 flags 0x8 + sys_perf_event_open: pid 31104 cpu 3 group_fd -1 flags 0x8 + ------------------------------------------------------------ + + +new snapshot option +------------------- + +To select snapshot mode a new option has been added: + + -S + +Optionally it can be followed by the snapshot size e.g. + + -S0x100000 + +The default snapshot size is the auxtrace mmap size. If neither auxtrace mmap size +nor snapshot size is specified, then the default is 4MiB for privileged users +(or if /proc/sys/kernel/perf_event_paranoid < 0), 128KiB for unprivileged users. +If an unprivileged user does not specify mmap pages, the mmap pages will be +reduced as described in the 'new auxtrace mmap size option' section below. + +The snapshot size is displayed if the option -vv is used e.g. + + Intel PT snapshot size: %zu + + +new auxtrace mmap size option +--------------------------- + +Intel PT buffer size is specified by an addition to the -m option e.g. + + -m,16 + +selects a buffer size of 16 pages i.e. 64KiB. + +Note that the existing functionality of -m is unchanged. The auxtrace mmap size +is specified by the optional addition of a comma and the value. + +The default auxtrace mmap size for Intel PT is 4MiB/page_size for privileged users +(or if /proc/sys/kernel/perf_event_paranoid < 0), 128KiB for unprivileged users. +If an unprivileged user does not specify mmap pages, the mmap pages will be +reduced from the default 512KiB/page_size to 256KiB/page_size, otherwise the +user is likely to get an error as they exceed their mlock limit (Max locked +memory as shown in /proc/self/limits). Note that perf does not count the first +512KiB (actually /proc/sys/kernel/perf_event_mlock_kb minus 1 page) per cpu +against the mlock limit so an unprivileged user is allowed 512KiB per cpu plus +their mlock limit (which defaults to 64KiB but is not multiplied by the number +of cpus). + +In full-trace mode, powers of two are allowed for buffer size, with a minimum +size of 2 pages. In snapshot mode, it is the same but the minimum size is +1 page. + +The mmap size and auxtrace mmap size are displayed if the -vv option is used e.g. + + mmap length 528384 + auxtrace mmap length 4198400 + + +Intel PT modes of operation +--------------------------- + +Intel PT can be used in 2 modes: + full-trace mode + snapshot mode + +Full-trace mode traces continuously e.g. + + perf record -e intel_pt//u uname + +Snapshot mode captures the available data when a signal is sent e.g. + + perf record -v -e intel_pt//u -S ./loopy 1000000000 & + [1] 11435 + kill -USR2 11435 + Recording AUX area tracing snapshot + +Note that the signal sent is SIGUSR2. +Note that "Recording AUX area tracing snapshot" is displayed because the -v +option is used. + +The 2 modes cannot be used together. + + +Buffer handling +--------------- + +There may be buffer limitations (i.e. single ToPa entry) which means that actual +buffer sizes are limited to powers of 2 up to 4MiB (MAX_ORDER). In order to +provide other sizes, and in particular an arbitrarily large size, multiple +buffers are logically concatenated. However an interrupt must be used to switch +between buffers. That has two potential problems: + a) the interrupt may not be handled in time so that the current buffer + becomes full and some trace data is lost. + b) the interrupts may slow the system and affect the performance + results. + +If trace data is lost, the driver sets 'truncated' in the PERF_RECORD_AUX event +which the tools report as an error. + +In full-trace mode, the driver waits for data to be copied out before allowing +the (logical) buffer to wrap-around. If data is not copied out quickly enough, +again 'truncated' is set in the PERF_RECORD_AUX event. If the driver has to +wait, the intel_pt event gets disabled. Because it is difficult to know when +that happens, perf tools always re-enable the intel_pt event after copying out +data. + + +Intel PT and build ids +---------------------- + +By default "perf record" post-processes the event stream to find all build ids +for executables for all addresses sampled. Deliberately, Intel PT is not +decoded for that purpose (it would take too long). Instead the build ids for +all executables encountered (due to mmap, comm or task events) are included +in the perf.data file. + +To see buildids included in the perf.data file use the command: + + perf buildid-list + +If the perf.data file contains Intel PT data, that is the same as: + + perf buildid-list --with-hits + + +Snapshot mode and event disabling +--------------------------------- + +In order to make a snapshot, the intel_pt event is disabled using an IOCTL, +namely PERF_EVENT_IOC_DISABLE. However doing that can also disable the +collection of side-band information. In order to prevent that, a dummy +software event has been introduced that permits tracking events (like mmaps) to +continue to be recorded while intel_pt is disabled. That is important to ensure +there is complete side-band information to allow the decoding of subsequent +snapshots. + +A test has been created for that. To find the test: + + perf test list + ... + 23: Test using a dummy software event to keep tracking + +To run the test: + + perf test 23 + 23: Test using a dummy software event to keep tracking : Ok + + +perf record modes (nothing new here) +------------------------------------ + +perf record essentially operates in one of three modes: + per thread + per cpu + workload only + +"per thread" mode is selected by -t or by --per-thread (with -p or -u or just a +workload). +"per cpu" is selected by -C or -a. +"workload only" mode is selected by not using the other options but providing a +command to run (i.e. the workload). + +In per-thread mode an exact list of threads is traced. There is no inheritance. +Each thread has its own event buffer. + +In per-cpu mode all processes (or processes from the selected cgroup i.e. -G +option, or processes selected with -p or -u) are traced. Each cpu has its own +buffer. Inheritance is allowed. + +In workload-only mode, the workload is traced but with per-cpu buffers. +Inheritance is allowed. Note that you can now trace a workload in per-thread +mode by using the --per-thread option. + + +Privileged vs non-privileged users +---------------------------------- + +Unless /proc/sys/kernel/perf_event_paranoid is set to -1, unprivileged users +have memory limits imposed upon them. That affects what buffer sizes they can +have as outlined above. + +Unless /proc/sys/kernel/perf_event_paranoid is set to -1, unprivileged users are +not permitted to use tracepoints which means there is insufficient side-band +information to decode Intel PT in per-cpu mode, and potentially workload-only +mode too if the workload creates new processes. + +Note also, that to use tracepoints, read-access to debugfs is required. So if +debugfs is not mounted or the user does not have read-access, it will again not +be possible to decode Intel PT in per-cpu mode. + + +sched_switch tracepoint +----------------------- + +The sched_switch tracepoint is used to provide side-band data for Intel PT +decoding. sched_switch events are automatically added. e.g. the second event +shown below + + $ perf record -vv -e intel_pt//u uname + ------------------------------------------------------------ + perf_event_attr: + type 6 + size 112 + config 0x400 + { sample_period, sample_freq } 1 + sample_type IP|TID|TIME|CPU|IDENTIFIER + read_format ID + disabled 1 + inherit 1 + exclude_kernel 1 + exclude_hv 1 + enable_on_exec 1 + sample_id_all 1 + ------------------------------------------------------------ + sys_perf_event_open: pid 31104 cpu 0 group_fd -1 flags 0x8 + sys_perf_event_open: pid 31104 cpu 1 group_fd -1 flags 0x8 + sys_perf_event_open: pid 31104 cpu 2 group_fd -1 flags 0x8 + sys_perf_event_open: pid 31104 cpu 3 group_fd -1 flags 0x8 + ------------------------------------------------------------ + perf_event_attr: + type 2 + size 112 + config 0x108 + { sample_period, sample_freq } 1 + sample_type IP|TID|TIME|CPU|PERIOD|RAW|IDENTIFIER + read_format ID + inherit 1 + sample_id_all 1 + exclude_guest 1 + ------------------------------------------------------------ + sys_perf_event_open: pid -1 cpu 0 group_fd -1 flags 0x8 + sys_perf_event_open: pid -1 cpu 1 group_fd -1 flags 0x8 + sys_perf_event_open: pid -1 cpu 2 group_fd -1 flags 0x8 + sys_perf_event_open: pid -1 cpu 3 group_fd -1 flags 0x8 + ------------------------------------------------------------ + perf_event_attr: + type 1 + size 112 + config 0x9 + { sample_period, sample_freq } 1 + sample_type IP|TID|TIME|IDENTIFIER + read_format ID + disabled 1 + inherit 1 + exclude_kernel 1 + exclude_hv 1 + mmap 1 + comm 1 + enable_on_exec 1 + task 1 + sample_id_all 1 + mmap2 1 + comm_exec 1 + ------------------------------------------------------------ + sys_perf_event_open: pid 31104 cpu 0 group_fd -1 flags 0x8 + sys_perf_event_open: pid 31104 cpu 1 group_fd -1 flags 0x8 + sys_perf_event_open: pid 31104 cpu 2 group_fd -1 flags 0x8 + sys_perf_event_open: pid 31104 cpu 3 group_fd -1 flags 0x8 + mmap size 528384B + AUX area mmap length 4194304 + perf event ring buffer mmapped per cpu + Synthesizing auxtrace information + Linux + [ perf record: Woken up 1 times to write data ] + [ perf record: Captured and wrote 0.042 MB perf.data ] + +Note, the sched_switch event is only added if the user is permitted to use it +and only in per-cpu mode. + +Note also, the sched_switch event is only added if TSC packets are requested. +That is because, in the absence of timing information, the sched_switch events +cannot be matched against the Intel PT trace. + + +perf script +=========== + +By default, perf script will decode trace data found in the perf.data file. +This can be further controlled by new option --itrace. + + +New --itrace option +------------------- + +Having no option is the same as + + --itrace + +which, in turn, is the same as + + --itrace=ibxe + +The letters are: + + i synthesize "instructions" events + b synthesize "branches" events + x synthesize "transactions" events + c synthesize branches events (calls only) + r synthesize branches events (returns only) + e synthesize tracing error events + d create a debug log + g synthesize a call chain (use with i or x) + +"Instructions" events look like they were recorded by "perf record -e +instructions". + +"Branches" events look like they were recorded by "perf record -e branches". "c" +and "r" can be combined to get calls and returns. + +"Transactions" events correspond to the start or end of transactions. The +'flags' field can be used in perf script to determine whether the event is a +tranasaction start, commit or abort. + +Error events are new. They show where the decoder lost the trace. Error events +are quite important. Users must know if what they are seeing is a complete +picture or not. + +The "d" option will cause the creation of a file "intel_pt.log" containing all +decoded packets and instructions. Note that this option slows down the decoder +and that the resulting file may be very large. + +In addition, the period of the "instructions" event can be specified. e.g. + + --itrace=i10us + +sets the period to 10us i.e. one instruction sample is synthesized for each 10 +microseconds of trace. Alternatives to "us" are "ms" (milliseconds), +"ns" (nanoseconds), "t" (TSC ticks) or "i" (instructions). + +"ms", "us" and "ns" are converted to TSC ticks. + +The timing information included with Intel PT does not give the time of every +instruction. Consequently, for the purpose of sampling, the decoder estimates +the time since the last timing packet based on 1 tick per instruction. The time +on the sample is *not* adjusted and reflects the last known value of TSC. + +For Intel PT, the default period is 100us. + +Also the call chain size (default 16, max. 1024) for instructions or +transactions events can be specified. e.g. + + --itrace=ig32 + --itrace=xg32 + +To disable trace decoding entirely, use the option --no-itrace. + + +dump option +----------- + +perf script has an option (-D) to "dump" the events i.e. display the binary +data. + +When -D is used, Intel PT packets are displayed. The packet decoder does not +pay attention to PSB packets, but just decodes the bytes - so the packets seen +by the actual decoder may not be identical in places where the data is corrupt. +One example of that would be when the buffer-switching interrupt has been too +slow, and the buffer has been filled completely. In that case, the last packet +in the buffer might be truncated and immediately followed by a PSB as the trace +continues in the next buffer. + +To disable the display of Intel PT packets, combine the -D option with +--no-itrace. + + +perf report +=========== + +By default, perf report will decode trace data found in the perf.data file. +This can be further controlled by new option --itrace exactly the same as +perf script, with the exception that the default is --itrace=igxe. + + +perf inject +=========== + +perf inject also accepts the --itrace option in which case tracing data is +removed and replaced with the synthesized events. e.g. + + perf inject --itrace -i perf.data -o perf.data.new
tools/perf/arch/x86/util/Build +2 -0
@@ -1,5 +1,6 @@ libperf-y += header.o libperf-y += tsc.o +libperf-y += pmu.o libperf-y += kvm-stat.o libperf-$(CONFIG_DWARF) += dwarf-regs.o
@@ -7,4 +8,5 @@ libperf-$(CONFIG_DWARF) += dwarf-regs.o
 libperf-$(CONFIG_LIBUNWIND)          += unwind-libunwind.o
 libperf-$(CONFIG_LIBDW_DWARF_UNWIND) += unwind-libdw.o

+libperf-$(CONFIG_AUXTRACE) += auxtrace.o
 libperf-$(CONFIG_AUXTRACE) += intel-pt.o
tools/perf/arch/x86/util/auxtrace.c new file +38 -0
@@ -0,0 +1,38 @@ +/* +* auxtrace.c: AUX area tracing support +* Copyright (c) 2013-2014, Intel Corporation. +* +* This program is free software; you can redistribute it and/or modify it +* under the terms and conditions of the GNU General Public License, +* version 2, as published by the Free Software Foundation. +* +* This program is distributed in the hope it will be useful, but WITHOUT +* ANY WARRANTY; without even the implied warranty of MERCHANTABILITY or +* FITNESS FOR A PARTICULAR PURPOSE. See the GNU General Public License for +* more details. +* +*/ + +#include "../../util/header.h" +#include "../../util/auxtrace.h" +#include "../../util/intel-pt.h" + +struct auxtrace_record *auxtrace_record__init (struct perf_evlist *evlist__maybe_unused , +int *err) +{ +char buffer[64 ]; +int ret; + + *err =0 ; + + ret =get_cpuid (buffer,sizeof (buffer)); +if (ret) { + *err = ret; +return NULL ; + } + +if (!strncmp (buffer,"GenuineIntel," ,13 )) +return intel_pt_recording_init (err); + +return NULL ; +}
tools/perf/arch/x86/util/pmu.c new file +15 -0
@@ -0,0 +1,15 @@ +#include <string.h> + +#include <linux/perf_event.h> + +#include "../../util/intel-pt.h" +#include "../../util/pmu.h" + +struct perf_event_attr *perf_pmu__get_default_config (struct perf_pmu *pmu__maybe_unused ) +{ +#ifdef HAVE_AUXTRACE_SUPPORT +if (!strcmp (pmu->name,INTEL_PT_PMU_NAME )) +return intel_pt_pmu_default_config (pmu); +#endif +return NULL ; +}
tools/perf/util/auxtrace.c +4 -1
@@ -47,6 +47,8 @@#include "debug.h" #include "parse-options.h" +#include "intel-pt.h" +int auxtrace_mmap__mmap (struct auxtrace_mmap *mm,struct auxtrace_mmap_params *mp,void *userpg,int fd)
@@ -876,7 +878,7 @@ static bool auxtrace__dont_decode(struct perf_session *session)int perf_event__process_auxtrace_info (struct perf_tool *tool__maybe_unused ,union perf_event *event, -struct perf_session *session__maybe_unused ) +struct perf_session *session) {enum auxtrace_type type = event->auxtrace_info.type;
@@ -885,6 +887,7 @@ int perf_event__process_auxtrace_info(struct perf_tool *tool __maybe_unused,switch (type) {case PERF_AUXTRACE_INTEL_PT : +return intel_pt_process_auxtrace_info (event, session);case PERF_AUXTRACE_UNKNOWN :default :return -EINVAL ;
tools/perf/util/pmu.c +2 -2
@@ -462,8 +462,8 @@ static struct perf_pmu *pmu_lookup(const char *name)LIST_HEAD (aliases);__u32 type; -/* No support for intel_bts or intel_pt so disallow them */ -if (!strcmp (name,"intel_bts" ) || !strcmp (name,"intel_pt" )) +/* No support for intel_bts so disallow it */ +if (!strcmp (name,"intel_bts" ))return NULL ;/*
Adrian Hunter
reviewerPATCH v8 8/25 perf tools: Add Intel BTS support
In reply to Adrian HunterIntel BTS support fits within the new auxtrace infrastructure. Recording is supporting by identifying the Intel BTS PMU, parsing options and setting up events.
Decoding is supported by queuing up trace data by thread and then decoding synchronously delivering synthesized event samples into the session processing for tools to consume.
E.g:
[root@zoo ~]# perf record --per-thread -e intel_bts// ls
anaconda-ks.cfg b bin lib64 libexec new old perf.data
perf.data.old stream_test tg.run
[ perf record: Woken up 2 times to write data ]
[ perf record: Captured and wrote 4.242 MB perf.data ]
[root@zoo ~]# perf evlist
intel_bts//
dummy:u
[root@zoo ~]# perf evlist -v
intel_bts//: type: 7, size: 112, { sample_period, sample_freq }: 1,
sample_type: IP|TID|IDENTIFIER, read_format: ID, disabled: 1,
enable_on_exec: 1, sample_id_all: 1, exclude_guest: 1 dummy:u:
type: 1, size: 112, config: 0x9, { sample_period, sample_freq }: 1,
sample_type: IP|TID|IDENTIFIER, read_format: ID, disabled: 1,
exclude_kernel: 1, exclude_hv: 1, mmap: 1, comm: 1, enable_on_exec: 1,
task: 1, sample_id_all: 1, mmap2: 1, comm_exec: 1
[root@zoo ~]# perf report --stdio
# To display the perf.data header info, please use --header/--header-only options. #
#
# Total Lost Samples: 0
#
# Samples: 0 of event 'intel_bts//'
# Event count (approx.): 0
#
  # Overhead  Command  Shared Object  Symbol
  # ........  .......  .............  ......
#
# Samples: 0 of event 'dummy:u'
# Event count (approx.): 0
#
  # Overhead  Command  Shared Object  Symbol
  # ........  .......  .............  ......
#
# Samples: 184K of event 'branches'
# Event count (approx.): 184522
#
  # Overhead  Command  Shared Object       Symbol
  # ........  .......  ..................  ..............................................
  #
     7.36%  ls       [kernel.kallsyms]   [.] unmap_single_vma
     4.69%  ls       ld-2.20.so          [.] strcmp
     4.66%  ls       libc-2.20.so        [.] _dl_addr
     3.43%  ls       [kernel.kallsyms]   [.] change_protection
     3.01%  ls       ld-2.20.so          [.] do_lookup_x
     2.18%  ls       [kernel.kallsyms]   [.] filemap_map_pages
     2.09%  ls       ld-2.20.so          [.] _dl_name_match_p
     1.93%  ls       ld-2.20.so          [.] _dl_lookup_symbol_x
     1.91%  ls       [kernel.kallsyms]   [.] page_remove_rmap
     1.72%  ls       [kernel.kallsyms]   [.] do_set_pte
     1.48%  ls       ld-2.20.so          [.] _dl_relocate_object
     1.34%  ls       [kernel.kallsyms]   [.] mem_cgroup_begin_page_stat
     1.11%  ls       [kernel.kallsyms]   [.] page_add_file_rmap
     1.00%  ls       [kernel.kallsyms]   [.] mark_page_accessed
     0.97%  ls       [kernel.kallsyms]   [.] perf_event_aux
     0.95%  ls       [kernel.kallsyms]   [.] handle_mm_fault
     0.94%  ls       [kernel.kallsyms]   [.] get_page_from_freelist
  <SNIP>
  [root@zoo ~]# perf record --per-thread -e intel_bts//u ls
  <SNIP>
  [ perf record: Woken up 1 times to write data ]
  [ perf record: Captured and wrote 1.278 MB perf.data ]
  [root@zoo ~]# perf report --stdio
  <SNIP>
  # Samples: 55K of event 'branches:u'
  # Event count (approx.): 55165
  #
  # Overhead  Command  Shared Object       Symbol
  # ........  .......  ..................  ......................................
  #
    15.69%  ls       ld-2.20.so          [.] strcmp
    15.58%  ls       libc-2.20.so        [.] _dl_addr
    10.05%  ls       ld-2.20.so          [.] do_lookup_x
     6.98%  ls       ld-2.20.so          [.] _dl_name_match_p
     6.46%  ls       ld-2.20.so          [.] _dl_lookup_symbol_x
     4.95%  ls       ld-2.20.so          [.] _dl_relocate_object
     2.96%  ls       ls                  [.] quotearg_buffer_restyled
     2.78%  ls       libc-2.20.so        [.] getenv
     1.91%  ls       ld-2.20.so          [.] _dl_cache_libcmp
     1.76%  ls       libc-2.20.so        [.] __memmove_sse2
     1.75%  ls       ld-2.20.so          [.] check_match.isra.0
     1.47%  ls       ld-2.20.so          [.] _dl_map_object_deps
     1.27%  ls       ld-2.20.so          [.] _dl_map_object_from_fd
     1.17%  ls       ls                  [.] quote_name
     1.16%  ls       ld-2.20.so          [.] _dl_check_map_versions
   <SNIP>
     0.19%  ls       [kernel.kallsyms]   [.] entry_SYSCALL_64_fastpath
     0.19%  ls       [kernel.kallsyms]   [.] native_irq_return_iret
     0.19%  ls       libc-2.20.so        [.] _IO_file_xsputn@@GLIBC_2.2.5
<SNIP>
---
 tools/perf/Documentation/intel-bts.txt |  86 +++
 tools/perf/arch/x86/util/Build         |   1 +
 tools/perf/arch/x86/util/auxtrace.c    |  49 +-
 tools/perf/arch/x86/util/intel-bts.c   | 458 ++++++++++++++++
 tools/perf/arch/x86/util/pmu.c         |   3 +
 tools/perf/util/Build                  |   1 +
 tools/perf/util/auxtrace.c             |   3 +
 tools/perf/util/auxtrace.h             |   1 +
 tools/perf/util/intel-bts.c            | 933 +++++++++++++++++++++++++++++++++
 tools/perf/util/intel-bts.h            |  43 ++
 tools/perf/util/pmu.c                  |   4 -
 11 files changed, 1576 insertions(+), 6 deletions(-)
 create mode 100644 tools/perf/Documentation/intel-bts.txt
 create mode 100644 tools/perf/arch/x86/util/intel-bts.c
 create mode 100644 tools/perf/util/intel-bts.c
 create mode 100644 tools/perf/util/intel-bts.h
tools/perf/Documentation/intel-bts.txt new file +86 -0
@@ -0,0 +1,86 @@ +Intel Branch Trace Store +======================== + +Overview +======== + +Intel BTS could be regarded as a predecessor to Intel PT and has some +similarities because it can also identify every branch a program takes. A +notable difference is that Intel BTS has no timing information and as a +consequence the present implementation is limited to per-thread recording. + +While decoding Intel BTS does not require walking the object code, the object +code is still needed to pair up calls and returns correctly, consequently much +of the Intel PT documentation applies also to Intel BTS. Refer to the Intel PT +documentation and consider that the PMU 'intel_bts' can usually be used in +place of 'intel_pt' in the examples provided, with the proviso that per-thread +recording must also be stipulated i.e. the --per-thread option for +'perf record'. + + +perf record +=========== + +new event +--------- + +The Intel BTS kernel driver creates a new PMU for Intel BTS. The perf record +option is: + + -e intel_bts// + +Currently Intel BTS is limited to per-thread tracing so the --per-thread option +is also needed. + + +snapshot option +--------------- + +The snapshot option is the same as Intel PT (refer Intel PT documentation). + + +auxtrace mmap size option +----------------------- + +The mmap size option is the same as Intel PT (refer Intel PT documentation). + + +perf script +=========== + +By default, perf script will decode trace data found in the perf.data file. +This can be further controlled by option --itrace. The --itrace option is +the same as Intel PT (refer Intel PT documentation) except that neither +"instructions" events nor "transactions" events (and consequently call +chains) are supported. + +To disable trace decoding entirely, use the option --no-itrace. + + +dump option +----------- + +perf script has an option (-D) to "dump" the events i.e. display the binary +data. + +When -D is used, Intel BTS packets are displayed. + +To disable the display of Intel BTS packets, combine the -D option with +--no-itrace. + + +perf report +=========== + +By default, perf report will decode trace data found in the perf.data file. +This can be further controlled by new option --itrace exactly the same as +perf script. + + +perf inject +=========== + +perf inject also accepts the --itrace option in which case tracing data is +removed and replaced with the synthesized events. e.g. + + perf inject --itrace -i perf.data -o perf.data.new
tools/perf/arch/x86/util/Build +1 -0
@@ -10,3 +10,4 @@ libperf-$(CONFIG_LIBDW_DWARF_UNWIND) += unwind-libdw.o libperf-$(CONFIG_AUXTRACE) += auxtrace.o libperf-$(CONFIG_AUXTRACE) += intel-pt.o +libperf-$(CONFIG_AUXTRACE) += intel-bts.o
tools/perf/arch/x86/util/auxtrace.c +47 -2
65 lines not on this page · raw message
tools/perf/arch/x86/util/intel-bts.c new file +458 -0
458 lines not on this page · raw message
tools/perf/arch/x86/util/pmu.c +3 -0
@@ -3,6 +3,7 @@#include <linux/perf_event.h> #include "../../util/intel-pt.h" +#include "../../util/intel-bts.h" #include "../../util/pmu.h" struct perf_event_attr *perf_pmu__get_default_config (struct perf_pmu *pmu__maybe_unused )
@@ -10,6 +11,8 @@ struct perf_event_attr *perf_pmu__get_default_config(struct perf_pmu *pmu __mayb#ifdef HAVE_AUXTRACE_SUPPORT if (!strcmp (pmu->name,INTEL_PT_PMU_NAME ))return intel_pt_pmu_default_config (pmu); +if (!strcmp (pmu->name,INTEL_BTS_PMU_NAME )) + pmu->selectable = true;#endif return NULL ; }
tools/perf/util/Build +1 -0
@@ -78,6 +78,7 @@ libperf-y += thread-stack.o libperf-$(CONFIG_AUXTRACE) += auxtrace.o libperf-$(CONFIG_AUXTRACE) += intel-pt-decoder/ libperf-$(CONFIG_AUXTRACE) += intel-pt.o +libperf-$(CONFIG_AUXTRACE) += intel-bts.o libperf-y += parse-branch-options.o libperf-$(CONFIG_LIBELF) += symbol-elf.o
tools/perf/util/auxtrace.c +3 -0
@@ -48,6 +48,7 @@#include "parse-options.h" #include "intel-pt.h" +#include "intel-bts.h" int auxtrace_mmap__mmap(struct auxtrace_mmap *mm, struct auxtrace_mmap_params *mp,
@@ -888,6 +889,8 @@ int perf_event__process_auxtrace_info(struct perf_tool *tool __maybe_unused,switch (type) {case PERF_AUXTRACE_INTEL_PT :return intel_pt_process_auxtrace_info (event, session); +case PERF_AUXTRACE_INTEL_BTS : +return intel_bts_process_auxtrace_info (event, session);case PERF_AUXTRACE_UNKNOWN :default :return -EINVAL ;
tools/perf/util/auxtrace.h +1 -0
@@ -40,6 +40,7 @@ struct events_stats;enum auxtrace_type {PERF_AUXTRACE_UNKNOWN ,PERF_AUXTRACE_INTEL_PT , +PERF_AUXTRACE_INTEL_BTS , };enum itrace_period_type {
tools/perf/util/intel-bts.c new file +933 -0
933 lines not on this page · raw message
tools/perf/util/intel-bts.h new file +43 -0
43 lines not on this page · raw message
tools/perf/util/pmu.c +0 -4
@@ -462,10 +462,6 @@ static struct perf_pmu *pmu_lookup(const char *name)LIST_HEAD (aliases);__u32 type; -/* No support for intel_bts so disallow it */ -if (!strcmp (name,"intel_bts" )) -return NULL ; -/* * The pmu data we store & need consists of the pmu * type value and format definitions. Load both right
Signature · 1 line
1.9.1
Arnaldo Carvalho de Melo
maintainerRe: [PATCH V8 08/25] perf tools: Add Intel BTS support
Em Fri, Jul 17, 2015 at 07:33:43PM +0300, Adrian Hunter escreveu:
Quoted 7 lines
Intel BTS support fits within the new auxtrace infrastructure. Recording is supporting by identifying the Intel BTS PMU, parsing options and setting up events.
Decoding is supported by queuing up trace data by thread and then decoding synchronously delivering synthesized event samples into the session processing for tools to consume.
So, I am not being able to reproduce the results from last time I tried it..
[root@zoo ~]# uname -r
4.2.0-rc5+
But all the DSOs are not being resolved :-\ Same machine, will try after lunch with a tip/master built kernel, right now I get this, perhaps that "81649 instruction errors" message? I'll see what are the results with tip/master, meanwhile what I have is at the tmp.perf/intel_pt branch in my tree.
- Arnaldo
[root@zoo ~]# perf record --per-thread -e intel_bts// usleep 1 [ perf record: Woken up 1 times to write data ]
[ perf record: Captured and wrote 1.884 MB perf.data ] [root@zoo ~]# perf evlist
intel_bts//
dummy:u
[root@zoo ~]# perf evlist -v
intel_bts//: type: 6, size: 112, { sample_period, sample_freq }: 1,sample_type: IP|TID|IDENTIFIER, read_format: ID, disabled: 1,enable_on_exec: 1, sample_id_all: 1, exclude_guest: 1 dummy:u: type: 1, size: 112, config: 0x9, { sample_period, sample_freq }: 1, sample_type: IP|TID|IDENTIFIER, read_format: ID, disabled: 1,exclude_kernel: 1, exclude_hv: 1, mmap: 1, comm: 1, enable_on_exec: 1,
task: 1, sample_id_all: 1, mmap2: 1, comm_exec: 1
[root@zoo ~]#
Warning:
81649 instruction trace errors
# To display the perf.data header info, please use --header/--header-only options. #
#
# Total Lost Samples: 0
#
# Samples: 0 of event 'intel_bts//'
# Event count (approx.): 0
#
# Overhead  Command  Shared Object  Symbol
# ........  .......  .............  ......
#
# Samples: 0 of event 'dummy:u'
# Event count (approx.): 0
#
# Overhead  Command  Shared Object  Symbol
# ........  .......  .............  ......
#
# Samples: 81K of event 'branches'
# Event count (approx.): 81649
#
# Overhead  Command  Shared Object     Symbol
# ........  .......  ................  ......................
#
     2.71%  usleep   [unknown]         [.] 0x00007fa0ff695061
     2.62%  usleep   [unknown]         [.] 0x00007fa0ffb3de7e
     1.96%  usleep   [unknown]         [.] 0x00007fa0ffb2e726
     1.92%  usleep   [unknown]         [.] 0x00007fa0ff695086
     1.60%  usleep   [unknown]         [.] 0xffffffff811c91d0
     1.48%  usleep   [unknown]         [.] 0x00007fa0ffb3030d
     1.24%  usleep   [unknown]         [.] 0x00007fa0ff6950c7
Quoted 1,821 lines
E.g:
[root@zoo ~]# perf record --per-thread -e intel_bts// ls
anaconda-ks.cfg b bin lib64 libexec new old perf.data
perf.data.oldstream_testtg.run
[ perf record: Woken up 2 times to write data ]
[ perf record: Captured and wrote 4.242 MB perf.data ]
[root@zoo ~]# perf evlist
intel_bts//
dummy:u
[root@zoo ~]# perf evlist -v
intel_bts//: type: 7, size: 112, {sample_period,sample_freq}: 1,
sample_type: IP|TID|IDENTIFIER,read_format: ID, disabled: 1,
enable_on_exec: 1,sample_id_all: 1,exclude_guest: 1 dummy:u:
type: 1, size: 112, config:0x9, {sample_period,sample_freq}: 1,
sample_type: IP|TID|IDENTIFIER,read_format: ID, disabled: 1,
exclude_kernel: 1,exclude_hv: 1, mmap: 1, comm: 1,enable_on_exec: 1,
task: 1,sample_id_all: 1, mmap2: 1,comm_exec: 1
[root@zoo ~]# perf report --stdio
# To display the perf.data header info, please use --header/--header-only options. #
#
# Total Lost Samples: 0
#
# Samples: 0 of event 'intel_bts//'
# Event count (approx.): 0
## Overhead Command Shared Object Symbol # ........ ....... ............. ......#
# Samples: 0 of event 'dummy:u'
# Event count (approx.): 0
## Overhead Command Shared Object Symbol # ........ ....... ............. ......#
# Samples: 184K of event 'branches'
# Event count (approx.): 184522
## Overhead Command Shared Object Symbol # ........ ....... .................. .............................................. # 7.36% ls [kernel.kallsyms] [.] unmap_single_vma 4.69% ls ld-2.20.so [.] strcmp 4.66% ls libc-2.20.so [.] _dl_addr 3.43% ls [kernel.kallsyms] [.] change_protection 3.01% ls ld-2.20.so [.] do_lookup_x 2.18% ls [kernel.kallsyms] [.] filemap_map_pages 2.09% ls ld-2.20.so [.] _dl_name_match_p 1.93% ls ld-2.20.so [.] _dl_lookup_symbol_x 1.91% ls [kernel.kallsyms] [.] page_remove_rmap 1.72% ls [kernel.kallsyms] [.] do_set_pte 1.48% ls ld-2.20.so [.] _dl_relocate_object 1.34% ls [kernel.kallsyms] [.] mem_cgroup_begin_page_stat 1.11% ls [kernel.kallsyms] [.] page_add_file_rmap 1.00% ls [kernel.kallsyms] [.] mark_page_accessed 0.97% ls [kernel.kallsyms] [.] perf_event_aux 0.95% ls [kernel.kallsyms] [.] handle_mm_fault 0.94% ls [kernel.kallsyms] [.] get_page_from_freelist <SNIP> [root@zoo ~]# perf record --per-thread -e intel_bts//u ls <SNIP> [ perf record: Woken up 1 times to write data ] [ perf record: Captured and wrote 1.278 MB perf.data ] [root@zoo ~]# perf report --stdio <SNIP> # Samples: 55K of event 'branches:u' # Event count (approx.): 55165 # # Overhead Command Shared Object Symbol # ........ ....... .................. ...................................... # 15.69% ls ld-2.20.so [.] strcmp 15.58% ls libc-2.20.so [.] _dl_addr 10.05% ls ld-2.20.so [.] do_lookup_x 6.98% ls ld-2.20.so [.] _dl_name_match_p 6.46% ls ld-2.20.so [.] _dl_lookup_symbol_x 4.95% ls ld-2.20.so [.] _dl_relocate_object 2.96% ls ls [.] quotearg_buffer_restyled 2.78% ls libc-2.20.so [.] getenv 1.91% ls ld-2.20.so [.] _dl_cache_libcmp 1.76% ls libc-2.20.so [.] __memmove_sse2 1.75% ls ld-2.20.so [.] check_match.isra.0 1.47% ls ld-2.20.so [.] _dl_map_object_deps 1.27% ls ld-2.20.so [.] _dl_map_object_from_fd 1.17% ls ls [.] quote_name 1.16% ls ld-2.20.so [.] _dl_check_map_versions <SNIP> 0.19% ls [kernel.kallsyms] [.] entry_SYSCALL_64_fastpath 0.19% ls [kernel.kallsyms] [.] native_irq_return_iret 0.19% ls libc-2.20.so [.] _IO_file_xsputn@@GLIBC_2.2.5<SNIP>
Signed-off-by Adrian Hunter <[email protected]>--- tools/perf/Documentation/intel-bts.txt | 86 +++ tools/perf/arch/x86/util/Build | 1 + tools/perf/arch/x86/util/auxtrace.c | 49 +- tools/perf/arch/x86/util/intel-bts.c | 458 ++++++++++++++++ tools/perf/arch/x86/util/pmu.c | 3 + tools/perf/util/Build | 1 + tools/perf/util/auxtrace.c | 3 + tools/perf/util/auxtrace.h | 1 + tools/perf/util/intel-bts.c | 933 +++++++++++++++++++++++++++++++++ tools/perf/util/intel-bts.h | 43 ++ tools/perf/util/pmu.c | 4 - 11 files changed, 1576 insertions(+), 6 deletions(-) create mode 100644 tools/perf/Documentation/intel-bts.txt create mode 100644 tools/perf/arch/x86/util/intel-bts.c create mode 100644 tools/perf/util/intel-bts.c create mode 100644 tools/perf/util/intel-bts.htools/perf/Documentation/intel-bts.txt new file +86
-0@@ -0,0 +1,86 @@ +Intel Branch Trace Store +======================== + +Overview +======== + +Intel BTS could be regarded as a predecessor to Intel PT and has some +similarities because it can also identify every branch a program takes. A +notable difference is that Intel BTS has no timing information and as a +consequence the present implementation is limited to per-thread recording. + +While decoding Intel BTS does not require walking the object code, the object +code is still needed to pair up calls and returns correctly, consequently much +of the Intel PT documentation applies also to Intel BTS. Refer to the Intel PT +documentation and consider that the PMU 'intel_bts' can usually be used in +place of 'intel_pt' in the examples provided, with the proviso that per-thread +recording must also be stipulated i.e. the --per-thread option for +'perf record'. + + +perf record +=========== + +new event +--------- + +The Intel BTS kernel driver creates a new PMU for Intel BTS. The perf record +option is: + + -e intel_bts// + +Currently Intel BTS is limited to per-thread tracing so the --per-thread option +is also needed. + + +snapshot option +--------------- + +The snapshot option is the same as Intel PT (refer Intel PT documentation). + + +auxtrace mmap size option +----------------------- + +The mmap size option is the same as Intel PT (refer Intel PT documentation). + + +perf script +=========== + +By default, perf script will decode trace data found in the perf.data file. +This can be further controlled by option --itrace. The --itrace option is +the same as Intel PT (refer Intel PT documentation) except that neither +"instructions" events nor "transactions" events (and consequently call +chains) are supported. + +To disable trace decoding entirely, use the option --no-itrace. + + +dump option +----------- + +perf script has an option (-D) to "dump" the events i.e. display the binary +data. + +When -D is used, Intel BTS packets are displayed. + +To disable the display of Intel BTS packets, combine the -D option with +--no-itrace. + + +perf report +=========== + +By default, perf report will decode trace data found in the perf.data file. +This can be further controlled by new option --itrace exactly the same as +perf script. + + +perf inject +=========== + +perf inject also accepts the --itrace option in which case tracing data is +removed and replaced with the synthesized events. e.g. + + perf inject --itrace -i perf.data -o perf.data.newtools/perf/arch/x86/util/Build +1
-0@@ -10,3 +10,4 @@ libperf-$(CONFIG_LIBDW_DWARF_UNWIND) += unwind-libdw.o libperf-$(CONFIG_AUXTRACE) += auxtrace.o libperf-$(CONFIG_AUXTRACE) += intel-pt.o +libperf-$(CONFIG_AUXTRACE) += intel-bts.otools/perf/arch/x86/util/auxtrace.c +47
-2@@ -13,11 +13,56 @@* */ +#include <stdbool.h> +#include "../../util/header.h" +#include "../../util/debug.h" +#include "../../util/pmu.h" #include "../../util/auxtrace.h" #include "../../util/intel-pt.h" +#include "../../util/intel-bts.h" +#include "../../util/evlist.h" + +static +struct auxtrace_record *auxtrace_record__init_intel (struct perf_evlist *evlist, +int *err) +{ +struct perf_pmu *intel_pt_pmu; +struct perf_pmu *intel_bts_pmu; +struct perf_evsel *evsel; +bool found_pt = false; +bool found_bts = false; + + intel_pt_pmu =perf_pmu__find (INTEL_PT_PMU_NAME ); + intel_bts_pmu =perf_pmu__find (INTEL_BTS_PMU_NAME ); + +if (evlist) { +evlist__for_each (evlist, evsel) { +if (intel_pt_pmu && + evsel->attr.type == intel_pt_pmu->type) + found_pt = true; +if (intel_bts_pmu && + evsel->attr.type == intel_bts_pmu->type) + found_bts = true; + } + } + +if (found_pt && found_bts) { +pr_err ("intel_pt and intel_bts may not be used together\n" ); + *err = -EINVAL ; +return NULL ; + } + +if (found_pt) +return intel_pt_recording_init (err); + +if (found_bts) +return intel_bts_recording_init (err); -struct auxtrace_record *auxtrace_record__init (struct perf_evlist *evlist__maybe_unused , +return NULL ; +} + +struct auxtrace_record *auxtrace_record__init (struct perf_evlist *evlist,int *err) {char buffer[64 ];@@ -32,7 +77,7 @@ struct auxtrace_record *auxtrace_record__init(struct perf_evlist *evlist __maybe }if (!strncmp (buffer,"GenuineIntel," ,13 )) -return intel_pt_recording_init (err); +return auxtrace_record__init_intel (evlist, err);return NULL ; }tools/perf/arch/x86/util/intel-bts.c new file +458
-0@@ -0,0 +1,458 @@ +/* +* intel-bts.c: Intel Processor Trace support +* Copyright (c) 2013-2015, Intel Corporation. +* +* This program is free software; you can redistribute it and/or modify it +* under the terms and conditions of the GNU General Public License, +* version 2, as published by the Free Software Foundation. +* +* This program is distributed in the hope it will be useful, but WITHOUT +* ANY WARRANTY; without even the implied warranty of MERCHANTABILITY or +* FITNESS FOR A PARTICULAR PURPOSE. See the GNU General Public License for +* more details. +* +*/ + +#include <linux/kernel.h> +#include <linux/types.h> +#include <linux/bitops.h> +#include <linux/log2.h> + +#include "../../util/cpumap.h" +#include "../../util/evsel.h" +#include "../../util/evlist.h" +#include "../../util/session.h" +#include "../../util/util.h" +#include "../../util/pmu.h" +#include "../../util/debug.h" +#include "../../util/tsc.h" +#include "../../util/auxtrace.h" +#include "../../util/intel-bts.h" + +#define KiB (x) ((x) * 1024) +#define MiB (x) ((x) * 1024 * 1024) +#define KiB_MASK (x) (KiB(x) - 1) +#define MiB_MASK (x) (MiB(x) - 1) + +#define INTEL_BTS_DFLT_SAMPLE_SIZE KiB(4) + +#define INTEL_BTS_MAX_SAMPLE_SIZE KiB(60) + +struct intel_bts_snapshot_ref { +void *ref_buf; +size_t ref_offset; +bool wrapped; +}; + +struct intel_bts_recording { +struct auxtrace_record itr; +struct perf_pmu *intel_bts_pmu; +struct perf_evlist *evlist; +bool snapshot_mode; +size_t snapshot_size; +int snapshot_ref_cnt; +struct intel_bts_snapshot_ref *snapshot_refs; +}; + +struct branch { +u64 from; +u64 to; +u64 misc; +}; + +static size_t intel_bts_info_priv_size (struct auxtrace_record *itr__maybe_unused ) +{ +return INTEL_BTS_AUXTRACE_PRIV_SIZE ; +} + +static int intel_bts_info_fill (struct auxtrace_record *itr, +struct perf_session *session, +struct auxtrace_info_event *auxtrace_info, +size_t priv_size) +{ +struct intel_bts_recording *btsr = + container_of(itr, struct intel_bts_recording, itr); +struct perf_pmu *intel_bts_pmu = btsr->intel_bts_pmu; +struct perf_event_mmap_page *pc; +struct perf_tsc_conversion tc = { .time_mult =0 , }; +bool cap_user_time_zero = false; +int err; + +if (priv_size !=INTEL_BTS_AUXTRACE_PRIV_SIZE ) +return -EINVAL ; + +if (!session->evlist->nr_mmaps) +return -EINVAL ; + + pc = session->evlist->mmap[0 ].base; +if (pc) { + err =perf_read_tsc_conversion (pc, &tc); +if (err) { +if (err != -EOPNOTSUPP ) +return err; + }else { + cap_user_time_zero = tc.time_mult !=0 ; + } +if (!cap_user_time_zero) +ui__warning ("Intel BTS: TSC not available\n" ); + } + + auxtrace_info->type =PERF_AUXTRACE_INTEL_BTS ; + auxtrace_info->priv[INTEL_BTS_PMU_TYPE ] = intel_bts_pmu->type; + auxtrace_info->priv[INTEL_BTS_TIME_SHIFT ] = tc.time_shift; + auxtrace_info->priv[INTEL_BTS_TIME_MULT ] = tc.time_mult; + auxtrace_info->priv[INTEL_BTS_TIME_ZERO ] = tc.time_zero; + auxtrace_info->priv[INTEL_BTS_CAP_USER_TIME_ZERO ] = cap_user_time_zero; + auxtrace_info->priv[INTEL_BTS_SNAPSHOT_MODE ] = btsr->snapshot_mode; + +return 0 ; +} + +static int intel_bts_recording_options (struct auxtrace_record *itr, +struct perf_evlist *evlist, +struct record_opts *opts) +{ +struct intel_bts_recording *btsr = + container_of(itr, struct intel_bts_recording, itr); +struct perf_pmu *intel_bts_pmu = btsr->intel_bts_pmu; +struct perf_evsel *evsel, *intel_bts_evsel =NULL ; +const struct cpu_map *cpus = evlist->cpus; +bool privileged =geteuid () ==0 ||perf_event_paranoid () <0 ; + + btsr->evlist = evlist; + btsr->snapshot_mode = opts->auxtrace_snapshot_mode; + +evlist__for_each (evlist, evsel) { +if (evsel->attr.type == intel_bts_pmu->type) { +if (intel_bts_evsel) { +pr_err ("There may be only one " INTEL_BTS_PMU_NAME " event\n" ); +return -EINVAL ; + } + evsel->attr.freq =0 ; + evsel->attr.sample_period =1 ; + intel_bts_evsel = evsel; + opts->full_auxtrace = true; + } + } + +if (opts->auxtrace_snapshot_mode && !opts->full_auxtrace) { +pr_err ("Snapshot mode (-S option) requires " INTEL_BTS_PMU_NAME " PMU event (-e " INTEL_BTS_PMU_NAME ")\n" ); +return -EINVAL ; + } + +if (!opts->full_auxtrace) +return 0 ; + +if (opts->full_auxtrace && !cpu_map__empty (cpus)) { +pr_err (INTEL_BTS_PMU_NAME " does not support per-cpu recording\n" ); +return -EINVAL ; + } + +/* Set default sizes for snapshot mode */ +if (opts->auxtrace_snapshot_mode) { +if (!opts->auxtrace_snapshot_size && !opts->auxtrace_mmap_pages) { +if (privileged) { + opts->auxtrace_mmap_pages =MiB (4 ) / page_size; + }else { + opts->auxtrace_mmap_pages =KiB (128 ) / page_size; +if (opts->mmap_pages ==UINT_MAX ) + opts->mmap_pages =KiB (256 ) / page_size; + } + }else if (!opts->auxtrace_mmap_pages && !privileged && + opts->mmap_pages ==UINT_MAX ) { + opts->mmap_pages =KiB (256 ) / page_size; + } +if (!opts->auxtrace_snapshot_size) + opts->auxtrace_snapshot_size = + opts->auxtrace_mmap_pages * (size_t )page_size; +if (!opts->auxtrace_mmap_pages) { +size_t sz = opts->auxtrace_snapshot_size; + + sz =round_up (sz, page_size) / page_size; + opts->auxtrace_mmap_pages =roundup_pow_of_two (sz); + } +if (opts->auxtrace_snapshot_size > + opts->auxtrace_mmap_pages * (size_t )page_size) { +pr_err ("Snapshot size %zu must not be greater than AUX area tracing mmap size %zu\n" , + opts->auxtrace_snapshot_size, + opts->auxtrace_mmap_pages * (size_t )page_size); +return -EINVAL ; + } +if (!opts->auxtrace_snapshot_size || !opts->auxtrace_mmap_pages) { +pr_err ("Failed to calculate default snapshot size and/or AUX area tracing mmap pages\n" ); +return -EINVAL ; + } +pr_debug2 ("Intel BTS snapshot size: %zu\n" , + opts->auxtrace_snapshot_size); + } + +/* Set default sizes for full trace mode */ +if (opts->full_auxtrace && !opts->auxtrace_mmap_pages) { +if (privileged) { + opts->auxtrace_mmap_pages =MiB (4 ) / page_size; + }else { + opts->auxtrace_mmap_pages =KiB (128 ) / page_size; +if (opts->mmap_pages ==UINT_MAX ) + opts->mmap_pages =KiB (256 ) / page_size; + } + } + +/* Validate auxtrace_mmap_pages */ +if (opts->auxtrace_mmap_pages) { +size_t sz = opts->auxtrace_mmap_pages * (size_t )page_size; +size_t min_sz; + +if (opts->auxtrace_snapshot_mode) + min_sz =KiB (4 ); +else + min_sz =KiB (8 ); + +if (sz < min_sz || !is_power_of_2 (sz)) { +pr_err ("Invalid mmap size for Intel BTS: must be at least %zuKiB and a power of 2\n" , + min_sz /1024 ); +return -EINVAL ; + } + } + +if (intel_bts_evsel) { +/* +* To obtain the auxtrace buffer file descriptor, the auxtrace event +* must come first. +*/ +perf_evlist__to_front (evlist, intel_bts_evsel); +/* +* In the case of per-cpu mmaps, we need the CPU on the +* AUX event. +*/ +if (!cpu_map__empty (cpus)) +perf_evsel__set_sample_bit (intel_bts_evsel,CPU ); + } + +/* Add dummy event to keep tracking */ +if (opts->full_auxtrace) { +struct perf_evsel *tracking_evsel; +int err; + + err =parse_events (evlist,"dummy:u" ,NULL ); +if (err) +return err; + + tracking_evsel =perf_evlist__last (evlist); + +perf_evlist__set_tracking_event (evlist, tracking_evsel); + + tracking_evsel->attr.freq =0 ; + tracking_evsel->attr.sample_period =1 ; + } + +return 0 ; +} + +static int intel_bts_parse_snapshot_options (struct auxtrace_record *itr, +struct record_opts *opts, +const char *str) +{ +struct intel_bts_recording *btsr = + container_of(itr, struct intel_bts_recording, itr); +unsigned long long snapshot_size =0 ; +char *endptr; + +if (str) { + snapshot_size =strtoull (str, &endptr,0 ); +if (*endptr || snapshot_size >SIZE_MAX ) +return -1 ; + } + + opts->auxtrace_snapshot_mode = true; + opts->auxtrace_snapshot_size = snapshot_size; + + btsr->snapshot_size = snapshot_size; + +return 0 ; +} + +static u64 intel_bts_reference (struct auxtrace_record *itr__maybe_unused ) +{ +return rdtsc (); +} + +static int intel_bts_alloc_snapshot_refs (struct intel_bts_recording *btsr, +int idx) +{ +const size_t sz =sizeof (struct intel_bts_snapshot_ref ); +int cnt = btsr->snapshot_ref_cnt, new_cnt = cnt *2 ; +struct intel_bts_snapshot_ref *refs; + +if (!new_cnt) + new_cnt =16 ; + +while (new_cnt <= idx) + new_cnt *=2 ; + + refs =calloc (new_cnt, sz); +if (!refs) +return -ENOMEM ; + +memcpy (refs, btsr->snapshot_refs, cnt * sz); + + btsr->snapshot_refs = refs; + btsr->snapshot_ref_cnt = new_cnt; + +return 0 ; +} + +static void intel_bts_free_snapshot_refs (struct intel_bts_recording *btsr) +{ +int i; + +for (i =0 ; i < btsr->snapshot_ref_cnt; i++) +zfree (&btsr->snapshot_refs[i].ref_buf); +zfree (&btsr->snapshot_refs); +} + +static void intel_bts_recording_free (struct auxtrace_record *itr) +{ +struct intel_bts_recording *btsr = + container_of(itr, struct intel_bts_recording, itr); + +intel_bts_free_snapshot_refs (btsr); +free (btsr); +} + +static int intel_bts_snapshot_start (struct auxtrace_record *itr) +{ +struct intel_bts_recording *btsr = + container_of(itr, struct intel_bts_recording, itr); +struct perf_evsel *evsel; + +evlist__for_each (btsr->evlist, evsel) { +if (evsel->attr.type == btsr->intel_bts_pmu->type) +return perf_evlist__disable_event (btsr->evlist, evsel); + } +return -EINVAL ; +} + +static int intel_bts_snapshot_finish (struct auxtrace_record *itr) +{ +struct intel_bts_recording *btsr = + container_of(itr, struct intel_bts_recording, itr); +struct perf_evsel *evsel; + +evlist__for_each (btsr->evlist, evsel) { +if (evsel->attr.type == btsr->intel_bts_pmu->type) +return perf_evlist__enable_event (btsr->evlist, evsel); + } +return -EINVAL ; +} + +static bool intel_bts_first_wrap (u64 *data,size_t buf_size) +{ +int i, a, b; + + b = buf_size >>3 ; + a = b -512 ; +if (a <0 ) + a =0 ; + +for (i = a; i < b; i++) { +if (data[i]) +return true; + } + +return false; +} + +static int intel_bts_find_snapshot (struct auxtrace_record *itr,int idx, +struct auxtrace_mmap *mm,unsigned char *data, +u64 *head,u64 *old) +{ +struct intel_bts_recording *btsr = + container_of(itr, struct intel_bts_recording, itr); +bool wrapped; +int err; + +pr_debug3 ("%s: mmap index %d old head %zu new head %zu\n" , + __func__, idx, (size_t )*old, (size_t )*head); + +if (idx >= btsr->snapshot_ref_cnt) { + err =intel_bts_alloc_snapshot_refs (btsr, idx); +if (err) + goto out_err; + } + + wrapped = btsr->snapshot_refs[idx].wrapped; +if (!wrapped &&intel_bts_first_wrap ((u64 *)data, mm->len)) { + btsr->snapshot_refs[idx].wrapped = true; + wrapped = true; + } + +/* +* In full trace mode 'head' continually increases. However in snapshot +* mode 'head' is an offset within the buffer. Here 'old' and 'head' +* are adjusted to match the full trace case which expects that 'old' is +* always less than 'head'. +*/ +if (wrapped) { + *old = *head; + *head += mm->len; + }else { +if (mm->mask) + *old &= mm->mask; +else + *old %= mm->len; +if (*old > *head) + *head += mm->len; + } + +pr_debug3 ("%s: wrap-around %sdetected, adjusted old head %zu adjusted new head %zu\n" , + __func__, wrapped ?"" :"not " , (size_t )*old, (size_t )*head); + +return 0 ; + +out_err: +pr_err ("%s: failed, error %d\n" , __func__, err); +return err; +} + +static int intel_bts_read_finish (struct auxtrace_record *itr,int idx) +{ +struct intel_bts_recording *btsr = + container_of(itr, struct intel_bts_recording, itr); +struct perf_evsel *evsel; + +evlist__for_each (btsr->evlist, evsel) { +if (evsel->attr.type == btsr->intel_bts_pmu->type) +return perf_evlist__enable_event_idx (btsr->evlist, + evsel, idx); + } +return -EINVAL ; +} + +struct auxtrace_record *intel_bts_recording_init (int *err) +{ +struct perf_pmu *intel_bts_pmu =perf_pmu__find (INTEL_BTS_PMU_NAME ); +struct intel_bts_recording *btsr; + +if (!intel_bts_pmu) +return NULL ; + + btsr =zalloc (sizeof (struct intel_bts_recording )); +if (!btsr) { + *err = -ENOMEM ; +return NULL ; + } + + btsr->intel_bts_pmu = intel_bts_pmu; + btsr->itr.recording_options = intel_bts_recording_options; + btsr->itr.info_priv_size = intel_bts_info_priv_size; + btsr->itr.info_fill = intel_bts_info_fill; + btsr->itr.free = intel_bts_recording_free; + btsr->itr.snapshot_start = intel_bts_snapshot_start; + btsr->itr.snapshot_finish = intel_bts_snapshot_finish; + btsr->itr.find_snapshot = intel_bts_find_snapshot; + btsr->itr.parse_snapshot_options = intel_bts_parse_snapshot_options; + btsr->itr.reference = intel_bts_reference; + btsr->itr.read_finish = intel_bts_read_finish; + btsr->itr.alignment =sizeof (struct branch ); +return &btsr->itr; +}tools/perf/arch/x86/util/pmu.c +3
-0@@ -3,6 +3,7 @@#include <linux/perf_event.h> #include "../../util/intel-pt.h" +#include "../../util/intel-bts.h" #include "../../util/pmu.h" struct perf_event_attr *perf_pmu__get_default_config (struct perf_pmu *pmu__maybe_unused )@@ -10,6 +11,8 @@ struct perf_event_attr *perf_pmu__get_default_config(struct perf_pmu *pmu __mayb#ifdef HAVE_AUXTRACE_SUPPORT if (!strcmp (pmu->name,INTEL_PT_PMU_NAME ))return intel_pt_pmu_default_config (pmu); +if (!strcmp (pmu->name,INTEL_BTS_PMU_NAME )) + pmu->selectable = true;#endif return NULL ; }tools/perf/util/Build +1
-0@@ -78,6 +78,7 @@ libperf-y += thread-stack.o libperf-$(CONFIG_AUXTRACE) += auxtrace.o libperf-$(CONFIG_AUXTRACE) += intel-pt-decoder/ libperf-$(CONFIG_AUXTRACE) += intel-pt.o +libperf-$(CONFIG_AUXTRACE) += intel-bts.o libperf-y += parse-branch-options.o libperf-$(CONFIG_LIBELF) += symbol-elf.otools/perf/util/auxtrace.c +3
-0@@ -48,6 +48,7 @@#include "parse-options.h" #include "intel-pt.h" +#include "intel-bts.h" int auxtrace_mmap__mmap(struct auxtrace_mmap *mm, struct auxtrace_mmap_params *mp,@@ -888,6 +889,8 @@ int perf_event__process_auxtrace_info(struct perf_tool *tool __maybe_unused,switch (type) {case PERF_AUXTRACE_INTEL_PT :return intel_pt_process_auxtrace_info (event, session); +case PERF_AUXTRACE_INTEL_BTS : +return intel_bts_process_auxtrace_info (event, session);case PERF_AUXTRACE_UNKNOWN :default :return -EINVAL ;tools/perf/util/auxtrace.h +1
-0@@ -40,6 +40,7 @@ struct events_stats;enum auxtrace_type {PERF_AUXTRACE_UNKNOWN ,PERF_AUXTRACE_INTEL_PT , +PERF_AUXTRACE_INTEL_BTS , };enum itrace_period_type {tools/perf/util/intel-bts.c new file +933
-0@@ -0,0 +1,933 @@ +/* +* intel-bts.c: Intel Processor Trace support +* Copyright (c) 2013-2015, Intel Corporation. +* +* This program is free software; you can redistribute it and/or modify it +* under the terms and conditions of the GNU General Public License, +* version 2, as published by the Free Software Foundation. +* +* This program is distributed in the hope it will be useful, but WITHOUT +* ANY WARRANTY; without even the implied warranty of MERCHANTABILITY or +* FITNESS FOR A PARTICULAR PURPOSE. See the GNU General Public License for +* more details. +* +*/ + +#include <endian.h> +#include <byteswap.h> +#include <linux/kernel.h> +#include <linux/types.h> +#include <linux/bitops.h> +#include <linux/log2.h> + +#include "cpumap.h" +#include "color.h" +#include "evsel.h" +#include "evlist.h" +#include "machine.h" +#include "session.h" +#include "util.h" +#include "thread.h" +#include "thread-stack.h" +#include "debug.h" +#include "tsc.h" +#include "auxtrace.h" +#include "intel-pt-decoder/intel-pt-insn-decoder.h" +#include "intel-bts.h" + +#define MAX_TIMESTAMP (~0ULL) + +#define INTEL_BTS_ERR_NOINSN 5 +#define INTEL_BTS_ERR_LOST 9 + +#if __BYTE_ORDER == __BIG_ENDIAN +#define le64_to_cpu bswap_64 +#else +#define le64_to_cpu +#endif + +struct intel_bts { +struct auxtrace auxtrace; +struct auxtrace_queues queues; +struct auxtrace_heap heap; +u32 auxtrace_type; +struct perf_session *session; +struct machine *machine; +bool sampling_mode; +bool snapshot_mode; +bool data_queued; +u32 pmu_type; +struct perf_tsc_conversion tc; +bool cap_user_time_zero; +struct itrace_synth_opts synth_opts; +bool sample_branches; +u32 branches_filter; +u64 branches_sample_type; +u64 branches_id; +size_t branches_event_size; +bool synth_needs_swap; +}; + +struct intel_bts_queue { +struct intel_bts *bts; +unsigned int queue_nr; +struct auxtrace_buffer *buffer; +bool on_heap; +bool done; +pid_t pid; +pid_t tid; +int cpu; +u64 time; +struct intel_pt_insn intel_pt_insn; +u32 sample_flags; +}; + +struct branch { +u64 from; +u64 to; +u64 misc; +}; + +static void intel_bts_dump (struct intel_bts *bts__maybe_unused , +unsigned char *buf,size_t len) +{ +struct branch *branch; +size_t i, pos =0 , br_sz =sizeof (struct branch ), sz; +const char *color =PERF_COLOR_BLUE ; + +color_fprintf (stdout, color, +". ... Intel BTS data: size %zu bytes\n" , + len); + +while (len) { +if (len >= br_sz) + sz = br_sz; +else + sz = len; +printf ("." ); +color_fprintf (stdout, color," %08x: " , pos); +for (i =0 ; i < sz; i++) +color_fprintf (stdout, color," %02x" , buf[i]); +for (; i < br_sz; i++) +color_fprintf (stdout, color," " ); +if (len >= br_sz) { + branch = (struct branch *)buf; +color_fprintf (stdout, color," %" PRIx64" -> %" PRIx64" %s\n" , +le64_to_cpu (branch->from), +le64_to_cpu (branch->to), +le64_to_cpu (branch->misc) &0x10 ? +"pred" :"miss" ); + }else { +color_fprintf (stdout, color," Bad record!\n" ); + } + pos += sz; + buf += sz; + len -= sz; + } +} + +static void intel_bts_dump_event (struct intel_bts *bts,unsigned char *buf, +size_t len) +{ +printf (".\n" ); +intel_bts_dump (bts, buf, len); +} + +static int intel_bts_lost (struct intel_bts *bts,struct perf_sample *sample) +{ +union perf_event event; +int err; + +auxtrace_synth_error (&event.auxtrace_error,PERF_AUXTRACE_ERROR_ITRACE , +INTEL_BTS_ERR_LOST , sample->cpu, sample->pid, + sample->tid,0 ,"Lost trace data" ); + + err =perf_session__deliver_synth_event (bts->session, &event,NULL ); +if (err) +pr_err ("Intel BTS: failed to deliver error event, error %d\n" , + err); + +return err; +} + +static struct intel_bts_queue *intel_bts_alloc_queue (struct intel_bts *bts, +unsigned int queue_nr) +{ +struct intel_bts_queue *btsq; + + btsq =zalloc (sizeof (struct intel_bts_queue )); +if (!btsq) +return NULL ; + + btsq->bts = bts; + btsq->queue_nr = queue_nr; + btsq->pid =-1 ; + btsq->tid =-1 ; + btsq->cpu =-1 ; + +return btsq; +} + +static int intel_bts_setup_queue (struct intel_bts *bts, +struct auxtrace_queue *queue, +unsigned int queue_nr) +{ +struct intel_bts_queue *btsq = queue->priv; + +if (list_empty (&queue->head)) +return 0 ; + +if (!btsq) { + btsq =intel_bts_alloc_queue (bts, queue_nr); +if (!btsq) +return -ENOMEM ; + queue->priv = btsq; + +if (queue->cpu !=-1 ) + btsq->cpu = queue->cpu; + btsq->tid = queue->tid; + } + +if (bts->sampling_mode) +return 0 ; + +if (!btsq->on_heap && !btsq->buffer) { +int ret; + + btsq->buffer =auxtrace_buffer__next (queue,NULL ); +if (!btsq->buffer) +return 0 ; + + ret =auxtrace_heap__add (&bts->heap, queue_nr, + btsq->buffer->reference); +if (ret) +return ret; + btsq->on_heap = true; + } + +return 0 ; +} + +static int intel_bts_setup_queues (struct intel_bts *bts) +{ +unsigned int i; +int ret; + +for (i =0 ; i < bts->queues.nr_queues; i++) { + ret =intel_bts_setup_queue (bts, &bts->queues.queue_array[i], + i); +if (ret) +return ret; + } +return 0 ; +} + +static inline int intel_bts_update_queues (struct intel_bts *bts) +{ +if (bts->queues.new_data) { + bts->queues.new_data = false; +return intel_bts_setup_queues (bts); + } +return 0 ; +} + +static unsigned char *intel_bts_find_overlap (unsigned char *buf_a,size_t len_a, +unsigned char *buf_b,size_t len_b) +{ +size_t offs, len; + +if (len_a > len_b) + offs = len_a - len_b; +else + offs =0 ; + +for (; offs < len_a; offs +=sizeof (struct branch )) { + len = len_a - offs; +if (!memcmp (buf_a + offs, buf_b, len)) +return buf_b + len; + } + +return buf_b; +} + +static int intel_bts_do_fix_overlap (struct auxtrace_queue *queue, +struct auxtrace_buffer *b) +{ +struct auxtrace_buffer *a; +void *start; + +if (b->list.prev == &queue->head) +return 0 ; + a = list_entry(b->list.prev, struct auxtrace_buffer, list); + start =intel_bts_find_overlap (a->data, a->size, b->data, b->size); +if (!start) +return -EINVAL ; + b->use_size = b->data + b->size - start; + b->use_data = start; +return 0 ; +} + +static int intel_bts_synth_branch_sample (struct intel_bts_queue *btsq, +struct branch *branch) +{ +int ret; +struct intel_bts *bts = btsq->bts; +union perf_event event; +struct perf_sample sample = { .ip =0 , }; + + event.sample.header.type =PERF_RECORD_SAMPLE ; + event.sample.header.misc =PERF_RECORD_MISC_USER ; + event.sample.header.size =sizeof (struct perf_event_header ); + + sample.ip =le64_to_cpu (branch->from); + sample.pid = btsq->pid; + sample.tid = btsq->tid; + sample.addr =le64_to_cpu (branch->to); + sample.id = btsq->bts->branches_id; + sample.stream_id = btsq->bts->branches_id; + sample.period =1 ; + sample.cpu = btsq->cpu; + sample.flags = btsq->sample_flags; + sample.insn_len = btsq->intel_pt_insn.length; + +if (bts->synth_opts.inject) { + event.sample.header.size = bts->branches_event_size; + ret =perf_event__synthesize_sample (&event, + bts->branches_sample_type, +0 , &sample, + bts->synth_needs_swap); +if (ret) +return ret; + } + + ret =perf_session__deliver_synth_event (bts->session, &event, &sample); +if (ret) +pr_err ("Intel BTS: failed to deliver branch event, error %d\n" , + ret); + +return ret; +} + +static int intel_bts_get_next_insn (struct intel_bts_queue *btsq,u64 ip) +{ +struct machine *machine = btsq->bts->machine; +struct thread *thread; +struct addr_location al; +unsigned char buf[1024 ]; +size_t bufsz; +ssize_t len; +int x86_64; +uint8_t cpumode; +int err =-1 ; + + bufsz =intel_pt_insn_max_size (); + +if (machine__kernel_ip (machine, ip)) + cpumode =PERF_RECORD_MISC_KERNEL ; +else + cpumode =PERF_RECORD_MISC_USER ; + + thread =machine__find_thread (machine,-1 , btsq->tid); +if (!thread) +return -1 ; + +thread__find_addr_map (thread, cpumode,MAP__FUNCTION , ip, &al); +if (!al.map || !al.map->dso) + goto out_put; + + len =dso__data_read_addr (al.map->dso, al.map, machine, ip, buf, bufsz); +if (len <=0 ) + goto out_put; + +/* Load maps to ensure dso->is_64_bit has been updated */ +map__load (al.map, machine->symbol_filter); + + x86_64 = al.map->dso->is_64_bit; + +if (intel_pt_get_insn (buf, len, x86_64, &btsq->intel_pt_insn)) + goto out_put; + + err =0 ; +out_put: +thread__put (thread); +return err; +} + +static int intel_bts_synth_error (struct intel_bts *bts,int cpu,pid_t pid, +pid_t tid,u64 ip) +{ +union perf_event event; +int err; + +auxtrace_synth_error (&event.auxtrace_error,PERF_AUXTRACE_ERROR_ITRACE , +INTEL_BTS_ERR_NOINSN , cpu, pid, tid, ip, +"Failed to get instruction" ); + + err =perf_session__deliver_synth_event (bts->session, &event,NULL ); +if (err) +pr_err ("Intel BTS: failed to deliver error event, error %d\n" , + err); + +return err; +} + +static int intel_bts_get_branch_type (struct intel_bts_queue *btsq, +struct branch *branch) +{ +int err; + +if (!branch->from) { +if (branch->to) + btsq->sample_flags =PERF_IP_FLAG_BRANCH | +PERF_IP_FLAG_TRACE_BEGIN ; +else + btsq->sample_flags =0 ; + btsq->intel_pt_insn.length =0 ; + }else if (!branch->to) { + btsq->sample_flags =PERF_IP_FLAG_BRANCH | +PERF_IP_FLAG_TRACE_END ; + btsq->intel_pt_insn.length =0 ; + }else { + err =intel_bts_get_next_insn (btsq, branch->from); +if (err) { + btsq->sample_flags =0 ; + btsq->intel_pt_insn.length =0 ; +if (!btsq->bts->synth_opts.errors) +return 0 ; + err =intel_bts_synth_error (btsq->bts, btsq->cpu, + btsq->pid, btsq->tid, + branch->from); +return err; + } + btsq->sample_flags =intel_pt_insn_type (btsq->intel_pt_insn.op); +/* Check for an async branch into the kernel */ +if (!machine__kernel_ip (btsq->bts->machine, branch->from) && +machine__kernel_ip (btsq->bts->machine, branch->to) && + btsq->sample_flags != (PERF_IP_FLAG_BRANCH | +PERF_IP_FLAG_CALL | +PERF_IP_FLAG_SYSCALLRET )) + btsq->sample_flags =PERF_IP_FLAG_BRANCH | +PERF_IP_FLAG_CALL | +PERF_IP_FLAG_ASYNC | +PERF_IP_FLAG_INTERRUPT ; + } + +return 0 ; +} + +static int intel_bts_process_buffer (struct intel_bts_queue *btsq, +struct auxtrace_buffer *buffer) +{ +struct branch *branch; +size_t sz, bsz =sizeof (struct branch ); +u32 filter = btsq->bts->branches_filter; +int err =0 ; + +if (buffer->use_data) { + sz = buffer->use_size; + branch = buffer->use_data; + }else { + sz = buffer->size; + branch = buffer->data; + } + +if (!btsq->bts->sample_branches) +return 0 ; + +for (; sz > bsz; branch +=1 , sz -= bsz) { +if (!branch->from && !branch->to) +continue ; +intel_bts_get_branch_type (btsq, branch); +if (filter && !(filter & btsq->sample_flags)) +continue ; + err =intel_bts_synth_branch_sample (btsq, branch); +if (err) +break ; + } +return err; +} + +static int intel_bts_process_queue (struct intel_bts_queue *btsq,u64 *timestamp) +{ +struct auxtrace_buffer *buffer = btsq->buffer, *old_buffer = buffer; +struct auxtrace_queue *queue; +struct thread *thread; +int err; + +if (btsq->done) +return 1 ; + +if (btsq->pid ==-1 ) { + thread =machine__find_thread (btsq->bts->machine,-1 , + btsq->tid); +if (thread) + btsq->pid = thread->pid_; + }else { + thread =machine__findnew_thread (btsq->bts->machine, btsq->pid, + btsq->tid); + } + + queue = &btsq->bts->queues.queue_array[btsq->queue_nr]; + +if (!buffer) + buffer =auxtrace_buffer__next (queue,NULL ); + +if (!buffer) { +if (!btsq->bts->sampling_mode) + btsq->done =1 ; + err =1 ; + goto out_put; + } + +/* Currently there is no support for split buffers */ +if (buffer->consecutive) { + err = -EINVAL ; + goto out_put; + } + +if (!buffer->data) { +int fd =perf_data_file__fd (btsq->bts->session->file); + + buffer->data =auxtrace_buffer__get_data (buffer, fd); +if (!buffer->data) { + err = -ENOMEM ; + goto out_put; + } + } + +if (btsq->bts->snapshot_mode && !buffer->consecutive && +intel_bts_do_fix_overlap (queue, buffer)) { + err = -ENOMEM ; + goto out_put; + } + +if (!btsq->bts->synth_opts.callchain && thread && + (!old_buffer || btsq->bts->sampling_mode || + (btsq->bts->snapshot_mode && !buffer->consecutive))) +thread_stack__set_trace_nr (thread, buffer->buffer_nr +1 ); + + err =intel_bts_process_buffer (btsq, buffer); + +auxtrace_buffer__drop_data (buffer); + + btsq->buffer =auxtrace_buffer__next (queue, buffer); +if (btsq->buffer) { +if (timestamp) + *timestamp = btsq->buffer->reference; + }else { +if (!btsq->bts->sampling_mode) + btsq->done =1 ; + } +out_put: +thread__put (thread); +return err; +} + +static int intel_bts_flush_queue (struct intel_bts_queue *btsq) +{ +u64 ts =0 ; +int ret; + +while (1 ) { + ret =intel_bts_process_queue (btsq, &ts); +if (ret <0 ) +return ret; +if (ret) +break ; + } +return 0 ; +} + +static int intel_bts_process_tid_exit (struct intel_bts *bts,pid_t tid) +{ +struct auxtrace_queues *queues = &bts->queues; +unsigned int i; + +for (i =0 ; i < queues->nr_queues; i++) { +struct auxtrace_queue *queue = &bts->queues.queue_array[i]; +struct intel_bts_queue *btsq = queue->priv; + +if (btsq && btsq->tid == tid) +return intel_bts_flush_queue (btsq); + } +return 0 ; +} + +static int intel_bts_process_queues (struct intel_bts *bts,u64 timestamp) +{ +while (1 ) { +unsigned int queue_nr; +struct auxtrace_queue *queue; +struct intel_bts_queue *btsq; +u64 ts =0 ; +int ret; + +if (!bts->heap.heap_cnt) +return 0 ; + +if (bts->heap.heap_array[0 ].ordinal > timestamp) +return 0 ; + + queue_nr = bts->heap.heap_array[0 ].queue_nr; + queue = &bts->queues.queue_array[queue_nr]; + btsq = queue->priv; + +auxtrace_heap__pop (&bts->heap); + + ret =intel_bts_process_queue (btsq, &ts); +if (ret <0 ) { +auxtrace_heap__add (&bts->heap, queue_nr, ts); +return ret; + } + +if (!ret) { + ret =auxtrace_heap__add (&bts->heap, queue_nr, ts); +if (ret <0 ) +return ret; + }else { + btsq->on_heap = false; + } + } + +return 0 ; +} + +static int intel_bts_process_event (struct perf_session *session, +union perf_event *event, +struct perf_sample *sample, +struct perf_tool *tool) +{ + struct intel_bts *bts = container_of(session->auxtrace, struct intel_bts, + auxtrace); +u64 timestamp; +int err; + +if (dump_trace) +return 0 ; + +if (!tool->ordered_events) { +pr_err ("Intel BTS requires ordered events\n" ); +return -EINVAL ; + } + +if (sample->time) + timestamp =perf_time_to_tsc (sample->time, &bts->tc); +else + timestamp =0 ; + + err =intel_bts_update_queues (bts); +if (err) +return err; + + err =intel_bts_process_queues (bts, timestamp); +if (err) +return err; +if (event->header.type ==PERF_RECORD_EXIT ) { + err =intel_bts_process_tid_exit (bts, event->comm.tid); +if (err) +return err; + } + +if (event->header.type ==PERF_RECORD_AUX && + (event->aux.flags &PERF_AUX_FLAG_TRUNCATED ) && + bts->synth_opts.errors) + err =intel_bts_lost (bts, sample); + +return err; +} + +static int intel_bts_process_auxtrace_event (struct perf_session *session, +union perf_event *event, +struct perf_tool *tool__maybe_unused ) +{ + struct intel_bts *bts = container_of(session->auxtrace, struct intel_bts, + auxtrace); + +if (bts->sampling_mode) +return 0 ; + +if (!bts->data_queued) { +struct auxtrace_buffer *buffer; +off_t data_offset; +int fd =perf_data_file__fd (session->file); +int err; + +if (perf_data_file__is_pipe (session->file)) { + data_offset =0 ; + }else { + data_offset =lseek (fd,0 ,SEEK_CUR ); +if (data_offset ==-1 ) +return -errno; + } + + err =auxtrace_queues__add_event (&bts->queues, session, event, + data_offset, &buffer); +if (err) +return err; + +/* Dump here now we have copied a piped trace out of the pipe */ +if (dump_trace) { +if (auxtrace_buffer__get_data (buffer, fd)) { +intel_bts_dump_event (bts, buffer->data, + buffer->size); +auxtrace_buffer__put_data (buffer); + } + } + } + +return 0 ; +} + +static int intel_bts_flush (struct perf_session *session__maybe_unused , +struct perf_tool *tool__maybe_unused ) +{ + struct intel_bts *bts = container_of(session->auxtrace, struct intel_bts, + auxtrace); +int ret; + +if (dump_trace || bts->sampling_mode) +return 0 ; + +if (!tool->ordered_events) +return -EINVAL ; + + ret =intel_bts_update_queues (bts); +if (ret <0 ) +return ret; + +return intel_bts_process_queues (bts,MAX_TIMESTAMP ); +} + +static void intel_bts_free_queue (void *priv) +{ +struct intel_bts_queue *btsq = priv; + +if (!btsq) +return ; +free (btsq); +} + +static void intel_bts_free_events (struct perf_session *session) +{ + struct intel_bts *bts = container_of(session->auxtrace, struct intel_bts, + auxtrace); +struct auxtrace_queues *queues = &bts->queues; +unsigned int i; + +for (i =0 ; i < queues->nr_queues; i++) { +intel_bts_free_queue (queues->queue_array[i].priv); + queues->queue_array[i].priv =NULL ; + } +auxtrace_queues__free (queues); +} + +static void intel_bts_free (struct perf_session *session) +{ + struct intel_bts *bts = container_of(session->auxtrace, struct intel_bts, + auxtrace); + +auxtrace_heap__free (&bts->heap); +intel_bts_free_events (session); + session->auxtrace =NULL ; +free (bts); +} + +struct intel_bts_synth { +struct perf_tool dummy_tool; +struct perf_session *session; +}; + +static int intel_bts_event_synth (struct perf_tool *tool, +union perf_event *event, +struct perf_sample *sample__maybe_unused , +struct machine *machine__maybe_unused ) +{ +struct intel_bts_synth *intel_bts_synth = + container_of(tool, struct intel_bts_synth, dummy_tool); + +return perf_session__deliver_synth_event (intel_bts_synth->session, + event,NULL ); +} + +static int intel_bts_synth_event (struct perf_session *session, +struct perf_event_attr *attr,u64 id) +{ +struct intel_bts_synth intel_bts_synth; + +memset (&intel_bts_synth,0 ,sizeof (struct intel_bts_synth )); + intel_bts_synth.session = session; + +return perf_event__synthesize_attr (&intel_bts_synth.dummy_tool, attr,1 , + &id, intel_bts_event_synth); +} + +static int intel_bts_synth_events (struct intel_bts *bts, +struct perf_session *session) +{ +struct perf_evlist *evlist = session->evlist; +struct perf_evsel *evsel; +struct perf_event_attr attr; +bool found = false; +u64 id; +int err; + +evlist__for_each (evlist, evsel) { +if (evsel->attr.type == bts->pmu_type && evsel->ids) { + found = true; +break ; + } + } + +if (!found) { +pr_debug ("There are no selected events with Intel BTS data\n" ); +return 0 ; + } + +memset (&attr,0 ,sizeof (struct perf_event_attr )); + attr.size =sizeof (struct perf_event_attr ); + attr.type =PERF_TYPE_HARDWARE ; + attr.sample_type = evsel->attr.sample_type &PERF_SAMPLE_MASK ; + attr.sample_type |=PERF_SAMPLE_IP |PERF_SAMPLE_TID | +PERF_SAMPLE_PERIOD ; + attr.sample_type &= ~(u64 )PERF_SAMPLE_TIME ; + attr.sample_type &= ~(u64 )PERF_SAMPLE_CPU ; + attr.exclude_user = evsel->attr.exclude_user; + attr.exclude_kernel = evsel->attr.exclude_kernel; + attr.exclude_hv = evsel->attr.exclude_hv; + attr.exclude_host = evsel->attr.exclude_host; + attr.exclude_guest = evsel->attr.exclude_guest; + attr.sample_id_all = evsel->attr.sample_id_all; + attr.read_format = evsel->attr.read_format; + + id = evsel->id[0 ] +1000000000 ; +if (!id) + id =1 ; + +if (bts->synth_opts.branches) { + attr.config =PERF_COUNT_HW_BRANCH_INSTRUCTIONS ; + attr.sample_period =1 ; + attr.sample_type |=PERF_SAMPLE_ADDR ; +pr_debug ("Synthesizing 'branches' event with id %" PRIu64" sample type %#" PRIx64"\n" , + id, (u64 )attr.sample_type); + err =intel_bts_synth_event (session, &attr, id); +if (err) { +pr_err ("%s: failed to synthesize 'branches' event type\n" , + __func__); +return err; + } + bts->sample_branches = true; + bts->branches_sample_type = attr.sample_type; + bts->branches_id = id; +/* +* We only use sample types from PERF_SAMPLE_MASK so we can use +* __perf_evsel__sample_size() here. +*/ + bts->branches_event_size =sizeof (struct sample_event ) + +__perf_evsel__sample_size (attr.sample_type); + } + + bts->synth_needs_swap = evsel->needs_swap; + +return 0 ; +} + +static const char *const intel_bts_info_fmts[] = { + [INTEL_BTS_PMU_TYPE ] =" PMU Type %" PRId64"\n" , + [INTEL_BTS_TIME_SHIFT ] =" Time Shift %" PRIu64"\n" , + [INTEL_BTS_TIME_MULT ] =" Time Muliplier %" PRIu64"\n" , + [INTEL_BTS_TIME_ZERO ] =" Time Zero %" PRIu64"\n" , + [INTEL_BTS_CAP_USER_TIME_ZERO ] =" Cap Time Zero %" PRId64"\n" , + [INTEL_BTS_SNAPSHOT_MODE ] =" Snapshot mode %" PRId64"\n" , +}; + +static void intel_bts_print_info (u64 *arr,int start,int finish) +{ +int i; + +if (!dump_trace) +return ; + +for (i = start; i <= finish; i++) +fprintf (stdout, intel_bts_info_fmts[i], arr[i]); +} + +u64 intel_bts_auxtrace_info_priv[INTEL_BTS_AUXTRACE_PRIV_SIZE ]; + +int intel_bts_process_auxtrace_info (union perf_event *event, +struct perf_session *session) +{ +struct auxtrace_info_event *auxtrace_info = &event->auxtrace_info; +size_t min_sz =sizeof (u64) *INTEL_BTS_SNAPSHOT_MODE ; +struct intel_bts *bts; +int err; + +if (auxtrace_info->header.size <sizeof (struct auxtrace_info_event ) + + min_sz) +return -EINVAL ; + + bts =zalloc (sizeof (struct intel_bts )); +if (!bts) +return -ENOMEM ; + + err =auxtrace_queues__init (&bts->queues); +if (err) + goto err_free; + + bts->session = session; + bts->machine = &session->machines.host;/* No kvm support */ + bts->auxtrace_type = auxtrace_info->type; + bts->pmu_type = auxtrace_info->priv[INTEL_BTS_PMU_TYPE ]; + bts->tc.time_shift = auxtrace_info->priv[INTEL_BTS_TIME_SHIFT ]; + bts->tc.time_mult = auxtrace_info->priv[INTEL_BTS_TIME_MULT ]; + bts->tc.time_zero = auxtrace_info->priv[INTEL_BTS_TIME_ZERO ]; + bts->cap_user_time_zero = + auxtrace_info->priv[INTEL_BTS_CAP_USER_TIME_ZERO ]; + bts->snapshot_mode = auxtrace_info->priv[INTEL_BTS_SNAPSHOT_MODE ]; + + bts->sampling_mode = false; + + bts->auxtrace.process_event = intel_bts_process_event; + bts->auxtrace.process_auxtrace_event = intel_bts_process_auxtrace_event; + bts->auxtrace.flush_events = intel_bts_flush; + bts->auxtrace.free_events = intel_bts_free_events; + bts->auxtrace.free = intel_bts_free; + session->auxtrace = &bts->auxtrace; + +intel_bts_print_info (&auxtrace_info->priv[0 ],INTEL_BTS_PMU_TYPE , +INTEL_BTS_SNAPSHOT_MODE ); + +if (dump_trace) +return 0 ; + +if (session->itrace_synth_opts && session->itrace_synth_opts->set) + bts->synth_opts = *session->itrace_synth_opts; +else +itrace_synth_opts__set_default (&bts->synth_opts); + +if (bts->synth_opts.calls) + bts->branches_filter |=PERF_IP_FLAG_CALL |PERF_IP_FLAG_ASYNC | +PERF_IP_FLAG_TRACE_END ; +if (bts->synth_opts.returns) + bts->branches_filter |=PERF_IP_FLAG_RETURN | +PERF_IP_FLAG_TRACE_BEGIN ; + + err =intel_bts_synth_events (bts, session); +if (err) + goto err_free_queues; + + err =auxtrace_queues__process_index (&bts->queues, session); +if (err) + goto err_free_queues; + +if (bts->queues.populated) + bts->data_queued = true; + +return 0 ; + +err_free_queues: +auxtrace_queues__free (&bts->queues); + session->auxtrace =NULL ; +err_free: +free (bts); +return err; +}tools/perf/util/intel-bts.h new file +43
-0@@ -0,0 +1,43 @@ +/* +* intel-bts.h: Intel Processor Trace support +* Copyright (c) 2013-2014, Intel Corporation. +* +* This program is free software; you can redistribute it and/or modify it +* under the terms and conditions of the GNU General Public License, +* version 2, as published by the Free Software Foundation. +* +* This program is distributed in the hope it will be useful, but WITHOUT +* ANY WARRANTY; without even the implied warranty of MERCHANTABILITY or +* FITNESS FOR A PARTICULAR PURPOSE. See the GNU General Public License for +* more details. +* +*/ + +#ifndef INCLUDE__PERF_INTEL_BTS_H__ +#define INCLUDE__PERF_INTEL_BTS_H__ + +#define INTEL_BTS_PMU_NAME "intel_bts" + +enum { +INTEL_BTS_PMU_TYPE , +INTEL_BTS_TIME_SHIFT , +INTEL_BTS_TIME_MULT , +INTEL_BTS_TIME_ZERO , +INTEL_BTS_CAP_USER_TIME_ZERO , +INTEL_BTS_SNAPSHOT_MODE , +INTEL_BTS_AUXTRACE_PRIV_MAX , +}; + +#define INTEL_BTS_AUXTRACE_PRIV_SIZE (INTEL_BTS_AUXTRACE_PRIV_MAX * sizeof(u64)) + +struct auxtrace_record ; +struct perf_tool ; +union perf_event ; +struct perf_session ; + +struct auxtrace_record *intel_bts_recording_init (int *err); + +int intel_bts_process_auxtrace_info (union perf_event *event, +struct perf_session *session); + +#endif tools/perf/util/pmu.c +0
-4@@ -462,10 +462,6 @@ static struct perf_pmu *pmu_lookup(const char *name)LIST_HEAD (aliases);__u32 type; -/* No support for intel_bts so disallow it */ -if (!strcmp (name,"intel_bts" )) -return NULL ; -/* * The pmu data we store & need consists of the pmu * type value and format definitions. Load both right Signature · 1 line
1.9.1
Adrian Hunter
reviewerRe: [PATCH V8 08/25] perf tools: Add Intel BTS support
Quoted 64 lines · Arnaldo Carvalho de Melo
Em Fri, Jul 17, 2015 at 07:33:43PM +0300, Adrian Hunter escreveu:
Quoted 7 lines
Intel BTS support fits within the new auxtrace infrastructure. Recording is supporting by identifying the Intel BTS PMU, parsing options and setting up events.
Decoding is supported by queuing up trace data by thread and then decoding synchronously delivering synthesized event samples into the session processing for tools to consume.
So, I am not being able to reproduce the results from last time I tried it..
[root@zoo ~]# uname -r
4.2.0-rc5+But all the DSOs are not being resolved :-\ Same machine, will try after lunch with a tip/master built kernel, right now I get this, perhaps that "81649 instruction errors" message? I'll see what are the results with tip/master, meanwhile what I have is at the tmp.perf/intel_pt branch in my tree.
- Arnaldo
[root@zoo ~]# perf record --per-thread -e intel_bts// usleep 1 [ perf record: Woken up 1 times to write data ]
[ perf record: Captured and wrote 1.884 MB perf.data ] [root@zoo ~]# perf evlist
intel_bts//
dummy:u
[root@zoo ~]# perf evlist -v
intel_bts//: type: 6, size: 112, {sample_period,sample_freq}: 1,sample_type: IP|TID|IDENTIFIER,read_format: ID, disabled: 1,enable_on_exec: 1,sample_id_all: 1,exclude_guest: 1 dummy:u: type: 1, size: 112, config:0x9, {sample_period,sample_freq}: 1,sample_type: IP|TID|IDENTIFIER,read_format: ID, disabled: 1,exclude_kernel: 1,exclude_hv: 1, mmap: 1, comm: 1,enable_on_exec: 1,
task: 1,sample_id_all: 1, mmap2: 1,comm_exec: 1
[root@zoo ~]#Warning:
81649 instruction trace errors
# To display the perf.data header info, please use --header/--header-only options. #
#
# Total Lost Samples: 0
#
# Samples: 0 of event 'intel_bts//'
# Event count (approx.): 0
## Overhead Command Shared Object Symbol # ........ ....... ............. ......#
# Samples: 0 of event 'dummy:u'
# Event count (approx.): 0
## Overhead Command Shared Object Symbol # ........ ....... ............. ......#
# Samples: 81K of event 'branches'
# Event count (approx.): 81649
#
Quoted 14 lines
# Overhead  Command  Shared Object     Symbol
# ........  .......  ................  ......................
#
      2.71%  usleep   [unknown]         [.] 0x00007fa0ff695061
      2.62%  usleep   [unknown]         [.] 0x00007fa0ffb3de7e
      1.96%  usleep   [unknown]         [.] 0x00007fa0ffb2e726
      1.92%  usleep   [unknown]         [.] 0x00007fa0ff695086
      1.60%  usleep   [unknown]         [.] 0xffffffff811c91d0
      1.48%  usleep   [unknown]         [.] 0x00007fa0ffb3030d
      1.24%  usleep   [unknown]         [.] 0x00007fa0ff6950c7
It is very weird that it doesn't know the dso.
I presume there is nothing unusual about the environment e.g. in a chroot or anything
What if you try a different event e.g. perf record --per-thread -e cycles sleep 1
Arnaldo Carvalho de Melo
maintainerRe: [PATCH V8 08/25] perf tools: Add Intel BTS support
Em Mon, Aug 17, 2015 at 08:43:09PM +0300, Adrian Hunter escreveu:
Quoted 11 lines · Arnaldo Carvalho de Melo
Quoted 4 lines
     1.92%  usleep   [unknown]         [.] 0x00007fa0ff695086
     1.60%  usleep   [unknown]         [.] 0xffffffff811c91d0
     1.48%  usleep   [unknown]         [.] 0x00007fa0ffb3030d
     1.24%  usleep   [unknown]         [.] 0x00007fa0ff6950c7
It is very weird that it doesn't know the dso.
I presume there is nothing unusual about the environment e.g. in a chroot or anything
What if you try a different event e.g. perf record --per-thread -e cycles sleep 1
[root@zoo ~]# perf record --per-thread -e cycles sleep 1 [ perf record: Woken up 1 times to write data ]
[ perf record: Captured and wrote 0.014 MB perf.data (9 samples) ]
[root@zoo ~]# perf report | grep -v ^# | head -5
    42.57%  sleep    libc-2.20.so      [.] malloc_hook_ini
    41.81%  sleep    [kernel.vmlinux]  [k] filemap_fault
    14.35%  sleep    [kernel.vmlinux]  [k] flush_tlb_mm_range
     1.18%  sleep    [kernel.vmlinux]  [k] strlcpy
     0.09%  sleep    [kernel.vmlinux]  [k] native_write_msr_safe
[root@zoo ~]#
[root@zoo ~]# perf report --dsos libc-2.20.so | grep -v '^[#]'
42.57% sleep [.] malloc_hook_ini
[root@zoo ~]#
[root@zoo ~]# perf record --per-thread -e intel_bts// usleep 1 [ perf record: Woken up 1 times to write data ]
[ perf record: Captured and wrote 1.825 MB perf.data ] [root@zoo ~]# perf report | grep -v ^# | head -5 Warning:
79074 instruction trace errors
2.80% usleep [unknown] [.] 0x00007f48888aa061
[root@zoo ~]#
- Arnaldo
Adrian Hunter
reviewerRe: [PATCH V8 08/25] perf tools: Add Intel BTS support
Quoted 40 lines · Arnaldo Carvalho de Melo
Em Mon, Aug 17, 2015 at 08:43:09PM +0300, Adrian Hunter escreveu:
Quoted 11 lines · Arnaldo Carvalho de Melo
Quoted 4 lines
      1.92%  usleep   [unknown]         [.] 0x00007fa0ff695086
      1.60%  usleep   [unknown]         [.] 0xffffffff811c91d0
      1.48%  usleep   [unknown]         [.] 0x00007fa0ffb3030d
      1.24%  usleep   [unknown]         [.] 0x00007fa0ff6950c7
It is very weird that it doesn't know the dso.
I presume there is nothing unusual about the environment e.g. in a chroot or anything
What if you try a different event e.g. perf record --per-thread -e cycles sleep 1
[root@zoo ~]# perf record --per-thread -e cycles sleep 1 [ perf record: Woken up 1 times to write data ]
[ perf record: Captured and wrote 0.014 MB perf.data (9 samples) ] [root@zoo ~]# perf report | grep -v ^# | head -542.57% sleep libc-2.20.so [.] malloc_hook_ini 41.81% sleep [kernel.vmlinux] [k] filemap_fault 14.35% sleep [kernel.vmlinux] [k] flush_tlb_mm_range 1.18% sleep [kernel.vmlinux] [k] strlcpy 0.09% sleep [kernel.vmlinux] [k] native_write_msr_safe[root@zoo ~]#
[root@zoo ~]# perf report --dsos libc-2.20.so | grep -v '^[#]'
42.57% sleep [.] malloc_hook_ini[root@zoo ~]#
[root@zoo ~]# perf record --per-thread -e intel_bts// usleep 1 [ perf record: Woken up 1 times to write data ]
[ perf record: Captured and wrote 1.825 MB perf.data ] [root@zoo ~]# perf report | grep -v ^# | head -5 Warning:
79074 instruction trace errors
Quoted 2 lines
2.80% usleep [unknown] [.] 0x00007f48888aa061[root@zoo ~]#
Running out of ideas. Can you somehow share or send me the offending perf.data file?
Arnaldo Carvalho de Melo
maintainerRe: [PATCH V8 08/25] perf tools: Add Intel BTS support
Em Mon, Aug 17, 2015 at 10:09:26PM +0300, Adrian Hunter escreveu:
Quoted 39 lines · Arnaldo Carvalho de Melo
Quoted 29 lines
Em Mon, Aug 17, 2015 at 08:43:09PM +0300, Adrian Hunter escreveu:
Quoted 11 lines · Arnaldo Carvalho de Melo
Quoted 4 lines
     1.92%  usleep   [unknown]         [.] 0x00007fa0ff695086
     1.60%  usleep   [unknown]         [.] 0xffffffff811c91d0
     1.48%  usleep   [unknown]         [.] 0x00007fa0ffb3030d
     1.24%  usleep   [unknown]         [.] 0x00007fa0ff6950c7
It is very weird that it doesn't know the dso.
I presume there is nothing unusual about the environment e.g. in a chroot or anything
What if you try a different event e.g. perf record --per-thread -e cycles sleep 1
[root@zoo ~]# perf record --per-thread -e cycles sleep 1 [ perf record: Woken up 1 times to write data ]
[ perf record: Captured and wrote 0.014 MB perf.data (9 samples) ][root@zoo ~]# perf report | grep -v ^# | head -5 42.57% sleep libc-2.20.so [.] malloc_hook_ini 41.81% sleep [kernel.vmlinux] [k] filemap_fault 14.35% sleep [kernel.vmlinux] [k] flush_tlb_mm_range 1.18% sleep [kernel.vmlinux] [k] strlcpy 0.09% sleep [kernel.vmlinux] [k] native_write_msr_safe[root@zoo ~]#
[root@zoo ~]# perf report --dsos libc-2.20.so | grep -v '^[#]'
42.57% sleep [.] malloc_hook_ini[root@zoo ~]#
Quoted 8 lines
[root@zoo ~]# perf record --per-thread -e intel_bts// usleep 1 [ perf record: Woken up 1 times to write data ]
[ perf record: Captured and wrote 1.825 MB perf.data ] [root@zoo ~]# perf report | grep -v ^# | head -5 Warning:
79074 instruction trace errors2.80% usleep [unknown] [.] 0x00007f48888aa061[root@zoo ~]#
Quoted 1 line
Running out of ideas. Can you somehow share or send me the offending perf.data file?
http://vger.kernel.org/~acme/perf/perf.data.intel_bts-4.2.0-rc5+.xz
It works if I use a tip/master kernel:
[root@perf4 ~]# uname -r
4.2.0-rc7+
[root@perf4 ~]# uname -r
4.2.0-rc7+
[root@perf4 ~]# perf record --per-thread -e intel_bts// usleep 1 [ perf record: Woken up 1 times to write data ]
[ perf record: Captured and wrote 1.785 MB perf.data ] [root@perf4 ~]# dmesg | grep Performance
[ 0.188477] Performance Events: PEBS fmt2+, 16-deep LBR, Broadwell
events, full-width counters, Intel PMU driver. [root@perf4 ~]# perf report --stdio | grep -v ^# | head -10
    10.81%  usleep   libc-2.17.so       [.] _dl_addr
     6.56%  usleep   [kernel.kallsyms]  [.] unmap_single_vma
     3.33%  usleep   ld-2.17.so         [.] strcmp
     2.53%  usleep   [kernel.kallsyms]  [.] mem_cgroup_begin_page_stat
     2.49%  usleep   ld-2.17.so         [.] _dl_lookup_symbol_x
     2.39%  usleep   ld-2.17.so         [.] _dl_relocate_object
[root@perf4 ~]#
Probably some fix for the kernel driver is missing?
- Arnaldo
Adrian Hunter
reviewerRe: [PATCH V8 08/25] perf tools: Add Intel BTS support
Quoted 40 lines · Arnaldo Carvalho de Melo
Em Mon, Aug 17, 2015 at 10:09:26PM +0300, Adrian Hunter escreveu:
Quoted 39 lines · Arnaldo Carvalho de Melo
Quoted 37 lines
Em Mon, Aug 17, 2015 at 08:43:09PM +0300, Adrian Hunter escreveu:
Quoted 11 lines · Arnaldo Carvalho de Melo
Quoted 4 lines
     1.92%  usleep   [unknown]         [.] 0x00007fa0ff695086
     1.60%  usleep   [unknown]         [.] 0xffffffff811c91d0
     1.48%  usleep   [unknown]         [.] 0x00007fa0ffb3030d
     1.24%  usleep   [unknown]         [.] 0x00007fa0ff6950c7
It is very weird that it doesn't know the dso.
I presume there is nothing unusual about the environment e.g. in a chroot or anything
What if you try a different event e.g. perf record --per-thread -e cycles sleep 1
[root@zoo ~]# perf record --per-thread -e cycles sleep 1 [ perf record: Woken up 1 times to write data ]
[ perf record: Captured and wrote 0.014 MB perf.data (9 samples) ][root@zoo ~]# perf report | grep -v ^# | head -5 42.57% sleep libc-2.20.so [.] malloc_hook_ini 41.81% sleep [kernel.vmlinux] [k] filemap_fault 14.35% sleep [kernel.vmlinux] [k] flush_tlb_mm_range 1.18% sleep [kernel.vmlinux] [k] strlcpy 0.09% sleep [kernel.vmlinux] [k] native_write_msr_safe[root@zoo ~]#
[root@zoo ~]# perf report --dsos libc-2.20.so | grep -v '^[#]'
42.57% sleep [.] malloc_hook_ini[root@zoo ~]#
[root@zoo ~]# perf record --per-thread -e intel_bts// usleep 1 [ perf record: Woken up 1 times to write data ]
[ perf record: Captured and wrote 1.825 MB perf.data ] [root@zoo ~]# perf report | grep -v ^# | head -5 Warning:
79074 instruction trace errors2.80% usleep [unknown] [.] 0x00007f48888aa061[root@zoo ~]#
Quoted 3 lines
Quoted 1 line
Running out of ideas. Can you somehow share or send me the offending perf.data file?
http://vger.kernel.org/~acme/perf/perf.data.intel_bts-4.2.0-rc5+.xz
Says: You don't have permission to access /~acme/perf/perf.data.intel_bts-4.2.0-rc5+.xz on this server.
Quoted 24 lines
It works if I use a tip/master kernel:
[root@perf4 ~]# uname -r
4.2.0-rc7+
[root@perf4 ~]# uname -r
4.2.0-rc7+
[root@perf4 ~]# perf record --per-thread -e intel_bts// usleep 1 [ perf record: Woken up 1 times to write data ]
[ perf record: Captured and wrote 1.785 MB perf.data ] [root@perf4 ~]# dmesg | grep Performance[ 0.188477] Performance Events: PEBS fmt2+, 16-deep LBR, Broadwellevents, full-width counters, Intel PMU driver. [root@perf4 ~]# perf report --stdio | grep -v ^# | head -10
    10.81%  usleep   libc-2.17.so       [.] _dl_addr
     6.56%  usleep   [kernel.kallsyms]  [.] unmap_single_vma
     3.33%  usleep   ld-2.17.so         [.] strcmp
     2.53%  usleep   [kernel.kallsyms]  [.] mem_cgroup_begin_page_stat
     2.49%  usleep   ld-2.17.so         [.] _dl_lookup_symbol_x
     2.39%  usleep   ld-2.17.so         [.] _dl_relocate_object
Quoted 3 lines
[root@perf4 ~]#
Probably some fix for the kernel driver is missing?
Works for me though.
Adrian Hunter
reviewerRe: [PATCH V8 08/25] perf tools: Add Intel BTS support
Quoted 74 lines · Adrian Hunter
Quoted 40 lines · Arnaldo Carvalho de Melo
Em Mon, Aug 17, 2015 at 10:09:26PM +0300, Adrian Hunter escreveu:
Quoted 39 lines · Arnaldo Carvalho de Melo
Quoted 37 lines
Em Mon, Aug 17, 2015 at 08:43:09PM +0300, Adrian Hunter escreveu:
Quoted 11 lines · Arnaldo Carvalho de Melo
Quoted 4 lines
     1.92%  usleep   [unknown]         [.] 0x00007fa0ff695086
     1.60%  usleep   [unknown]         [.] 0xffffffff811c91d0
     1.48%  usleep   [unknown]         [.] 0x00007fa0ffb3030d
     1.24%  usleep   [unknown]         [.] 0x00007fa0ff6950c7
It is very weird that it doesn't know the dso.
I presume there is nothing unusual about the environment e.g. in a chroot or anything
What if you try a different event e.g. perf record --per-thread -e cycles sleep 1
[root@zoo ~]# perf record --per-thread -e cycles sleep 1 [ perf record: Woken up 1 times to write data ]
[ perf record: Captured and wrote 0.014 MB perf.data (9 samples) ][root@zoo ~]# perf report | grep -v ^# | head -5 42.57% sleep libc-2.20.so [.] malloc_hook_ini 41.81% sleep [kernel.vmlinux] [k] filemap_fault 14.35% sleep [kernel.vmlinux] [k] flush_tlb_mm_range 1.18% sleep [kernel.vmlinux] [k] strlcpy 0.09% sleep [kernel.vmlinux] [k] native_write_msr_safe[root@zoo ~]#
[root@zoo ~]# perf report --dsos libc-2.20.so | grep -v '^[#]'
42.57% sleep [.] malloc_hook_ini[root@zoo ~]#
[root@zoo ~]# perf record --per-thread -e intel_bts// usleep 1 [ perf record: Woken up 1 times to write data ]
[ perf record: Captured and wrote 1.825 MB perf.data ] [root@zoo ~]# perf report | grep -v ^# | head -5 Warning:
79074 instruction trace errors2.80% usleep [unknown] [.] 0x00007f48888aa061[root@zoo ~]#
Quoted 3 lines
Quoted 1 line
Running out of ideas. Can you somehow share or send me the offending perf.data file?
http://vger.kernel.org/~acme/perf/perf.data.intel_bts-4.2.0-rc5+.xz
Says: You don't have permission to access /~acme/perf/perf.data.intel_bts-4.2.0-rc5+.xz on this server.
Quoted 26 lines
It works if I use a tip/master kernel:
[root@perf4 ~]# uname -r
4.2.0-rc7+
[root@perf4 ~]# uname -r
4.2.0-rc7+
[root@perf4 ~]# perf record --per-thread -e intel_bts// usleep 1 [ perf record: Woken up 1 times to write data ]
[ perf record: Captured and wrote 1.785 MB perf.data ] [root@perf4 ~]# dmesg | grep Performance[ 0.188477] Performance Events: PEBS fmt2+, 16-deep LBR, Broadwellevents, full-width counters, Intel PMU driver. [root@perf4 ~]# perf report --stdio | grep -v ^# | head -10
    10.81%  usleep   libc-2.17.so       [.] _dl_addr
     6.56%  usleep   [kernel.kallsyms]  [.] unmap_single_vma
     3.33%  usleep   ld-2.17.so         [.] strcmp
     2.53%  usleep   [kernel.kallsyms]  [.] mem_cgroup_begin_page_stat
     2.49%  usleep   ld-2.17.so         [.] _dl_lookup_symbol_x
     2.39%  usleep   ld-2.17.so         [.] _dl_relocate_object
[root@perf4 ~]#
Quoted 3 lines
Quoted 1 line
Probably some fix for the kernel driver is missing?
Works for me though.
I looked at the code and noticed a minor issue, but I don't think it is the cause of the problem. I sent a fix - see "perf tools: Fix use of wrong event when processing exit events"
Arnaldo Carvalho de Melo
maintainerRe: [PATCH V8 08/25] perf tools: Add Intel BTS support
In reply to Adrian HunterEm Tue, Aug 18, 2015 at 09:39:46AM +0300, Adrian Hunter escreveu:
Quoted 41 lines · Arnaldo Carvalho de Melo
Quoted 40 lines
Em Mon, Aug 17, 2015 at 10:09:26PM +0300, Adrian Hunter escreveu:
Quoted 39 lines · Arnaldo Carvalho de Melo
Quoted 37 lines
Em Mon, Aug 17, 2015 at 08:43:09PM +0300, Adrian Hunter escreveu:
Quoted 11 lines · Arnaldo Carvalho de Melo
Quoted 4 lines
     1.92%  usleep   [unknown]         [.] 0x00007fa0ff695086
     1.60%  usleep   [unknown]         [.] 0xffffffff811c91d0
     1.48%  usleep   [unknown]         [.] 0x00007fa0ffb3030d
     1.24%  usleep   [unknown]         [.] 0x00007fa0ff6950c7
It is very weird that it doesn't know the dso.
I presume there is nothing unusual about the environment e.g. in a chroot or anything
What if you try a different event e.g. perf record --per-thread -e cycles sleep 1
[root@zoo ~]# perf record --per-thread -e cycles sleep 1 [ perf record: Woken up 1 times to write data ]
[ perf record: Captured and wrote 0.014 MB perf.data (9 samples) ][root@zoo ~]# perf report | grep -v ^# | head -5 42.57% sleep libc-2.20.so [.] malloc_hook_ini 41.81% sleep [kernel.vmlinux] [k] filemap_fault 14.35% sleep [kernel.vmlinux] [k] flush_tlb_mm_range 1.18% sleep [kernel.vmlinux] [k] strlcpy 0.09% sleep [kernel.vmlinux] [k] native_write_msr_safe[root@zoo ~]#
[root@zoo ~]# perf report --dsos libc-2.20.so | grep -v '^[#]'
42.57% sleep [.] malloc_hook_ini[root@zoo ~]#
[root@zoo ~]# perf record --per-thread -e intel_bts// usleep 1 [ perf record: Woken up 1 times to write data ]
[ perf record: Captured and wrote 1.825 MB perf.data ] [root@zoo ~]# perf report | grep -v ^# | head -5 Warning:
79074 instruction trace errors2.80% usleep [unknown] [.] 0x00007f48888aa061[root@zoo ~]#
Quoted 6 lines
Quoted 3 lines
Quoted 1 line
Running out of ideas. Can you somehow share or send me the offending perf.data file?
http://vger.kernel.org/~acme/perf/perf.data.intel_bts-4.2.0-rc5+.xz
Says: You don't have permission to access /~acme/perf/perf.data.intel_bts-4.2.0-rc5+.xz on this server.
Ooops, fixed.
Quoted 25 lines
Quoted 25 lines
It works if I use a tip/master kernel:
[root@perf4 ~]# uname -r
4.2.0-rc7+
[root@perf4 ~]# uname -r
4.2.0-rc7+
[root@perf4 ~]# perf record --per-thread -e intel_bts// usleep 1 [ perf record: Woken up 1 times to write data ]
[ perf record: Captured and wrote 1.785 MB perf.data ] [root@perf4 ~]# dmesg | grep Performance[ 0.188477] Performance Events: PEBS fmt2+, 16-deep LBR, Broadwellevents, full-width counters, Intel PMU driver. [root@perf4 ~]# perf report --stdio | grep -v ^# | head -10
    10.81%  usleep   libc-2.17.so       [.] _dl_addr
     6.56%  usleep   [kernel.kallsyms]  [.] unmap_single_vma
     3.33%  usleep   ld-2.17.so         [.] strcmp
     2.53%  usleep   [kernel.kallsyms]  [.] mem_cgroup_begin_page_stat
     2.49%  usleep   ld-2.17.so         [.] _dl_lookup_symbol_x
     2.39%  usleep   ld-2.17.so         [.] _dl_relocate_object
[root@perf4 ~]#
Quoted 3 lines
Quoted 1 line
Probably some fix for the kernel driver is missing?
Works for me though.
Works for you if you test in lockstep the tooling with the kernel sources, right? It works for me as well, if I use the latest tip/master tooling _and_ kernel, my report was for using the 4.2.0-rc latest for the kernel and the tooling in tip/master.
I think this would be just a matter of having a better message, or perhaps some fix that we need to send to the [email protected] guys, so that the new tooling works with a slightly older kernel.
Anyway, consider looking at that perf.data file that I fixed the permissions on vger, and I will look at the fix you mentioned in another message.
- Arnaldo
Adrian Hunter
reviewerRe: [PATCH V8 08/25] perf tools: Add Intel BTS support
Quoted 85 lines · Arnaldo Carvalho de Melo
Em Tue, Aug 18, 2015 at 09:39:46AM +0300, Adrian Hunter escreveu:
Quoted 41 lines · Arnaldo Carvalho de Melo
Quoted 40 lines
Em Mon, Aug 17, 2015 at 10:09:26PM +0300, Adrian Hunter escreveu:
Quoted 39 lines · Arnaldo Carvalho de Melo
Quoted 37 lines
Em Mon, Aug 17, 2015 at 08:43:09PM +0300, Adrian Hunter escreveu:
Quoted 11 lines · Arnaldo Carvalho de Melo
Quoted 4 lines
     1.92%  usleep   [unknown]         [.] 0x00007fa0ff695086
     1.60%  usleep   [unknown]         [.] 0xffffffff811c91d0
     1.48%  usleep   [unknown]         [.] 0x00007fa0ffb3030d
     1.24%  usleep   [unknown]         [.] 0x00007fa0ff6950c7
It is very weird that it doesn't know the dso.
I presume there is nothing unusual about the environment e.g. in a chroot or anything
What if you try a different event e.g. perf record --per-thread -e cycles sleep 1
[root@zoo ~]# perf record --per-thread -e cycles sleep 1 [ perf record: Woken up 1 times to write data ]
[ perf record: Captured and wrote 0.014 MB perf.data (9 samples) ][root@zoo ~]# perf report | grep -v ^# | head -5 42.57% sleep libc-2.20.so [.] malloc_hook_ini 41.81% sleep [kernel.vmlinux] [k] filemap_fault 14.35% sleep [kernel.vmlinux] [k] flush_tlb_mm_range 1.18% sleep [kernel.vmlinux] [k] strlcpy 0.09% sleep [kernel.vmlinux] [k] native_write_msr_safe[root@zoo ~]#
[root@zoo ~]# perf report --dsos libc-2.20.so | grep -v '^[#]'
42.57% sleep [.] malloc_hook_ini[root@zoo ~]#
[root@zoo ~]# perf record --per-thread -e intel_bts// usleep 1 [ perf record: Woken up 1 times to write data ]
[ perf record: Captured and wrote 1.825 MB perf.data ] [root@zoo ~]# perf report | grep -v ^# | head -5 Warning:
79074 instruction trace errors2.80% usleep [unknown] [.] 0x00007f48888aa061[root@zoo ~]#
Quoted 6 lines
Quoted 3 lines
Quoted 1 line
Running out of ideas. Can you somehow share or send me the offending perf.data file?
http://vger.kernel.org/~acme/perf/perf.data.intel_bts-4.2.0-rc5+.xz
Says: You don't have permission to access /~acme/perf/perf.data.intel_bts-4.2.0-rc5+.xz on this server.
Ooops, fixed.
Quoted 25 lines
Quoted 25 lines
It works if I use a tip/master kernel:
[root@perf4 ~]# uname -r
4.2.0-rc7+
[root@perf4 ~]# uname -r
4.2.0-rc7+
[root@perf4 ~]# perf record --per-thread -e intel_bts// usleep 1 [ perf record: Woken up 1 times to write data ]
[ perf record: Captured and wrote 1.785 MB perf.data ] [root@perf4 ~]# dmesg | grep Performance[ 0.188477] Performance Events: PEBS fmt2+, 16-deep LBR, Broadwellevents, full-width counters, Intel PMU driver. [root@perf4 ~]# perf report --stdio | grep -v ^# | head -10
    10.81%  usleep   libc-2.17.so       [.] _dl_addr
     6.56%  usleep   [kernel.kallsyms]  [.] unmap_single_vma
     3.33%  usleep   ld-2.17.so         [.] strcmp
     2.53%  usleep   [kernel.kallsyms]  [.] mem_cgroup_begin_page_stat
     2.49%  usleep   ld-2.17.so         [.] _dl_lookup_symbol_x
     2.39%  usleep   ld-2.17.so         [.] _dl_relocate_object
[root@perf4 ~]#
Quoted 3 lines
Quoted 1 line
Probably some fix for the kernel driver is missing?
Works for me though.
Works for you if you test in lockstep the tooling with the kernel sources, right? It works for me as well, if I use the latest tip/master tooling _and_ kernel, my report was for using the 4.2.0-rc latest for the kernel and the tooling in tip/master.
Quoted 7 lines
I think this would be just a matter of having a better message, or perhaps some fix that we need to send to the [email protected] guys, so that the new tooling works with a slightly older kernel.
Anyway, consider looking at that perf.data file that I fixed the permissions on vger, and I will look at the fix you mentioned in another message.
With your perf.data file I was able to find the problem. I have sent patch "perf tools: Fix Intel BTS/PT timestamp handling" to fix it.
Arnaldo Carvalho de Melo
maintainerRe: [PATCH V8 08/25] perf tools: Add Intel BTS support
Em Thu, Aug 20, 2015 at 11:53:45AM +0300, Adrian Hunter escreveu:
Quoted 10 lines · Arnaldo Carvalho de Melo
Quoted 9 lines
Works for you if you test in lockstep the tooling with the kernel sources, right? It works for me as well, if I use the latest tip/master tooling _and_ kernel, my report was for using the 4.2.0-rc latest for the kernel and the tooling in tip/master.
I think this would be just a matter of having a better message, or perhaps some fix that we need to send to the [email protected] guys, so that the new tooling works with a slightly older kernel.
Quoted 6 lines
Quoted 3 lines
Anyway, consider looking at that perf.data file that I fixed the permissions on vger, and I will look at the fix you mentioned in another message.
With your perf.data file I was able to find the problem. I have sent patch "perf tools: Fix Intel BTS/PT timestamp handling" to fix it.
Great, I just tested, without the patch it works in a machine with a new kernel, with an older kernel, where it was failing, after I apply this patch it works.
Thanks,
- Arnaldo
tip-bot for Adrian Hunter
merge bot[tip:perf/core] perf tools: Add Intel BTS support
In reply to Adrian Hunterperf tools: Add Intel BTS support
Commit-ID:  d0170af7004dce9cd90b749842c37e379476cbc8
Gitweb:     http://git.kernel.org/tip/d0170af7004dce9cd90b749842c37e379476cbc8
Author:     Adrian Hunter <[email protected]>
AuthorDate: Fri, 17 Jul 2015 19:33:43 +0300
Committer:  Arnaldo Carvalho de Melo <[email protected]>
CommitDate: Fri, 21 Aug 2015 11:34:10 -0300
perf tools: Add Intel BTS support
Intel BTS support fits within the new auxtrace infrastructure. Recording is supporting by identifying the Intel BTS PMU, parsing options and setting up events.
Decoding is supported by queuing up trace data by thread and then decoding synchronously delivering synthesized event samples into the session processing for tools to consume.
Committer note:
E.g:
[root@felicio ~]# perf record --per-thread -e intel_bts// ls
anaconda-ks.cfg apctest.output bin kernel-rt-3.10.0-298.rt56.171.el7.x86_64.rpm libexec lock_page.bpf.c perf.data perf.data.old
[ perf record: Woken up 3 times to write data ]
[ perf record: Captured and wrote 4.367 MB perf.data ]
[root@felicio ~]# perf evlist -v
intel_bts//: type: 6, size: 112, { sample_period, sample_freq }: 1, sample_type: IP|TID|IDENTIFIER, read_format: ID, disabled: 1, enable_on_exec: 1, sample_id_all: 1, exclude_guest: 1
dummy:u: type: 1, size: 112, config: 0x9, { sample_period, sample_freq }: 1, sample_type: IP|TID|IDENTIFIER, read_format: ID, disabled: 1, exclude_kernel: 1, exclude_hv: 1, mmap: 1, comm: 1, enable_on_exec: 1, task: 1, sample_id_all: 1, mmap2: 1, comm_exec: 1 [root@felicio ~]# perf script # the navigate in the pager to some interesting place:
    ls 1843 1 branches: ffffffff810a60cb flush_signal_handlers ([kernel.kallsyms]) => ffffffff8121a522 setup_new_exec ([kernel.kallsyms])
    ls 1843 1 branches: ffffffff8121a529 setup_new_exec ([kernel.kallsyms]) => ffffffff8122fa30 do_close_on_exec ([kernel.kallsyms])
    ls 1843 1 branches: ffffffff8122fa5d do_close_on_exec ([kernel.kallsyms]) => ffffffff81767ae0 _raw_spin_lock ([kernel.kallsyms])
    ls 1843 1 branches: ffffffff81767af4 _raw_spin_lock ([kernel.kallsyms]) => ffffffff8122fa62 do_close_on_exec ([kernel.kallsyms])
    ls 1843 1 branches: ffffffff8122fa8e do_close_on_exec ([kernel.kallsyms]) => ffffffff8122faf0 do_close_on_exec ([kernel.kallsyms])
    ls 1843 1 branches: ffffffff8122faf7 do_close_on_exec ([kernel.kallsyms]) => ffffffff8122fa8b do_close_on_exec ([kernel.kallsyms])
    ls 1843 1 branches: ffffffff8122fa8e do_close_on_exec ([kernel.kallsyms]) => ffffffff8122faf0 do_close_on_exec ([kernel.kallsyms])
    ls 1843 1 branches: ffffffff8122faf7 do_close_on_exec ([kernel.kallsyms]) => ffffffff8122fa8b do_close_on_exec ([kernel.kallsyms])
    ls 1843 1 branches: ffffffff8122fa8e do_close_on_exec ([kernel.kallsyms]) => ffffffff8122faf0 do_close_on_exec ([kernel.kallsyms])
    ls 1843 1 branches: ffffffff8122faf7 do_close_on_exec ([kernel.kallsyms]) => ffffffff8122fa8b do_close_on_exec ([kernel.kallsyms])
    ls 1843 1 branches: ffffffff8122fa8e do_close_on_exec ([kernel.kallsyms]) => ffffffff8122faf0 do_close_on_exec ([kernel.kallsyms])
    ls 1843 1 branches: ffffffff8122faf7 do_close_on_exec ([kernel.kallsyms]) => ffffffff8122fa8b do_close_on_exec ([kernel.kallsyms])
    ls 1843 1 branches: ffffffff8122fa8e do_close_on_exec ([kernel.kallsyms]) => ffffffff8122faf0 do_close_on_exec ([kernel.kallsyms])
    ls 1843 1 branches: ffffffff8122faf7 do_close_on_exec ([kernel.kallsyms]) => ffffffff8122fa8b do_close_on_exec ([kernel.kallsyms])
    ls 1843 1 branches: ffffffff8122fa8e do_close_on_exec ([kernel.kallsyms]) => ffffffff8122faf0 do_close_on_exec ([kernel.kallsyms])
    ls 1843 1 branches: ffffffff8122faf7 do_close_on_exec ([kernel.kallsyms]) => ffffffff8122fa8b do_close_on_exec ([kernel.kallsyms])
    ls 1843 1 branches: ffffffff8122fac9 do_close_on_exec ([kernel.kallsyms]) => ffffffff8122fad2 do_close_on_exec ([kernel.kallsyms])
    ls 1843 1 branches: ffffffff8122fadd do_close_on_exec ([kernel.kallsyms]) => ffffffff8120fc80 filp_close ([kernel.kallsyms])
    ls 1843 1 branches: ffffffff8120fcaf filp_close ([kernel.kallsyms]) => ffffffff8120fcb6 filp_close ([kernel.kallsyms])
    ls 1843 1 branches: ffffffff8120fcc2 filp_close ([kernel.kallsyms]) => ffffffff812547f0 dnotify_flush ([kernel.kallsyms])
    ls 1843 1 branches: ffffffff81254823 dnotify_flush ([kernel.kallsyms]) => ffffffff8120fcc7 filp_close ([kernel.kallsyms])
    ls 1843 1 branches: ffffffff8120fccd filp_close ([kernel.kallsyms]) => ffffffff81261790 locks_remove_posix ([kernel.kallsyms])
    ls 1843 1 branches: ffffffff812617a3 locks_remove_posix ([kernel.kallsyms]) => ffffffff812617b9 locks_remove_posix ([kernel.kallsyms])
    ls 1843 1 branches: ffffffff812617b9 locks_remove_posix ([kernel.kallsyms]) => ffffffff8120fcd2 filp_close ([kernel.kallsyms])
    ls 1843 1 branches: ffffffff8120fcd5 filp_close ([kernel.kallsyms]) => ffffffff812142c0 fput ([kernel.kallsyms])
    ls 1843 1 branches: ffffffff812142d6 fput ([kernel.kallsyms]) => ffffffff812142df fput ([kernel.kallsyms])
    ls 1843 1 branches: ffffffff8121430c fput ([kernel.kallsyms]) => ffffffff810b6580 task_work_add ([kernel.kallsyms])
    ls 1843 1 branches: ffffffff810b65ad task_work_add ([kernel.kallsyms]) => ffffffff810b65b1 task_work_add ([kernel.kallsyms])
    ls 1843 1 branches: ffffffff810b65c1 task_work_add ([kernel.kallsyms]) => ffffffff810bc710 kick_process ([kernel.kallsyms])
    ls 1843 1 branches: ffffffff810bc725 kick_process ([kernel.kallsyms]) => ffffffff810bc742 kick_process ([kernel.kallsyms])
    ls 1843 1 branches: ffffffff810bc742 kick_process ([kernel.kallsyms]) => ffffffff810b65c6 task_work_add ([kernel.kallsyms])
ls 1843 1 branches: ffffffff810b65c9 task_work_add ([kernel.kallsyms]) => ffffffff81214311 fput ([kernel.kallsyms])--- tools/perf/Documentation/intel-bts.txt | 86 +++ tools/perf/arch/x86/util/Build | 1 + tools/perf/arch/x86/util/auxtrace.c | 49 +- tools/perf/arch/x86/util/intel-bts.c | 458 ++++++++++++++++ tools/perf/arch/x86/util/pmu.c | 3 + tools/perf/util/Build | 1 + tools/perf/util/auxtrace.c | 3 + tools/perf/util/auxtrace.h | 1 + tools/perf/util/intel-bts.c | 933 +++++++++++++++++++++++++++++++++ tools/perf/util/intel-bts.h | 43 ++ tools/perf/util/pmu.c | 4 - 11 files changed, 1576 insertions(+), 6 deletions(-)
tools/perf/Documentation/intel-bts.txt new file +86 -0
@@ -0,0 +1,86 @@ +Intel Branch Trace Store +======================== + +Overview +======== + +Intel BTS could be regarded as a predecessor to Intel PT and has some +similarities because it can also identify every branch a program takes. A +notable difference is that Intel BTS has no timing information and as a +consequence the present implementation is limited to per-thread recording. + +While decoding Intel BTS does not require walking the object code, the object +code is still needed to pair up calls and returns correctly, consequently much +of the Intel PT documentation applies also to Intel BTS. Refer to the Intel PT +documentation and consider that the PMU 'intel_bts' can usually be used in +place of 'intel_pt' in the examples provided, with the proviso that per-thread +recording must also be stipulated i.e. the --per-thread option for +'perf record'. + + +perf record +=========== + +new event +--------- + +The Intel BTS kernel driver creates a new PMU for Intel BTS. The perf record +option is: + + -e intel_bts// + +Currently Intel BTS is limited to per-thread tracing so the --per-thread option +is also needed. + + +snapshot option +--------------- + +The snapshot option is the same as Intel PT (refer Intel PT documentation). + + +auxtrace mmap size option +----------------------- + +The mmap size option is the same as Intel PT (refer Intel PT documentation). + + +perf script +=========== + +By default, perf script will decode trace data found in the perf.data file. +This can be further controlled by option --itrace. The --itrace option is +the same as Intel PT (refer Intel PT documentation) except that neither +"instructions" events nor "transactions" events (and consequently call +chains) are supported. + +To disable trace decoding entirely, use the option --no-itrace. + + +dump option +----------- + +perf script has an option (-D) to "dump" the events i.e. display the binary +data. + +When -D is used, Intel BTS packets are displayed. + +To disable the display of Intel BTS packets, combine the -D option with +--no-itrace. + + +perf report +=========== + +By default, perf report will decode trace data found in the perf.data file. +This can be further controlled by new option --itrace exactly the same as +perf script. + + +perf inject +=========== + +perf inject also accepts the --itrace option in which case tracing data is +removed and replaced with the synthesized events. e.g. + + perf inject --itrace -i perf.data -o perf.data.new
tools/perf/arch/x86/util/Build +1 -0
@@ -10,3 +10,4 @@ libperf-$(CONFIG_LIBDW_DWARF_UNWIND) += unwind-libdw.o libperf-$(CONFIG_AUXTRACE) += auxtrace.o libperf-$(CONFIG_AUXTRACE) += intel-pt.o +libperf-$(CONFIG_AUXTRACE) += intel-bts.o
tools/perf/arch/x86/util/auxtrace.c +47 -2
65 lines not on this page · raw message
tools/perf/arch/x86/util/intel-bts.c new file +458 -0
458 lines not on this page · raw message
tools/perf/arch/x86/util/pmu.c +3 -0
@@ -3,6 +3,7 @@#include <linux/perf_event.h> #include "../../util/intel-pt.h" +#include "../../util/intel-bts.h" #include "../../util/pmu.h" struct perf_event_attr *perf_pmu__get_default_config (struct perf_pmu *pmu__maybe_unused )
@@ -10,6 +11,8 @@ struct perf_event_attr *perf_pmu__get_default_config(struct perf_pmu *pmu __mayb#ifdef HAVE_AUXTRACE_SUPPORT if (!strcmp (pmu->name,INTEL_PT_PMU_NAME ))return intel_pt_pmu_default_config (pmu); +if (!strcmp (pmu->name,INTEL_BTS_PMU_NAME )) + pmu->selectable = true;#endif return NULL ; }
tools/perf/util/Build +1 -0
@@ -80,6 +80,7 @@ libperf-y += thread-stack.o libperf-$(CONFIG_AUXTRACE) += auxtrace.o libperf-$(CONFIG_AUXTRACE) += intel-pt-decoder/ libperf-$(CONFIG_AUXTRACE) += intel-pt.o +libperf-$(CONFIG_AUXTRACE) += intel-bts.o libperf-y += parse-branch-options.o libperf-$(CONFIG_LIBELF) += symbol-elf.o
tools/perf/util/auxtrace.c +3 -0
@@ -48,6 +48,7 @@#include "parse-options.h" #include "intel-pt.h" +#include "intel-bts.h" int auxtrace_mmap__mmap(struct auxtrace_mmap *mm, struct auxtrace_mmap_params *mp,
@@ -888,6 +889,8 @@ int perf_event__process_auxtrace_info(struct perf_tool *tool __maybe_unused,switch (type) {case PERF_AUXTRACE_INTEL_PT :return intel_pt_process_auxtrace_info (event, session); +case PERF_AUXTRACE_INTEL_BTS : +return intel_bts_process_auxtrace_info (event, session);case PERF_AUXTRACE_UNKNOWN :default :return -EINVAL ;
tools/perf/util/auxtrace.h +1 -0
@@ -40,6 +40,7 @@ struct events_stats;enum auxtrace_type {PERF_AUXTRACE_UNKNOWN ,PERF_AUXTRACE_INTEL_PT , +PERF_AUXTRACE_INTEL_BTS , };enum itrace_period_type {
tools/perf/util/intel-bts.c new file +933 -0
933 lines not on this page · raw message
tools/perf/util/intel-bts.h new file +43 -0
43 lines not on this page · raw message
tools/perf/util/pmu.c +0 -4
@@ -462,10 +462,6 @@ static struct perf_pmu *pmu_lookup(const char *name)LIST_HEAD (aliases);__u32 type; -/* No support for intel_bts so disallow it */ -if (!strcmp (name,"intel_bts" )) -return NULL ; -/* * The pmu data we store & need consists of the pmu * type value and format definitions. Load both right
Adrian Hunter
reviewerPATCH v8 9/25 perf tools: Put itrace options into an asciidoc include
In reply to Adrian Hunterperf script, report and inject all have the same itrace options. Put them into an asciidoc include file.
---
 tools/perf/Documentation/itrace.txt      | 22 ++++++++++++++++++++++
 tools/perf/Documentation/perf-inject.txt | 23 +----------------------
 tools/perf/Documentation/perf-report.txt | 23 +----------------------
 tools/perf/Documentation/perf-script.txt | 23 +----------------------
 4 files changed, 25 insertions(+), 66 deletions(-)
 create mode 100644 tools/perf/Documentation/itrace.txt
tools/perf/Documentation/itrace.txt new file +22 -0
@@ -0,0 +1,22 @@ + i synthesize instructions events + b synthesize branches events + c synthesize branches events (calls only) + r synthesize branches events (returns only) + x synthesize transactions events + e synthesize error events + d create a debug log + g synthesize a call chain (use with i or x) + + The default is all events i.e. the same as --itrace=ibxe + + In addition, the period (default 100000) for instructions events + can be specified in units of: + + i instructions + t ticks + ms milliseconds + us microseconds + ns nanoseconds (default) + + Also the call chain size (default 16, max. 1024) for instructions or + transactions events can be specified.
tools/perf/Documentation/perf-inject.txt +1 -22
@@ -48,28 +48,7 @@ OPTIONS Decode Instruction Tracing data, replacing it with synthesized events. Options are: - i synthesize instructions events - b synthesize branches events - c synthesize branches events (calls only) - r synthesize branches events (returns only) - x synthesize transactions events - e synthesize error events - d create a debug log - g synthesize a call chain (use with i or x) - - The default is all events i.e. the same as --itrace=ibxe - - In addition, the period (default 100000) for instructions events - can be specified in units of: - - i instructions - t ticks - ms milliseconds - us microseconds - ns nanoseconds (default) - - Also the call chain size (default 16, max. 1024) for instructions or - transactions events can be specified. +include::itrace.txt[] SEE ALSO --------
tools/perf/Documentation/perf-report.txt +1 -22
@@ -328,28 +328,7 @@ OPTIONS --itrace:: Options for decoding instruction tracing data. The options are: - i synthesize instructions events - b synthesize branches events - c synthesize branches events (calls only) - r synthesize branches events (returns only) - x synthesize transactions events - e synthesize error events - d create a debug log - g synthesize a call chain (use with i or x) - - The default is all events i.e. the same as --itrace=ibxe - - In addition, the period (default 100000) for instructions events - can be specified in units of: - - i instructions - t ticks - ms milliseconds - us microseconds - ns nanoseconds (default) - - Also the call chain size (default 16, max. 1024) for instructions or - transactions events can be specified. +include::itrace.txt[] To disable decoding entirely, use --no-itrace.
tools/perf/Documentation/perf-script.txt +1 -22
@@ -231,28 +231,7 @@ OPTIONS --itrace:: Options for decoding instruction tracing data. The options are: - i synthesize instructions events - b synthesize branches events - c synthesize branches events (calls only) - r synthesize branches events (returns only) - x synthesize transactions events - e synthesize error events - d create a debug log - g synthesize a call chain (use with i or x) - - The default is all events i.e. the same as --itrace=ibxe - - In addition, the period (default 100000) for instructions events - can be specified in units of: - - i instructions - t ticks - ms milliseconds - us microseconds - ns nanoseconds (default) - - Also the call chain size (default 16, max. 1024) for instructions or - transactions events can be specified. +include::itrace.txt[] To disable decoding entirely, use --no-itrace.
Signature · 1 line
1.9.1
tip-bot for Adrian Hunter
merge bot[tip:perf/core] perf tools: Put itrace options into an asciidoc include
perf tools: Put itrace options into an asciidoc include
Commit-ID:  60b88d8743892218f82048a3df624f5fc5460843
Gitweb:     http://git.kernel.org/tip/60b88d8743892218f82048a3df624f5fc5460843
Author:     Adrian Hunter <[email protected]>
AuthorDate: Fri, 17 Jul 2015 19:33:44 +0300
Committer:  Arnaldo Carvalho de Melo <[email protected]>
CommitDate: Fri, 21 Aug 2015 11:40:44 -0300
perf tools: Put itrace options into an asciidoc include
perf script, report and inject all have the same itrace options. Put them into an asciidoc include file.
---
 tools/perf/Documentation/itrace.txt      | 22 ++++++++++++++++++++++
 tools/perf/Documentation/perf-inject.txt | 23 +----------------------
 tools/perf/Documentation/perf-report.txt | 23 +----------------------
 tools/perf/Documentation/perf-script.txt | 23 +----------------------
 4 files changed, 25 insertions(+), 66 deletions(-)
tools/perf/Documentation/itrace.txt new file +22 -0
@@ -0,0 +1,22 @@ + i synthesize instructions events + b synthesize branches events + c synthesize branches events (calls only) + r synthesize branches events (returns only) + x synthesize transactions events + e synthesize error events + d create a debug log + g synthesize a call chain (use with i or x) + + The default is all events i.e. the same as --itrace=ibxe + + In addition, the period (default 100000) for instructions events + can be specified in units of: + + i instructions + t ticks + ms milliseconds + us microseconds + ns nanoseconds (default) + + Also the call chain size (default 16, max. 1024) for instructions or + transactions events can be specified.
tools/perf/Documentation/perf-inject.txt +1 -22
@@ -48,28 +48,7 @@ OPTIONS Decode Instruction Tracing data, replacing it with synthesized events. Options are: - i synthesize instructions events - b synthesize branches events - c synthesize branches events (calls only) - r synthesize branches events (returns only) - x synthesize transactions events - e synthesize error events - d create a debug log - g synthesize a call chain (use with i or x) - - The default is all events i.e. the same as --itrace=ibxe - - In addition, the period (default 100000) for instructions events - can be specified in units of: - - i instructions - t ticks - ms milliseconds - us microseconds - ns nanoseconds (default) - - Also the call chain size (default 16, max. 1024) for instructions or - transactions events can be specified. +include::itrace.txt[] SEE ALSO --------
tools/perf/Documentation/perf-report.txt +1 -22
@@ -331,28 +331,7 @@ OPTIONS --itrace:: Options for decoding instruction tracing data. The options are: - i synthesize instructions events - b synthesize branches events - c synthesize branches events (calls only) - r synthesize branches events (returns only) - x synthesize transactions events - e synthesize error events - d create a debug log - g synthesize a call chain (use with i or x) - - The default is all events i.e. the same as --itrace=ibxe - - In addition, the period (default 100000) for instructions events - can be specified in units of: - - i instructions - t ticks - ms milliseconds - us microseconds - ns nanoseconds (default) - - Also the call chain size (default 16, max. 1024) for instructions or - transactions events can be specified. +include::itrace.txt[] To disable decoding entirely, use --no-itrace.
tools/perf/Documentation/perf-script.txt +1 -22
@@ -235,28 +235,7 @@ OPTIONS --itrace:: Options for decoding instruction tracing data. The options are: - i synthesize instructions events - b synthesize branches events - c synthesize branches events (calls only) - r synthesize branches events (returns only) - x synthesize transactions events - e synthesize error events - d create a debug log - g synthesize a call chain (use with i or x) - - The default is all events i.e. the same as --itrace=ibxe - - In addition, the period (default 100000) for instructions events - can be specified in units of: - - i instructions - t ticks - ms milliseconds - us microseconds - ns nanoseconds (default) - - Also the call chain size (default 16, max. 1024) for instructions or - transactions events can be specified. +include::itrace.txt[] To disable decoding entirely, use --no-itrace.
Adrian Hunter
reviewerPATCH v8 10/25 perf tools: Add example call-graph script
In reply to Adrian HunterAdd a script to produce a call-graph from data exported to a postgresql database and derived from a processor trace event like intel_pt or intel_bts. Refer to comments in the scripts call-graph-from-postgresql.py and export-to-postgresql.py for more details.
---
 .../scripts/python/call-graph-from-postgresql.py   | 327 +++++++++++++++++++++
 tools/perf/scripts/python/export-to-postgresql.py  |  47 +++
 2 files changed, 374 insertions(+)
 create mode 100644 tools/perf/scripts/python/call-graph-from-postgresql.py
tools/perf/scripts/python/call-graph-from-postgresql.py new file +327 -0
@@ -0,0 +1,327 @@ +#!/usr/bin/python2 +# call-graph-from-postgresql.py: create call-graph from postgresql database +# Copyright (c) 2014, Intel Corporation. +# +# This program is free software; you can redistribute it and/or modify it +# under the terms and conditions of the GNU General Public License, +# version 2, as published by the Free Software Foundation. +# +# This program is distributed in the hope it will be useful, but WITHOUT +# ANY WARRANTY; without even the implied warranty of MERCHANTABILITY or +# FITNESS FOR A PARTICULAR PURPOSE. See the GNU General Public License for +# more details. + +# To use this script you will need to have exported data using the +# export-to-postgresql.py script. Refer to that script for details. +# +# Following on from the example in the export-to-postgresql.py script, a +# call-graph can be displayed for the pt_example database like this: +# +# python tools/perf/scripts/python/call-graph-from-postgresql.py pt_example +# +# Note this script supports connecting to remote databases by setting hostname, +# port, username, password, and dbname e.g. +# +# python tools/perf/scripts/python/call-graph-from-postgresql.py "hostname=myhost username=myuser password=mypassword dbname=pt_example" +# +# The result is a GUI window with a tree representing a context-sensitive +# call-graph. Expanding a couple of levels of the tree and adjusting column +# widths to suit will display something like: +# +# Call Graph: pt_example +# Call Path Object Count Time(ns) Time(%) Branch Count Branch Count(%) +# v- ls +# v- 2638:2638 +# v- _start ld-2.19.so 1 10074071 100.0 211135 100.0 +# |- unknown unknown 1 13198 0.1 1 0.0 +# >- _dl_start ld-2.19.so 1 1400980 13.9 19637 9.3 +# >- _d_linit_internal ld-2.19.so 1 448152 4.4 11094 5.3 +# v-__libc_start_main@plt ls 1 8211741 81.5 180397 85.4 +# >- _dl_fixup ld-2.19.so 1 7607 0.1 108 0.1 +# >- __cxa_atexit libc-2.19.so 1 11737 0.1 10 0.0 +# >- __libc_csu_init ls 1 10354 0.1 10 0.0 +# |- _setjmp libc-2.19.so 1 0 0.0 4 0.0 +# v- main ls 1 8182043 99.6 180254 99.9 +# +# Points to note: +# The top level is a command name (comm) +# The next level is a thread (pid:tid) +# Subsequent levels are functions +# 'Count' is the number of calls +# 'Time' is the elapsed time until the function returns +# Percentages are relative to the level above +# 'Branch Count' is the total number of branches for that function and all +# functions that it calls + +import sys +from PySide.QtCore import * +from PySide.QtGui import * +from PySide.QtSql import * +from decimal import * + +class TreeItem(): + + def __init__(self, db, row, parent_item): + self.db = db + self.row = row + self.parent_item = parent_item + self.query_done = False; + self.child_count = 0 + self.child_items = [] + self.data = ["", "", "", "", "", "", ""] + self.comm_id = 0 + self.thread_id = 0 + self.call_path_id = 1 + self.branch_count = 0 + self.time = 0 + if not parent_item: + self.setUpRoot() + + def setUpRoot(self): + self.query_done = True + query = QSqlQuery(self.db) + ret = query.exec_('SELECT id, comm FROM comms') + if not ret: + raise Exception("Query failed: " + query.lastError().text()) + while query.next(): + if not query.value(0): + continue + child_item = TreeItem(self.db, self.child_count, self) + self.child_items.append(child_item) + self.child_count += 1 + child_item.setUpLevel1(query.value(0), query.value(1)) + + def setUpLevel1(self, comm_id, comm): + self.query_done = True; + self.comm_id = comm_id + self.data[0] = comm + self.child_items = [] + self.child_count = 0 + query = QSqlQuery(self.db) + ret = query.exec_('SELECT thread_id, ( SELECT pid FROM threads WHERE id = thread_id ), ( SELECT tid FROM threads WHERE id = thread_id ) FROM comm_threads WHERE comm_id = ' + str(comm_id)) + if not ret: + raise Exception("Query failed: " + query.lastError().text()) + while query.next(): + child_item = TreeItem(self.db, self.child_count, self) + self.child_items.append(child_item) + self.child_count += 1 + child_item.setUpLevel2(comm_id, query.value(0), query.value(1), query.value(2)) + + def setUpLevel2(self, comm_id, thread_id, pid, tid): + self.comm_id = comm_id + self.thread_id = thread_id + self.data[0] = str(pid) + ":" + str(tid) + + def getChildItem(self, row): + return self.child_items[row] + + def getParentItem(self): + return self.parent_item + + def getRow(self): + return self.row + + def timePercent(self, b): + if not self.time: + return "0.0" + x = (b * Decimal(100)) / self.time + return str(x.quantize(Decimal('.1'), rounding=ROUND_HALF_UP)) + + def branchPercent(self, b): + if not self.branch_count: + return "0.0" + x = (b * Decimal(100)) / self.branch_count + return str(x.quantize(Decimal('.1'), rounding=ROUND_HALF_UP)) + + def addChild(self, call_path_id, name, dso, count, time, branch_count): + child_item = TreeItem(self.db, self.child_count, self) + child_item.comm_id = self.comm_id + child_item.thread_id = self.thread_id + child_item.call_path_id = call_path_id + child_item.branch_count = branch_count + child_item.time = time + child_item.data[0] = name + if dso == "[kernel.kallsyms]": + dso = "[kernel]" + child_item.data[1] = dso + child_item.data[2] = str(count) + child_item.data[3] = str(time) + child_item.data[4] = self.timePercent(time) + child_item.data[5] = str(branch_count) + child_item.data[6] = self.branchPercent(branch_count) + self.child_items.append(child_item) + self.child_count += 1 + + def selectCalls(self): + self.query_done = True; + query = QSqlQuery(self.db) + ret = query.exec_('SELECT id, call_path_id, branch_count, call_time, return_time, ' + '( SELECT name FROM symbols WHERE id = ( SELECT symbol_id FROM call_paths WHERE id = call_path_id ) ), ' + '( SELECT short_name FROM dsos WHERE id = ( SELECT dso_id FROM symbols WHERE id = ( SELECT symbol_id FROM call_paths WHERE id = call_path_id ) ) ), ' + '( SELECT ip FROM call_paths where id = call_path_id ) ' + 'FROM calls WHERE parent_call_path_id = ' + str(self.call_path_id) + ' AND comm_id = ' + str(self.comm_id) + ' AND thread_id = ' + str(self.thread_id) + + 'ORDER BY call_path_id') + if not ret: + raise Exception("Query failed: " + query.lastError().text()) + last_call_path_id = 0 + name = "" + dso = "" + count = 0 + branch_count = 0 + total_branch_count = 0 + time = 0 + total_time = 0 + while query.next(): + if query.value(1) == last_call_path_id: + count += 1 + branch_count += query.value(2) + time += query.value(4) - query.value(3) + else: + if count: + self.addChild(last_call_path_id, name, dso, count, time, branch_count) + last_call_path_id = query.value(1) + name = query.value(5) + dso = query.value(6) + count = 1 + total_branch_count += branch_count + total_time += time + branch_count = query.value(2) + time = query.value(4) - query.value(3) + if count: + self.addChild(last_call_path_id, name, dso, count, time, branch_count) + total_branch_count += branch_count + total_time += time + # Top level does not have time or branch count, so fix that here + if total_branch_count > self.branch_count: + self.branch_count = total_branch_count + if self.branch_count: + for child_item in self.child_items: + child_item.data[6] = self.branchPercent(child_item.branch_count) + if total_time > self.time: + self.time = total_time + if self.time: + for child_item in self.child_items: + child_item.data[4] = self.timePercent(child_item.time) + + def childCount(self): + if not self.query_done: + self.selectCalls() + return self.child_count + + def columnCount(self): + return 7 + + def columnHeader(self, column): + headers = ["Call Path", "Object", "Count ", "Time (ns) ", "Time (%) ", "Branch Count ", "Branch Count (%) "] + return headers[column] + + def getData(self, column): + return self.data[column] + +class TreeModel(QAbstractItemModel): + + def __init__(self, db, parent=None): + super(TreeModel, self).__init__(parent) + self.db = db + self.root = TreeItem(db, 0, None) + + def columnCount(self, parent): + return self.root.columnCount() + + def rowCount(self, parent): + if parent.isValid(): + parent_item = parent.internalPointer() + else: + parent_item = self.root + return parent_item.childCount() + + def headerData(self, section, orientation, role): + if role == Qt.TextAlignmentRole: + if section > 1: + return Qt.AlignRight + if role != Qt.DisplayRole: + return None + if orientation != Qt.Horizontal: + return None + return self.root.columnHeader(section) + + def parent(self, child): + child_item = child.internalPointer() + if child_item is self.root: + return QModelIndex() + parent_item = child_item.getParentItem() + return self.createIndex(parent_item.getRow(), 0, parent_item) + + def index(self, row, column, parent): + if parent.isValid(): + parent_item = parent.internalPointer() + else: + parent_item = self.root + child_item = parent_item.getChildItem(row) + return self.createIndex(row, column, child_item) + + def data(self, index, role): + if role == Qt.TextAlignmentRole: + if index.column() > 1: + return Qt.AlignRight + if role != Qt.DisplayRole: + return None + index_item = index.internalPointer() + return index_item.getData(index.column()) + +class MainWindow(QMainWindow): + + def __init__(self, db, dbname, parent=None): + super(MainWindow, self).__init__(parent) + + self.setObjectName("MainWindow") + self.setWindowTitle("Call Graph: " + dbname) + self.move(100, 100) + self.resize(800, 600) + style = self.style() + icon = style.standardIcon(QStyle.SP_MessageBoxInformation) + self.setWindowIcon(icon); + + self.model = TreeModel(db) + + self.view = QTreeView() + self.view.setModel(self.model) + + self.setCentralWidget(self.view) + +if __name__ == '__main__': + if (len(sys.argv) < 2): + print >> sys.stderr, "Usage is: call-graph-from-postgresql.py <database name>" + raise Exception("Too few arguments") + + dbname = sys.argv[1] + + db = QSqlDatabase.addDatabase('QPSQL') + + opts = dbname.split() + for opt in opts: + if '=' in opt: + opt = opt.split('=') + if opt[0] == 'hostname': + db.setHostName(opt[1]) + elif opt[0] == 'port': + db.setPort(int(opt[1])) + elif opt[0] == 'username': + db.setUserName(opt[1]) + elif opt[0] == 'password': + db.setPassword(opt[1]) + elif opt[0] == 'dbname': + dbname = opt[1] + else: + dbname = opt + + db.setDatabaseName(dbname) + if not db.open(): + raise Exception("Failed to open database " + dbname + " error: " + db.lastError().text()) + + app = QApplication(sys.argv) + window = MainWindow(db, dbname) + window.show() + err = app.exec_() + db.close() + sys.exit(err)
tools/perf/scripts/python/export-to-postgresql.py +47 -0
53 lines not on this page · raw message
Signature · 1 line
1.9.1
Arnaldo Carvalho de Melo
maintainerRe: [PATCH V8 10/25] perf tools: Add example call-graph script
Em Fri, Jul 17, 2015 at 07:33:45PM +0300, Adrian Hunter escreveu:
Quoted 5 lines
Add a script to produce a call-graph from data exported to a postgresql database and derived from a processor trace event like
intel_ptorintel_bts. Refer to comments in the scriptscall-graph-from-postgresql.pyandexport-to-postgresql.pyfor more details.
Testing this, you forgot to add instructions to install the qt stuff:
[acme@felicio ~]$ perf script -s ~/libexec/perf-core/scripts/python/export-to-postgresql.py bts_example branches calls
Traceback (most recent call last):
File
"/home/acme/libexec/perf-core/scripts/python/export-to-postgresql.py", line 65, in <module>
from PySide.QtSql import *
ImportError: No module named PySide.QtSql
Error running python script /home/acme/libexec/perf-core/scripts/python/export-to-postgresql.py [acme@felicio ~]$
I'll add it.
- Arnaldo
Quoted 400 lines
Signed-off-by Adrian Hunter <[email protected]>--- .../scripts/python/call-graph-from-postgresql.py | 327 +++++++++++++++++++++ tools/perf/scripts/python/export-to-postgresql.py | 47 +++ 2 files changed, 374 insertions(+) create mode 100644 tools/perf/scripts/python/call-graph-from-postgresql.pytools/perf/scripts/python/call-graph-from-postgresql.py new file +327
-0@@ -0,0 +1,327 @@ +#!/usr/bin/python2 +# call-graph-from-postgresql.py: create call-graph from postgresql database +# Copyright (c) 2014, Intel Corporation. +# +# This program is free software; you can redistribute it and/or modify it +# under the terms and conditions of the GNU General Public License, +# version 2, as published by the Free Software Foundation. +# +# This program is distributed in the hope it will be useful, but WITHOUT +# ANY WARRANTY; without even the implied warranty of MERCHANTABILITY or +# FITNESS FOR A PARTICULAR PURPOSE. See the GNU General Public License for +# more details. + +# To use this script you will need to have exported data using the +# export-to-postgresql.py script. Refer to that script for details. +# +# Following on from the example in the export-to-postgresql.py script, a +# call-graph can be displayed for the pt_example database like this: +# +# python tools/perf/scripts/python/call-graph-from-postgresql.py pt_example +# +# Note this script supports connecting to remote databases by setting hostname, +# port, username, password, and dbname e.g. +# +# python tools/perf/scripts/python/call-graph-from-postgresql.py "hostname=myhost username=myuser password=mypassword dbname=pt_example" +# +# The result is a GUI window with a tree representing a context-sensitive +# call-graph. Expanding a couple of levels of the tree and adjusting column +# widths to suit will display something like: +# +# Call Graph: pt_example +# Call Path Object Count Time(ns) Time(%) Branch Count Branch Count(%) +# v- ls +# v- 2638:2638 +# v- _start ld-2.19.so 1 10074071 100.0 211135 100.0 +# |- unknown unknown 1 13198 0.1 1 0.0 +# >- _dl_start ld-2.19.so 1 1400980 13.9 19637 9.3 +# >- _d_linit_internal ld-2.19.so 1 448152 4.4 11094 5.3 +# v-__libc_start_main@plt ls 1 8211741 81.5 180397 85.4 +# >- _dl_fixup ld-2.19.so 1 7607 0.1 108 0.1 +# >- __cxa_atexit libc-2.19.so 1 11737 0.1 10 0.0 +# >- __libc_csu_init ls 1 10354 0.1 10 0.0 +# |- _setjmp libc-2.19.so 1 0 0.0 4 0.0 +# v- main ls 1 8182043 99.6 180254 99.9 +# +# Points to note: +# The top level is a command name (comm) +# The next level is a thread (pid:tid) +# Subsequent levels are functions +# 'Count' is the number of calls +# 'Time' is the elapsed time until the function returns +# Percentages are relative to the level above +# 'Branch Count' is the total number of branches for that function and all +# functions that it calls + +import sys +from PySide.QtCore import * +from PySide.QtGui import * +from PySide.QtSql import * +from decimal import * + +class TreeItem(): + + def __init__(self, db, row, parent_item): + self.db = db + self.row = row + self.parent_item = parent_item + self.query_done = False; + self.child_count = 0 + self.child_items = [] + self.data = ["", "", "", "", "", "", ""] + self.comm_id = 0 + self.thread_id = 0 + self.call_path_id = 1 + self.branch_count = 0 + self.time = 0 + if not parent_item: + self.setUpRoot() + + def setUpRoot(self): + self.query_done = True + query = QSqlQuery(self.db) + ret = query.exec_('SELECT id, comm FROM comms') + if not ret: + raise Exception("Query failed: " + query.lastError().text()) + while query.next(): + if not query.value(0): + continue + child_item = TreeItem(self.db, self.child_count, self) + self.child_items.append(child_item) + self.child_count += 1 + child_item.setUpLevel1(query.value(0), query.value(1)) + + def setUpLevel1(self, comm_id, comm): + self.query_done = True; + self.comm_id = comm_id + self.data[0] = comm + self.child_items = [] + self.child_count = 0 + query = QSqlQuery(self.db) + ret = query.exec_('SELECT thread_id, ( SELECT pid FROM threads WHERE id = thread_id ), ( SELECT tid FROM threads WHERE id = thread_id ) FROM comm_threads WHERE comm_id = ' + str(comm_id)) + if not ret: + raise Exception("Query failed: " + query.lastError().text()) + while query.next(): + child_item = TreeItem(self.db, self.child_count, self) + self.child_items.append(child_item) + self.child_count += 1 + child_item.setUpLevel2(comm_id, query.value(0), query.value(1), query.value(2)) + + def setUpLevel2(self, comm_id, thread_id, pid, tid): + self.comm_id = comm_id + self.thread_id = thread_id + self.data[0] = str(pid) + ":" + str(tid) + + def getChildItem(self, row): + return self.child_items[row] + + def getParentItem(self): + return self.parent_item + + def getRow(self): + return self.row + + def timePercent(self, b): + if not self.time: + return "0.0" + x = (b * Decimal(100)) / self.time + return str(x.quantize(Decimal('.1'), rounding=ROUND_HALF_UP)) + + def branchPercent(self, b): + if not self.branch_count: + return "0.0" + x = (b * Decimal(100)) / self.branch_count + return str(x.quantize(Decimal('.1'), rounding=ROUND_HALF_UP)) + + def addChild(self, call_path_id, name, dso, count, time, branch_count): + child_item = TreeItem(self.db, self.child_count, self) + child_item.comm_id = self.comm_id + child_item.thread_id = self.thread_id + child_item.call_path_id = call_path_id + child_item.branch_count = branch_count + child_item.time = time + child_item.data[0] = name + if dso == "[kernel.kallsyms]": + dso = "[kernel]" + child_item.data[1] = dso + child_item.data[2] = str(count) + child_item.data[3] = str(time) + child_item.data[4] = self.timePercent(time) + child_item.data[5] = str(branch_count) + child_item.data[6] = self.branchPercent(branch_count) + self.child_items.append(child_item) + self.child_count += 1 + + def selectCalls(self): + self.query_done = True; + query = QSqlQuery(self.db) + ret = query.exec_('SELECT id, call_path_id, branch_count, call_time, return_time, ' + '( SELECT name FROM symbols WHERE id = ( SELECT symbol_id FROM call_paths WHERE id = call_path_id ) ), ' + '( SELECT short_name FROM dsos WHERE id = ( SELECT dso_id FROM symbols WHERE id = ( SELECT symbol_id FROM call_paths WHERE id = call_path_id ) ) ), ' + '( SELECT ip FROM call_paths where id = call_path_id ) ' + 'FROM calls WHERE parent_call_path_id = ' + str(self.call_path_id) + ' AND comm_id = ' + str(self.comm_id) + ' AND thread_id = ' + str(self.thread_id) + + 'ORDER BY call_path_id') + if not ret: + raise Exception("Query failed: " + query.lastError().text()) + last_call_path_id = 0 + name = "" + dso = "" + count = 0 + branch_count = 0 + total_branch_count = 0 + time = 0 + total_time = 0 + while query.next(): + if query.value(1) == last_call_path_id: + count += 1 + branch_count += query.value(2) + time += query.value(4) - query.value(3) + else: + if count: + self.addChild(last_call_path_id, name, dso, count, time, branch_count) + last_call_path_id = query.value(1) + name = query.value(5) + dso = query.value(6) + count = 1 + total_branch_count += branch_count + total_time += time + branch_count = query.value(2) + time = query.value(4) - query.value(3) + if count: + self.addChild(last_call_path_id, name, dso, count, time, branch_count) + total_branch_count += branch_count + total_time += time + # Top level does not have time or branch count, so fix that here + if total_branch_count > self.branch_count: + self.branch_count = total_branch_count + if self.branch_count: + for child_item in self.child_items: + child_item.data[6] = self.branchPercent(child_item.branch_count) + if total_time > self.time: + self.time = total_time + if self.time: + for child_item in self.child_items: + child_item.data[4] = self.timePercent(child_item.time) + + def childCount(self): + if not self.query_done: + self.selectCalls() + return self.child_count + + def columnCount(self): + return 7 + + def columnHeader(self, column): + headers = ["Call Path", "Object", "Count ", "Time (ns) ", "Time (%) ", "Branch Count ", "Branch Count (%) "] + return headers[column] + + def getData(self, column): + return self.data[column] + +class TreeModel(QAbstractItemModel): + + def __init__(self, db, parent=None): + super(TreeModel, self).__init__(parent) + self.db = db + self.root = TreeItem(db, 0, None) + + def columnCount(self, parent): + return self.root.columnCount() + + def rowCount(self, parent): + if parent.isValid(): + parent_item = parent.internalPointer() + else: + parent_item = self.root + return parent_item.childCount() + + def headerData(self, section, orientation, role): + if role == Qt.TextAlignmentRole: + if section > 1: + return Qt.AlignRight + if role != Qt.DisplayRole: + return None + if orientation != Qt.Horizontal: + return None + return self.root.columnHeader(section) + + def parent(self, child): + child_item = child.internalPointer() + if child_item is self.root: + return QModelIndex() + parent_item = child_item.getParentItem() + return self.createIndex(parent_item.getRow(), 0, parent_item) + + def index(self, row, column, parent): + if parent.isValid(): + parent_item = parent.internalPointer() + else: + parent_item = self.root + child_item = parent_item.getChildItem(row) + return self.createIndex(row, column, child_item) + + def data(self, index, role): + if role == Qt.TextAlignmentRole: + if index.column() > 1: + return Qt.AlignRight + if role != Qt.DisplayRole: + return None + index_item = index.internalPointer() + return index_item.getData(index.column()) + +class MainWindow(QMainWindow): + + def __init__(self, db, dbname, parent=None): + super(MainWindow, self).__init__(parent) + + self.setObjectName("MainWindow") + self.setWindowTitle("Call Graph: " + dbname) + self.move(100, 100) + self.resize(800, 600) + style = self.style() + icon = style.standardIcon(QStyle.SP_MessageBoxInformation) + self.setWindowIcon(icon); + + self.model = TreeModel(db) + + self.view = QTreeView() + self.view.setModel(self.model) + + self.setCentralWidget(self.view) + +if __name__ == '__main__': + if (len(sys.argv) < 2): + print >> sys.stderr, "Usage is: call-graph-from-postgresql.py <database name>" + raise Exception("Too few arguments") + + dbname = sys.argv[1] + + db = QSqlDatabase.addDatabase('QPSQL') + + opts = dbname.split() + for opt in opts: + if '=' in opt: + opt = opt.split('=') + if opt[0] == 'hostname': + db.setHostName(opt[1]) + elif opt[0] == 'port': + db.setPort(int(opt[1])) + elif opt[0] == 'username': + db.setUserName(opt[1]) + elif opt[0] == 'password': + db.setPassword(opt[1]) + elif opt[0] == 'dbname': + dbname = opt[1] + else: + dbname = opt + + db.setDatabaseName(dbname) + if not db.open(): + raise Exception("Failed to open database " + dbname + " error: " + db.lastError().text()) + + app = QApplication(sys.argv) + window = MainWindow(db, dbname) + window.show() + err = app.exec_() + db.close() + sys.exit(err)tools/perf/scripts/python/export-to-postgresql.py +47
-0@@ -15,6 +15,53 @@ import sys import struct import datetime +# To use this script you will need to have installed package python-pyside which +# provides LGPL-licensed Python bindings for Qt. You will also need the package +# libqt4-sql-psql for Qt postgresql support. +# +# The script assumes postgresql is running on the local machine and that the +# user has postgresql permissions to create databases. Examples of installing +# postgresql and adding such a user are: +# +# fedora: +# +# $ sudo yum install postgresql postgresql-server +# $ sudo su - postgres -c initdb +# $ sudo service postgresql start +# $ sudo su - postgres +# $ createuser <your user id here> +# Shall the new role be a superuser? (y/n) y +# +# ubuntu: +# +# $ sudo apt-get install postgresql +# $ sudo su - postgres +# $ createuser <your user id here> +# Shall the new role be a superuser? (y/n) y +# +# An example of using this script with Intel PT: +# +# $ perf record -e intel_pt//u ls +# $ perf script -s ~/libexec/perf-core/scripts/python/export-to-postgresql.py pt_example branches calls +# 2015-05-29 12:49:23.464364 Creating database... +# 2015-05-29 12:49:26.281717 Writing to intermediate files... +# 2015-05-29 12:49:27.190383 Copying to database... +# 2015-05-29 12:49:28.140451 Removing intermediate files... +# 2015-05-29 12:49:28.147451 Adding primary keys +# 2015-05-29 12:49:28.655683 Adding foreign keys +# 2015-05-29 12:49:29.365350 Done +# +# To browse the database, psql can be used e.g. +# +# $ psql pt_example +# pt_example=# select * from samples_view where id < 100; +# pt_example=# \d+ +# pt_example=# \d+ samples_view +# pt_example=# \q +# +# An example of using the database is provided by the script +# call-graph-from-postgresql.py. Refer to that script for details. + from PySide.QtSql import * # Need to access PostgreSQL C library directly to use COPY FROM STDINSignature · 1 line
1.9.1
Arnaldo Carvalho de Melo
maintainerRe: [PATCH V8 10/25] perf tools: Add example call-graph script
Em Fri, Aug 21, 2015 at 12:00:13PM -0300, Arnaldo Carvalho de Melo escreveu:
Quoted 23 lines
Em Fri, Jul 17, 2015 at 07:33:45PM +0300, Adrian Hunter escreveu:
Quoted 5 lines
Add a script to produce a call-graph from data exported to a postgresql database and derived from a processor trace event like
intel_ptorintel_bts. Refer to comments in the scriptscall-graph-from-postgresql.pyandexport-to-postgresql.pyfor more details.Testing this, you forgot to add instructions to install the qt stuff:
[acme@felicio ~]$ perf script -s
~/libexec/perf-core/scripts/python/export-to-postgresql.pybts_examplebranches callsTraceback (most recent call last):
File
"/home/acme/libexec/perf-core/scripts/python/export-to-postgresql.py", line 65, in <module>
from PySide.QtSql import *
ImportError: No module named PySide.QtSql
Error running python script/home/acme/libexec/perf-core/scripts/python/export-to-postgresql.py[acme@felicio ~]$
Quoted 1 line
I'll add it.
[acme@zoo ~]$ perf script -s ~/libexec/perf-core/scripts/python/export-to-postgresql.py bts_example branches calls Traceback (most recent call last):
File "/home/acme/libexec/perf-core/scripts/python/export-to-postgresql.py", line 18, in <module>
from PySide.QtSql import *
ImportError: No module named PySide.QtSql
Error running python script /home/acme/libexec/perf-core/scripts/python/export-to-postgresql.py
Installed python-pyside, fedora21, but still something is missing:
[acme@zoo ~]$ perf script -s ~/libexec/perf-core/scripts/python/export-to-postgresql.py bts_example branches calls
2015-08-21 12:10:00.504126 Creating database...
QSqlDatabase: QPSQL driver not loaded
QSqlDatabase: available drivers: QSQLITE
QSqlDatabase: an instance of QCoreApplication is required for loading driver plugins QSqlQuery::exec: database not open
Traceback (most recent call last):
File "/home/acme/libexec/perf-core/scripts/python/export-to-postgresql.py", line 87, in <module>
do_query(query, 'CREATE DATABASE ' + dbname)
File "/home/acme/libexec/perf-core/scripts/python/export-to-postgresql.py", line 78, in do_query
raise Exception("Query failed: " + q.lastError().text())
Exception: Query failed: Driver not loaded Driver not loaded
Error running python script /home/acme/libexec/perf-core/scripts/python/export-to-postgresql.py [acme@zoo ~]$
Quoted 402 lines
- Arnaldo
Quoted 400 lines
Signed-off-by Adrian Hunter <[email protected]>--- .../scripts/python/call-graph-from-postgresql.py | 327 +++++++++++++++++++++ tools/perf/scripts/python/export-to-postgresql.py | 47 +++ 2 files changed, 374 insertions(+) create mode 100644 tools/perf/scripts/python/call-graph-from-postgresql.pytools/perf/scripts/python/call-graph-from-postgresql.py new file +327
-0@@ -0,0 +1,327 @@ +#!/usr/bin/python2 +# call-graph-from-postgresql.py: create call-graph from postgresql database +# Copyright (c) 2014, Intel Corporation. +# +# This program is free software; you can redistribute it and/or modify it +# under the terms and conditions of the GNU General Public License, +# version 2, as published by the Free Software Foundation. +# +# This program is distributed in the hope it will be useful, but WITHOUT +# ANY WARRANTY; without even the implied warranty of MERCHANTABILITY or +# FITNESS FOR A PARTICULAR PURPOSE. See the GNU General Public License for +# more details. + +# To use this script you will need to have exported data using the +# export-to-postgresql.py script. Refer to that script for details. +# +# Following on from the example in the export-to-postgresql.py script, a +# call-graph can be displayed for the pt_example database like this: +# +# python tools/perf/scripts/python/call-graph-from-postgresql.py pt_example +# +# Note this script supports connecting to remote databases by setting hostname, +# port, username, password, and dbname e.g. +# +# python tools/perf/scripts/python/call-graph-from-postgresql.py "hostname=myhost username=myuser password=mypassword dbname=pt_example" +# +# The result is a GUI window with a tree representing a context-sensitive +# call-graph. Expanding a couple of levels of the tree and adjusting column +# widths to suit will display something like: +# +# Call Graph: pt_example +# Call Path Object Count Time(ns) Time(%) Branch Count Branch Count(%) +# v- ls +# v- 2638:2638 +# v- _start ld-2.19.so 1 10074071 100.0 211135 100.0 +# |- unknown unknown 1 13198 0.1 1 0.0 +# >- _dl_start ld-2.19.so 1 1400980 13.9 19637 9.3 +# >- _d_linit_internal ld-2.19.so 1 448152 4.4 11094 5.3 +# v-__libc_start_main@plt ls 1 8211741 81.5 180397 85.4 +# >- _dl_fixup ld-2.19.so 1 7607 0.1 108 0.1 +# >- __cxa_atexit libc-2.19.so 1 11737 0.1 10 0.0 +# >- __libc_csu_init ls 1 10354 0.1 10 0.0 +# |- _setjmp libc-2.19.so 1 0 0.0 4 0.0 +# v- main ls 1 8182043 99.6 180254 99.9 +# +# Points to note: +# The top level is a command name (comm) +# The next level is a thread (pid:tid) +# Subsequent levels are functions +# 'Count' is the number of calls +# 'Time' is the elapsed time until the function returns +# Percentages are relative to the level above +# 'Branch Count' is the total number of branches for that function and all +# functions that it calls + +import sys +from PySide.QtCore import * +from PySide.QtGui import * +from PySide.QtSql import * +from decimal import * + +class TreeItem(): + + def __init__(self, db, row, parent_item): + self.db = db + self.row = row + self.parent_item = parent_item + self.query_done = False; + self.child_count = 0 + self.child_items = [] + self.data = ["", "", "", "", "", "", ""] + self.comm_id = 0 + self.thread_id = 0 + self.call_path_id = 1 + self.branch_count = 0 + self.time = 0 + if not parent_item: + self.setUpRoot() + + def setUpRoot(self): + self.query_done = True + query = QSqlQuery(self.db) + ret = query.exec_('SELECT id, comm FROM comms') + if not ret: + raise Exception("Query failed: " + query.lastError().text()) + while query.next(): + if not query.value(0): + continue + child_item = TreeItem(self.db, self.child_count, self) + self.child_items.append(child_item) + self.child_count += 1 + child_item.setUpLevel1(query.value(0), query.value(1)) + + def setUpLevel1(self, comm_id, comm): + self.query_done = True; + self.comm_id = comm_id + self.data[0] = comm + self.child_items = [] + self.child_count = 0 + query = QSqlQuery(self.db) + ret = query.exec_('SELECT thread_id, ( SELECT pid FROM threads WHERE id = thread_id ), ( SELECT tid FROM threads WHERE id = thread_id ) FROM comm_threads WHERE comm_id = ' + str(comm_id)) + if not ret: + raise Exception("Query failed: " + query.lastError().text()) + while query.next(): + child_item = TreeItem(self.db, self.child_count, self) + self.child_items.append(child_item) + self.child_count += 1 + child_item.setUpLevel2(comm_id, query.value(0), query.value(1), query.value(2)) + + def setUpLevel2(self, comm_id, thread_id, pid, tid): + self.comm_id = comm_id + self.thread_id = thread_id + self.data[0] = str(pid) + ":" + str(tid) + + def getChildItem(self, row): + return self.child_items[row] + + def getParentItem(self): + return self.parent_item + + def getRow(self): + return self.row + + def timePercent(self, b): + if not self.time: + return "0.0" + x = (b * Decimal(100)) / self.time + return str(x.quantize(Decimal('.1'), rounding=ROUND_HALF_UP)) + + def branchPercent(self, b): + if not self.branch_count: + return "0.0" + x = (b * Decimal(100)) / self.branch_count + return str(x.quantize(Decimal('.1'), rounding=ROUND_HALF_UP)) + + def addChild(self, call_path_id, name, dso, count, time, branch_count): + child_item = TreeItem(self.db, self.child_count, self) + child_item.comm_id = self.comm_id + child_item.thread_id = self.thread_id + child_item.call_path_id = call_path_id + child_item.branch_count = branch_count + child_item.time = time + child_item.data[0] = name + if dso == "[kernel.kallsyms]": + dso = "[kernel]" + child_item.data[1] = dso + child_item.data[2] = str(count) + child_item.data[3] = str(time) + child_item.data[4] = self.timePercent(time) + child_item.data[5] = str(branch_count) + child_item.data[6] = self.branchPercent(branch_count) + self.child_items.append(child_item) + self.child_count += 1 + + def selectCalls(self): + self.query_done = True; + query = QSqlQuery(self.db) + ret = query.exec_('SELECT id, call_path_id, branch_count, call_time, return_time, ' + '( SELECT name FROM symbols WHERE id = ( SELECT symbol_id FROM call_paths WHERE id = call_path_id ) ), ' + '( SELECT short_name FROM dsos WHERE id = ( SELECT dso_id FROM symbols WHERE id = ( SELECT symbol_id FROM call_paths WHERE id = call_path_id ) ) ), ' + '( SELECT ip FROM call_paths where id = call_path_id ) ' + 'FROM calls WHERE parent_call_path_id = ' + str(self.call_path_id) + ' AND comm_id = ' + str(self.comm_id) + ' AND thread_id = ' + str(self.thread_id) + + 'ORDER BY call_path_id') + if not ret: + raise Exception("Query failed: " + query.lastError().text()) + last_call_path_id = 0 + name = "" + dso = "" + count = 0 + branch_count = 0 + total_branch_count = 0 + time = 0 + total_time = 0 + while query.next(): + if query.value(1) == last_call_path_id: + count += 1 + branch_count += query.value(2) + time += query.value(4) - query.value(3) + else: + if count: + self.addChild(last_call_path_id, name, dso, count, time, branch_count) + last_call_path_id = query.value(1) + name = query.value(5) + dso = query.value(6) + count = 1 + total_branch_count += branch_count + total_time += time + branch_count = query.value(2) + time = query.value(4) - query.value(3) + if count: + self.addChild(last_call_path_id, name, dso, count, time, branch_count) + total_branch_count += branch_count + total_time += time + # Top level does not have time or branch count, so fix that here + if total_branch_count > self.branch_count: + self.branch_count = total_branch_count + if self.branch_count: + for child_item in self.child_items: + child_item.data[6] = self.branchPercent(child_item.branch_count) + if total_time > self.time: + self.time = total_time + if self.time: + for child_item in self.child_items: + child_item.data[4] = self.timePercent(child_item.time) + + def childCount(self): + if not self.query_done: + self.selectCalls() + return self.child_count + + def columnCount(self): + return 7 + + def columnHeader(self, column): + headers = ["Call Path", "Object", "Count ", "Time (ns) ", "Time (%) ", "Branch Count ", "Branch Count (%) "] + return headers[column] + + def getData(self, column): + return self.data[column] + +class TreeModel(QAbstractItemModel): + + def __init__(self, db, parent=None): + super(TreeModel, self).__init__(parent) + self.db = db + self.root = TreeItem(db, 0, None) + + def columnCount(self, parent): + return self.root.columnCount() + + def rowCount(self, parent): + if parent.isValid(): + parent_item = parent.internalPointer() + else: + parent_item = self.root + return parent_item.childCount() + + def headerData(self, section, orientation, role): + if role == Qt.TextAlignmentRole: + if section > 1: + return Qt.AlignRight + if role != Qt.DisplayRole: + return None + if orientation != Qt.Horizontal: + return None + return self.root.columnHeader(section) + + def parent(self, child): + child_item = child.internalPointer() + if child_item is self.root: + return QModelIndex() + parent_item = child_item.getParentItem() + return self.createIndex(parent_item.getRow(), 0, parent_item) + + def index(self, row, column, parent): + if parent.isValid(): + parent_item = parent.internalPointer() + else: + parent_item = self.root + child_item = parent_item.getChildItem(row) + return self.createIndex(row, column, child_item) + + def data(self, index, role): + if role == Qt.TextAlignmentRole: + if index.column() > 1: + return Qt.AlignRight + if role != Qt.DisplayRole: + return None + index_item = index.internalPointer() + return index_item.getData(index.column()) + +class MainWindow(QMainWindow): + + def __init__(self, db, dbname, parent=None): + super(MainWindow, self).__init__(parent) + + self.setObjectName("MainWindow") + self.setWindowTitle("Call Graph: " + dbname) + self.move(100, 100) + self.resize(800, 600) + style = self.style() + icon = style.standardIcon(QStyle.SP_MessageBoxInformation) + self.setWindowIcon(icon); + + self.model = TreeModel(db) + + self.view = QTreeView() + self.view.setModel(self.model) + + self.setCentralWidget(self.view) + +if __name__ == '__main__': + if (len(sys.argv) < 2): + print >> sys.stderr, "Usage is: call-graph-from-postgresql.py <database name>" + raise Exception("Too few arguments") + + dbname = sys.argv[1] + + db = QSqlDatabase.addDatabase('QPSQL') + + opts = dbname.split() + for opt in opts: + if '=' in opt: + opt = opt.split('=') + if opt[0] == 'hostname': + db.setHostName(opt[1]) + elif opt[0] == 'port': + db.setPort(int(opt[1])) + elif opt[0] == 'username': + db.setUserName(opt[1]) + elif opt[0] == 'password': + db.setPassword(opt[1]) + elif opt[0] == 'dbname': + dbname = opt[1] + else: + dbname = opt + + db.setDatabaseName(dbname) + if not db.open(): + raise Exception("Failed to open database " + dbname + " error: " + db.lastError().text()) + + app = QApplication(sys.argv) + window = MainWindow(db, dbname) + window.show() + err = app.exec_() + db.close() + sys.exit(err)tools/perf/scripts/python/export-to-postgresql.py +47
-0@@ -15,6 +15,53 @@ import sys import struct import datetime +# To use this script you will need to have installed package python-pyside which +# provides LGPL-licensed Python bindings for Qt. You will also need the package +# libqt4-sql-psql for Qt postgresql support. +# +# The script assumes postgresql is running on the local machine and that the +# user has postgresql permissions to create databases. Examples of installing +# postgresql and adding such a user are: +# +# fedora: +# +# $ sudo yum install postgresql postgresql-server +# $ sudo su - postgres -c initdb +# $ sudo service postgresql start +# $ sudo su - postgres +# $ createuser <your user id here> +# Shall the new role be a superuser? (y/n) y +# +# ubuntu: +# +# $ sudo apt-get install postgresql +# $ sudo su - postgres +# $ createuser <your user id here> +# Shall the new role be a superuser? (y/n) y +# +# An example of using this script with Intel PT: +# +# $ perf record -e intel_pt//u ls +# $ perf script -s ~/libexec/perf-core/scripts/python/export-to-postgresql.py pt_example branches calls +# 2015-05-29 12:49:23.464364 Creating database... +# 2015-05-29 12:49:26.281717 Writing to intermediate files... +# 2015-05-29 12:49:27.190383 Copying to database... +# 2015-05-29 12:49:28.140451 Removing intermediate files... +# 2015-05-29 12:49:28.147451 Adding primary keys +# 2015-05-29 12:49:28.655683 Adding foreign keys +# 2015-05-29 12:49:29.365350 Done +# +# To browse the database, psql can be used e.g. +# +# $ psql pt_example +# pt_example=# select * from samples_view where id < 100; +# pt_example=# \d+ +# pt_example=# \d+ samples_view +# pt_example=# \q +# +# An example of using the database is provided by the script +# call-graph-from-postgresql.py. Refer to that script for details. + from PySide.QtSql import * # Need to access PostgreSQL C library directly to use COPY FROM STDINSignature · 1 line
1.9.1
Arnaldo Carvalho de Melo
maintainerRe: [PATCH V8 10/25] perf tools: Add example call-graph script
Em Fri, Aug 21, 2015 at 12:11:33PM -0300, Arnaldo Carvalho de Melo escreveu:
Quoted 14 lines
[acme@zoo ~]$ perf script -s
~/libexec/perf-core/scripts/python/export-to-postgresql.pybts_examplebranches calls2015-08-21 12:10:00.504126 Creating database...QSqlDatabase: QPSQL driver not loaded
QSqlDatabase: available drivers: QSQLITE
QSqlDatabase: an instance of QCoreApplication is required for loading driver pluginsQSqlQuery::exec: database not open
Traceback (most recent call last):
File "/home/acme/libexec/perf-core/scripts/python/export-to-postgresql.py", line 87, in <module>
do_query(query, 'CREATE DATABASE ' + dbname)
File "/home/acme/libexec/perf-core/scripts/python/export-to-postgresql.py", line 78, indo_query
raiseException("Query failed: " + q.lastError().text())
Exception: Query failed: Driver not loaded Driver not loaded
Error running python script/home/acme/libexec/perf-core/scripts/python/export-to-postgresql.py[acme@zoo ~]$
A-ha, this was missing:
[root@zoo ~]# rpm -ql qt-postgresql/usr/lib64/qt4/plugins/sqldrivers/libqsqlpsql.so
[root@zoo ~]#
[acme@zoo ~]$ perf script -s ~/libexec/perf-core/scripts/python/export-to-postgresql.py bts_example branches calls
2015-08-21 12:20:01.841677 Creating database...
2015-08-21 12:20:02.556853 Writing to intermediate files...
2015-08-21 12:20:03.262814 Copying to database...
2015-08-21 12:20:03.783109 Removing intermediate files...
2015-08-21 12:20:03.790282 Adding primary keys
2015-08-21 12:20:04.294342 Adding foreign keys
2015-08-21 12:20:04.718238 Done
[acme@zoo ~]$
Now to the next steps... Lets see how this looks like with BTS...
- Arnaldo
Arnaldo Carvalho de Melo
maintainerRe: [PATCH V8 10/25] perf tools: Add example call-graph script
Em Fri, Aug 21, 2015 at 12:21:25PM -0300, Arnaldo Carvalho de Melo escreveu:
Quoted 30 lines
Em Fri, Aug 21, 2015 at 12:11:33PM -0300, Arnaldo Carvalho de Melo escreveu:
Quoted 14 lines
[acme@zoo ~]$ perf script -s
~/libexec/perf-core/scripts/python/export-to-postgresql.pybts_examplebranches calls2015-08-21 12:10:00.504126 Creating database...QSqlDatabase: QPSQL driver not loaded
QSqlDatabase: available drivers: QSQLITE
QSqlDatabase: an instance of QCoreApplication is required for loading driver pluginsQSqlQuery::exec: database not open
Traceback (most recent call last):
File "/home/acme/libexec/perf-core/scripts/python/export-to-postgresql.py", line 87, in <module>
do_query(query, 'CREATE DATABASE ' + dbname)
File "/home/acme/libexec/perf-core/scripts/python/export-to-postgresql.py", line 78, indo_query
raiseException("Query failed: " + q.lastError().text())
Exception: Query failed: Driver not loaded Driver not loaded
Error running python script/home/acme/libexec/perf-core/scripts/python/export-to-postgresql.py[acme@zoo ~]$A-ha, this was missing:
[root@zoo ~]# rpm -ql qt-postgresql
/usr/lib64/qt4/plugins/sqldrivers/libqsqlpsql.so
[root@zoo ~]#[acme@zoo ~]$ perf script -s
~/libexec/perf-core/scripts/python/export-to-postgresql.pybts_examplebranches calls2015-08-21 12:20:01.841677 Creating database... 2015-08-21 12:20:02.556853 Writing to intermediate files... 2015-08-21 12:20:03.262814 Copying to database... 2015-08-21 12:20:03.783109 Removing intermediate files... 2015-08-21 12:20:03.790282 Adding primary keys 2015-08-21 12:20:04.294342 Adding foreign keys 2015-08-21 12:20:04.718238 Done
Quoted 3 lines
[acme@zoo ~]$
Now to the next steps... Lets see how this looks like with BTS...
So, after running:
[acme@zoo linux]$ python tools/perf/scripts/python/call-graph-from-postgresql.py bts_example
I got a GUI and after expanding some callchains I took this screenshot:
http://vger.kernel.org/~acme/perf/call_graph_example_intel_bts.png
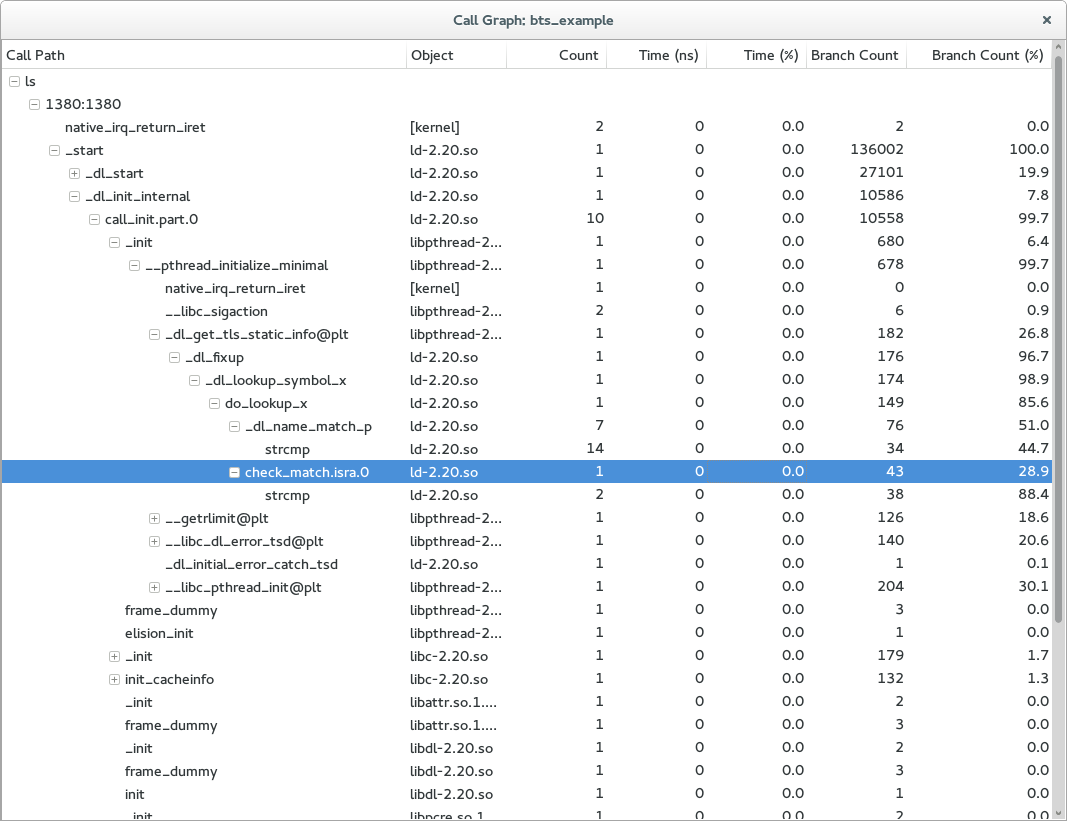
Cool stuff! But it seems the COMM got messed up? I.e. that "1380:1380" first level after "ls".
- Arnaldo
Arnaldo Carvalho de Melo
maintainerRe: [PATCH V8 10/25] perf tools: Add example call-graph script
Em Fri, Aug 21, 2015 at 12:28:13PM -0300, Arnaldo Carvalho de Melo escreveu:
Quoted 4 lines
Quoted 4 lines
A-ha, this was missing:
[root@zoo ~]# rpm -ql qt-postgresql
/usr/lib64/qt4/plugins/sqldrivers/libqsqlpsql.so
Adding this to your patch:
tools/perf/scripts/python/export-to-postgresql.py +1 -1
@@ -25,7 +25,7 @@ import datetime # # fedora: # -# $ sudo yum install postgresql postgresql-server +# $ sudo yum install postgresql postgresql-server python-pyside qt-postgresql # $ sudo su - postgres -c initdb # $ sudo service postgresql start # $ sudo su - postgres
Adrian Hunter
reviewerRe: [PATCH V8 10/25] perf tools: Add example call-graph script
In reply to Arnaldo Carvalho de MeloQuoted 40 lines · Arnaldo Carvalho de Melo
Em Fri, Aug 21, 2015 at 12:21:25PM -0300, Arnaldo Carvalho de Melo escreveu:
Quoted 30 lines
Em Fri, Aug 21, 2015 at 12:11:33PM -0300, Arnaldo Carvalho de Melo escreveu:
Quoted 14 lines
[acme@zoo ~]$ perf script -s
~/libexec/perf-core/scripts/python/export-to-postgresql.pybts_examplebranches calls2015-08-21 12:10:00.504126 Creating database...QSqlDatabase: QPSQL driver not loaded
QSqlDatabase: available drivers: QSQLITE
QSqlDatabase: an instance of QCoreApplication is required for loading driver pluginsQSqlQuery::exec: database not open
Traceback (most recent call last):
File "/home/acme/libexec/perf-core/scripts/python/export-to-postgresql.py", line 87, in <module>
do_query(query, 'CREATE DATABASE ' + dbname)
File "/home/acme/libexec/perf-core/scripts/python/export-to-postgresql.py", line 78, indo_query
raiseException("Query failed: " + q.lastError().text())
Exception: Query failed: Driver not loaded Driver not loaded
Error running python script/home/acme/libexec/perf-core/scripts/python/export-to-postgresql.py[acme@zoo ~]$A-ha, this was missing:
[root@zoo ~]# rpm -ql qt-postgresql
/usr/lib64/qt4/plugins/sqldrivers/libqsqlpsql.so
[root@zoo ~]#[acme@zoo ~]$ perf script -s
~/libexec/perf-core/scripts/python/export-to-postgresql.pybts_examplebranches calls2015-08-21 12:20:01.841677 Creating database... 2015-08-21 12:20:02.556853 Writing to intermediate files... 2015-08-21 12:20:03.262814 Copying to database... 2015-08-21 12:20:03.783109 Removing intermediate files... 2015-08-21 12:20:03.790282 Adding primary keys 2015-08-21 12:20:04.294342 Adding foreign keys 2015-08-21 12:20:04.718238 DoneQuoted 3 lines
[acme@zoo ~]$
Now to the next steps... Lets see how this looks like with BTS...
So, after running:
[acme@zoo linux]$ python
tools/perf/scripts/python/call-graph-from-postgresql.pybts_example
Quoted 6 lines
I got a GUI and after expanding some callchains I took this screenshot:
http://vger.kernel.org/~acme/perf/call_graph_example_intel_bts.png
Cool stuff! But it seems the COMM got messed up? I.e. that "1380:1380" first level after "ls".
That is, in fact, correct. The top-level is the process (comm). The next level is the threads (pid/tid) for that process. Currently, each thread is reported separately.
For the future, there ought to be an option to combine the data for all threads of a process, or all processes with the same comm. Also presently it is not tracking if a thread sets it's own comm (e.g. some multi-threaded applications name each thread).
Arnaldo Carvalho de Melo
maintainerRe: [PATCH V8 10/25] perf tools: Add example call-graph script
Em Mon, Aug 24, 2015 at 10:00:17AM +0300, Adrian Hunter escreveu:
Quoted 43 lines · Arnaldo Carvalho de Melo
Quoted 42 lines
Em Fri, Aug 21, 2015 at 12:21:25PM -0300, Arnaldo Carvalho de Melo escreveu:
Quoted 30 lines
Em Fri, Aug 21, 2015 at 12:11:33PM -0300, Arnaldo Carvalho de Melo escreveu:
Quoted 14 lines
[acme@zoo ~]$ perf script -s
~/libexec/perf-core/scripts/python/export-to-postgresql.pybts_examplebranches calls2015-08-21 12:10:00.504126 Creating database...QSqlDatabase: QPSQL driver not loaded
QSqlDatabase: available drivers: QSQLITE
QSqlDatabase: an instance of QCoreApplication is required for loading driver pluginsQSqlQuery::exec: database not open
Traceback (most recent call last):
File "/home/acme/libexec/perf-core/scripts/python/export-to-postgresql.py", line 87, in <module>
do_query(query, 'CREATE DATABASE ' + dbname)
File "/home/acme/libexec/perf-core/scripts/python/export-to-postgresql.py", line 78, indo_query
raiseException("Query failed: " + q.lastError().text())
Exception: Query failed: Driver not loaded Driver not loaded
Error running python script/home/acme/libexec/perf-core/scripts/python/export-to-postgresql.py[acme@zoo ~]$A-ha, this was missing:
[root@zoo ~]# rpm -ql qt-postgresql
/usr/lib64/qt4/plugins/sqldrivers/libqsqlpsql.so
[root@zoo ~]#[acme@zoo ~]$ perf script -s
~/libexec/perf-core/scripts/python/export-to-postgresql.pybts_examplebranches calls2015-08-21 12:20:01.841677 Creating database... 2015-08-21 12:20:02.556853 Writing to intermediate files... 2015-08-21 12:20:03.262814 Copying to database... 2015-08-21 12:20:03.783109 Removing intermediate files... 2015-08-21 12:20:03.790282 Adding primary keys 2015-08-21 12:20:04.294342 Adding foreign keys 2015-08-21 12:20:04.718238 DoneQuoted 3 lines
[acme@zoo ~]$
Now to the next steps... Lets see how this looks like with BTS...
So, after running:
[acme@zoo linux]$ python
tools/perf/scripts/python/call-graph-from-postgresql.pybts_exampleI got a GUI and after expanding some callchains I took this screenshot:
Quoted 8 lines
Quoted 4 lines
http://vger.kernel.org/~acme/perf/call_graph_example_intel_bts.png
Cool stuff! But it seems the COMM got messed up? I.e. that "1380:1380" first level after "ls".
That is, in fact, correct. The top-level is the process (comm). The next level is the threads (pid/tid) for that process. Currently, each thread is reported separately.
Ok, understood.
Quoted 4 lines
For the future, there ought to be an option to combine the data for all threads of a process, or all processes with the same comm. Also presently it is not tracking if a thread sets it's own comm (e.g. some multi-threaded applications name each thread).
And in that case it would be nice to have both the comms and pid/tid.
- Arnaldo
tip-bot for Adrian Hunter
merge bot[tip:perf/core] perf tools: Add example call-graph script
In reply to Adrian Hunterperf tools: Add example call-graph script
Commit-ID:  4b715d24f4f14731c7b553cbb8604fe865cb8d3c
Gitweb:     http://git.kernel.org/tip/4b715d24f4f14731c7b553cbb8604fe865cb8d3c
Author:     Adrian Hunter <[email protected]>
AuthorDate: Fri, 17 Jul 2015 19:33:45 +0300
Committer:  Arnaldo Carvalho de Melo <[email protected]>
CommitDate: Fri, 21 Aug 2015 12:32:40 -0300
perf tools: Add example call-graph script
Add a script to produce a call-graph from data exported to a postgresql database and derived from a processor trace event like intel_pt or intel_bts.
Refer to comments in the scripts call-graph-from-postgresql.py and export-to-postgresql.py for more details on how to set up the environment, install the required packages, etc.
Committer note:
Quoted 1 line
From the scripts, for convenience while reading 'git log':
An example of using this script with Intel PT:
  $ perf record -e intel_pt//u ls
  $ perf script -s ~/libexec/perf-core/scripts/python/export-to-postgresql.py pt_example branches calls
  2015-05-29 12:49:23.464364 Creating database...
  2015-05-29 12:49:26.281717 Writing to intermediate files...
  2015-05-29 12:49:27.190383 Copying to database...
  2015-05-29 12:49:28.140451 Removing intermediate files...
  2015-05-29 12:49:28.147451 Adding primary keys
  2015-05-29 12:49:28.655683 Adding foreign keys
  2015-05-29 12:49:29.365350 Done
  $ python tools/perf/scripts/python/call-graph-from-postgresql.py pt_example
  # The result is a GUI window with a tree representing a context-sensitive
  # call-graph.  Expanding a couple of levels of the tree and adjusting column
  # widths to suit will display something like:
Call Graph: pt_example
Call Path |Object |Count|Time(ns)|Time(%)|Branch Count|Branch Count(%)
v- ls
     v- 2638:2638
         v- _start                  ld-2.19.so    1   10074071  100.0        211135          100.0
           |- unknown               unknown       1      13198    0.1             1            0.0
           >- _dl_start             ld-2.19.so    1    1400980   13.9         19637            9.3
           >- _d_linit_internal     ld-2.19.so    1     448152    4.4         11094            5.3
           v-__libc_start_main@plt  ls            1    8211741   81.5        180397           85.4
              >- _dl_fixup          ld-2.19.so    1       7607    0.1           108            0.1
              >- __cxa_atexit       libc-2.19.so  1      11737    0.1            10            0.0
              >- __libc_csu_init    ls            1      10354    0.1            10            0.0
              |- _setjmp            libc-2.19.so  1          0    0.0             4            0.0
v- main ls 1 8182043 99.6 180254 99.9--- .../scripts/python/call-graph-from-postgresql.py | 327 +++++++++++++++++++++ tools/perf/scripts/python/export-to-postgresql.py | 47 +++ 2 files changed, 374 insertions(+)
tools/perf/scripts/python/call-graph-from-postgresql.py new file +327 -0
@@ -0,0 +1,327 @@ +#!/usr/bin/python2 +# call-graph-from-postgresql.py: create call-graph from postgresql database +# Copyright (c) 2014, Intel Corporation. +# +# This program is free software; you can redistribute it and/or modify it +# under the terms and conditions of the GNU General Public License, +# version 2, as published by the Free Software Foundation. +# +# This program is distributed in the hope it will be useful, but WITHOUT +# ANY WARRANTY; without even the implied warranty of MERCHANTABILITY or +# FITNESS FOR A PARTICULAR PURPOSE. See the GNU General Public License for +# more details. + +# To use this script you will need to have exported data using the +# export-to-postgresql.py script. Refer to that script for details. +# +# Following on from the example in the export-to-postgresql.py script, a +# call-graph can be displayed for the pt_example database like this: +# +# python tools/perf/scripts/python/call-graph-from-postgresql.py pt_example +# +# Note this script supports connecting to remote databases by setting hostname, +# port, username, password, and dbname e.g. +# +# python tools/perf/scripts/python/call-graph-from-postgresql.py "hostname=myhost username=myuser password=mypassword dbname=pt_example" +# +# The result is a GUI window with a tree representing a context-sensitive +# call-graph. Expanding a couple of levels of the tree and adjusting column +# widths to suit will display something like: +# +# Call Graph: pt_example +# Call Path Object Count Time(ns) Time(%) Branch Count Branch Count(%) +# v- ls +# v- 2638:2638 +# v- _start ld-2.19.so 1 10074071 100.0 211135 100.0 +# |- unknown unknown 1 13198 0.1 1 0.0 +# >- _dl_start ld-2.19.so 1 1400980 13.9 19637 9.3 +# >- _d_linit_internal ld-2.19.so 1 448152 4.4 11094 5.3 +# v-__libc_start_main@plt ls 1 8211741 81.5 180397 85.4 +# >- _dl_fixup ld-2.19.so 1 7607 0.1 108 0.1 +# >- __cxa_atexit libc-2.19.so 1 11737 0.1 10 0.0 +# >- __libc_csu_init ls 1 10354 0.1 10 0.0 +# |- _setjmp libc-2.19.so 1 0 0.0 4 0.0 +# v- main ls 1 8182043 99.6 180254 99.9 +# +# Points to note: +# The top level is a command name (comm) +# The next level is a thread (pid:tid) +# Subsequent levels are functions +# 'Count' is the number of calls +# 'Time' is the elapsed time until the function returns +# Percentages are relative to the level above +# 'Branch Count' is the total number of branches for that function and all +# functions that it calls + +import sys +from PySide.QtCore import * +from PySide.QtGui import * +from PySide.QtSql import * +from decimal import * + +class TreeItem(): + + def __init__(self, db, row, parent_item): + self.db = db + self.row = row + self.parent_item = parent_item + self.query_done = False; + self.child_count = 0 + self.child_items = [] + self.data = ["", "", "", "", "", "", ""] + self.comm_id = 0 + self.thread_id = 0 + self.call_path_id = 1 + self.branch_count = 0 + self.time = 0 + if not parent_item: + self.setUpRoot() + + def setUpRoot(self): + self.query_done = True + query = QSqlQuery(self.db) + ret = query.exec_('SELECT id, comm FROM comms') + if not ret: + raise Exception("Query failed: " + query.lastError().text()) + while query.next(): + if not query.value(0): + continue + child_item = TreeItem(self.db, self.child_count, self) + self.child_items.append(child_item) + self.child_count += 1 + child_item.setUpLevel1(query.value(0), query.value(1)) + + def setUpLevel1(self, comm_id, comm): + self.query_done = True; + self.comm_id = comm_id + self.data[0] = comm + self.child_items = [] + self.child_count = 0 + query = QSqlQuery(self.db) + ret = query.exec_('SELECT thread_id, ( SELECT pid FROM threads WHERE id = thread_id ), ( SELECT tid FROM threads WHERE id = thread_id ) FROM comm_threads WHERE comm_id = ' + str(comm_id)) + if not ret: + raise Exception("Query failed: " + query.lastError().text()) + while query.next(): + child_item = TreeItem(self.db, self.child_count, self) + self.child_items.append(child_item) + self.child_count += 1 + child_item.setUpLevel2(comm_id, query.value(0), query.value(1), query.value(2)) + + def setUpLevel2(self, comm_id, thread_id, pid, tid): + self.comm_id = comm_id + self.thread_id = thread_id + self.data[0] = str(pid) + ":" + str(tid) + + def getChildItem(self, row): + return self.child_items[row] + + def getParentItem(self): + return self.parent_item + + def getRow(self): + return self.row + + def timePercent(self, b): + if not self.time: + return "0.0" + x = (b * Decimal(100)) / self.time + return str(x.quantize(Decimal('.1'), rounding=ROUND_HALF_UP)) + + def branchPercent(self, b): + if not self.branch_count: + return "0.0" + x = (b * Decimal(100)) / self.branch_count + return str(x.quantize(Decimal('.1'), rounding=ROUND_HALF_UP)) + + def addChild(self, call_path_id, name, dso, count, time, branch_count): + child_item = TreeItem(self.db, self.child_count, self) + child_item.comm_id = self.comm_id + child_item.thread_id = self.thread_id + child_item.call_path_id = call_path_id + child_item.branch_count = branch_count + child_item.time = time + child_item.data[0] = name + if dso == "[kernel.kallsyms]": + dso = "[kernel]" + child_item.data[1] = dso + child_item.data[2] = str(count) + child_item.data[3] = str(time) + child_item.data[4] = self.timePercent(time) + child_item.data[5] = str(branch_count) + child_item.data[6] = self.branchPercent(branch_count) + self.child_items.append(child_item) + self.child_count += 1 + + def selectCalls(self): + self.query_done = True; + query = QSqlQuery(self.db) + ret = query.exec_('SELECT id, call_path_id, branch_count, call_time, return_time, ' + '( SELECT name FROM symbols WHERE id = ( SELECT symbol_id FROM call_paths WHERE id = call_path_id ) ), ' + '( SELECT short_name FROM dsos WHERE id = ( SELECT dso_id FROM symbols WHERE id = ( SELECT symbol_id FROM call_paths WHERE id = call_path_id ) ) ), ' + '( SELECT ip FROM call_paths where id = call_path_id ) ' + 'FROM calls WHERE parent_call_path_id = ' + str(self.call_path_id) + ' AND comm_id = ' + str(self.comm_id) + ' AND thread_id = ' + str(self.thread_id) + + 'ORDER BY call_path_id') + if not ret: + raise Exception("Query failed: " + query.lastError().text()) + last_call_path_id = 0 + name = "" + dso = "" + count = 0 + branch_count = 0 + total_branch_count = 0 + time = 0 + total_time = 0 + while query.next(): + if query.value(1) == last_call_path_id: + count += 1 + branch_count += query.value(2) + time += query.value(4) - query.value(3) + else: + if count: + self.addChild(last_call_path_id, name, dso, count, time, branch_count) + last_call_path_id = query.value(1) + name = query.value(5) + dso = query.value(6) + count = 1 + total_branch_count += branch_count + total_time += time + branch_count = query.value(2) + time = query.value(4) - query.value(3) + if count: + self.addChild(last_call_path_id, name, dso, count, time, branch_count) + total_branch_count += branch_count + total_time += time + # Top level does not have time or branch count, so fix that here + if total_branch_count > self.branch_count: + self.branch_count = total_branch_count + if self.branch_count: + for child_item in self.child_items: + child_item.data[6] = self.branchPercent(child_item.branch_count) + if total_time > self.time: + self.time = total_time + if self.time: + for child_item in self.child_items: + child_item.data[4] = self.timePercent(child_item.time) + + def childCount(self): + if not self.query_done: + self.selectCalls() + return self.child_count + + def columnCount(self): + return 7 + + def columnHeader(self, column): + headers = ["Call Path", "Object", "Count ", "Time (ns) ", "Time (%) ", "Branch Count ", "Branch Count (%) "] + return headers[column] + + def getData(self, column): + return self.data[column] + +class TreeModel(QAbstractItemModel): + + def __init__(self, db, parent=None): + super(TreeModel, self).__init__(parent) + self.db = db + self.root = TreeItem(db, 0, None) + + def columnCount(self, parent): + return self.root.columnCount() + + def rowCount(self, parent): + if parent.isValid(): + parent_item = parent.internalPointer() + else: + parent_item = self.root + return parent_item.childCount() + + def headerData(self, section, orientation, role): + if role == Qt.TextAlignmentRole: + if section > 1: + return Qt.AlignRight + if role != Qt.DisplayRole: + return None + if orientation != Qt.Horizontal: + return None + return self.root.columnHeader(section) + + def parent(self, child): + child_item = child.internalPointer() + if child_item is self.root: + return QModelIndex() + parent_item = child_item.getParentItem() + return self.createIndex(parent_item.getRow(), 0, parent_item) + + def index(self, row, column, parent): + if parent.isValid(): + parent_item = parent.internalPointer() + else: + parent_item = self.root + child_item = parent_item.getChildItem(row) + return self.createIndex(row, column, child_item) + + def data(self, index, role): + if role == Qt.TextAlignmentRole: + if index.column() > 1: + return Qt.AlignRight + if role != Qt.DisplayRole: + return None + index_item = index.internalPointer() + return index_item.getData(index.column()) + +class MainWindow(QMainWindow): + + def __init__(self, db, dbname, parent=None): + super(MainWindow, self).__init__(parent) + + self.setObjectName("MainWindow") + self.setWindowTitle("Call Graph: " + dbname) + self.move(100, 100) + self.resize(800, 600) + style = self.style() + icon = style.standardIcon(QStyle.SP_MessageBoxInformation) + self.setWindowIcon(icon); + + self.model = TreeModel(db) + + self.view = QTreeView() + self.view.setModel(self.model) + + self.setCentralWidget(self.view) + +if __name__ == '__main__': + if (len(sys.argv) < 2): + print >> sys.stderr, "Usage is: call-graph-from-postgresql.py <database name>" + raise Exception("Too few arguments") + + dbname = sys.argv[1] + + db = QSqlDatabase.addDatabase('QPSQL') + + opts = dbname.split() + for opt in opts: + if '=' in opt: + opt = opt.split('=') + if opt[0] == 'hostname': + db.setHostName(opt[1]) + elif opt[0] == 'port': + db.setPort(int(opt[1])) + elif opt[0] == 'username': + db.setUserName(opt[1]) + elif opt[0] == 'password': + db.setPassword(opt[1]) + elif opt[0] == 'dbname': + dbname = opt[1] + else: + dbname = opt + + db.setDatabaseName(dbname) + if not db.open(): + raise Exception("Failed to open database " + dbname + " error: " + db.lastError().text()) + + app = QApplication(sys.argv) + window = MainWindow(db, dbname) + window.show() + err = app.exec_() + db.close() + sys.exit(err)
tools/perf/scripts/python/export-to-postgresql.py +47 -0
53 lines not on this page · raw message
Adrian Hunter
reviewerPATCH v8 11/25 perf auxtrace: Fix period type 'i' not working
In reply to Adrian HunterPERF_ITRACE_PERIOD_INSTRUCTIONS is zero so it got overwritten by the default period type. Fix by checking if the period type was set rather than if the value was zero when applying the default.
---
 tools/perf/util/auxtrace.c | 6 +++++-
 1 file changed, 5 insertions(+), 1 deletion(-)
tools/perf/util/auxtrace.c +5 -1
@@ -949,6 +949,7 @@ int itrace_parse_synth_opts(const struct option *opt, const char *str,struct itrace_synth_opts *synth_opts = opt->value;const char *p;char *endptr; +bool period_type_set = false; synth_opts->set = true;
@@ -977,10 +978,12 @@ int itrace_parse_synth_opts(const struct option *opt, const char *str,case 'i' : synth_opts->period_type =PERF_ITRACE_PERIOD_INSTRUCTIONS ; + period_type_set = true;break ;case 't' : synth_opts->period_type =PERF_ITRACE_PERIOD_TICKS ; + period_type_set = true;break ;case 'm' : synth_opts->period *=1000 ;
@@ -993,6 +996,7 @@ int itrace_parse_synth_opts(const struct option *opt, const char *str, goto out_err; synth_opts->period_type =PERF_ITRACE_PERIOD_NANOSECS ; + period_type_set = true;break ;case '\0' : goto out;
@@ -1046,7 +1050,7 @@ int itrace_parse_synth_opts(const struct option *opt, const char *str, } out:if (synth_opts->instructions) { -if (!synth_opts->period_type) +if (!period_type_set) synth_opts->period_type =PERF_ITRACE_DEFAULT_PERIOD_TYPE ;if (!synth_opts->period)
Signature · 1 line
1.9.1
Re: [PATCH V8 11/25] perf auxtrace: Fix period type 'i' not working
Em Fri, Jul 17, 2015 at 07:33:46PM +0300, Adrian Hunter escreveu:
Quoted 5 lines
PERF_ITRACE_PERIOD_INSTRUCTIONSis zero so it got overwritten by the default period type. Fix by checking if the period type was set rather than if the value was zero when applying the default.
Applied
Quoted 49 lines
Signed-off-by Adrian Hunter <[email protected]>--- tools/perf/util/auxtrace.c | 6 +++++- 1 file changed, 5 insertions(+), 1 deletion(-)tools/perf/util/auxtrace.c +5
-1@@ -949,6 +949,7 @@ int itrace_parse_synth_opts(const struct option *opt, const char *str,struct itrace_synth_opts *synth_opts = opt->value;const char *p;char *endptr; +bool period_type_set = false; synth_opts->set = true;@@ -977,10 +978,12 @@ int itrace_parse_synth_opts(const struct option *opt, const char *str,case 'i' : synth_opts->period_type =PERF_ITRACE_PERIOD_INSTRUCTIONS ; + period_type_set = true;break ;case 't' : synth_opts->period_type =PERF_ITRACE_PERIOD_TICKS ; + period_type_set = true;break ;case 'm' : synth_opts->period *=1000 ;@@ -993,6 +996,7 @@ int itrace_parse_synth_opts(const struct option *opt, const char *str, goto out_err; synth_opts->period_type =PERF_ITRACE_PERIOD_NANOSECS ; + period_type_set = true;break ;case '\0' : goto out;@@ -1046,7 +1050,7 @@ int itrace_parse_synth_opts(const struct option *opt, const char *str, } out:if (synth_opts->instructions) { -if (!synth_opts->period_type) +if (!period_type_set) synth_opts->period_type =PERF_ITRACE_DEFAULT_PERIOD_TYPE ;if (!synth_opts->period)Signature · 1 line
1.9.1
tip-bot for Adrian Hunter
merge bot[tip:perf/core] perf auxtrace: Fix period type 'i' not working
In reply to Adrian Hunterperf auxtrace: Fix period type 'i' not working
Commit-ID: f70cfa07e3675a115265e32d6357272275358cdb Gitweb: http://git.kernel.org/tip/f70cfa07e3675a115265e32d6357272275358cdb Author: Adrian Hunter <[email protected]> AuthorDate: Fri, 17 Jul 2015 19:33:46 +0300 Committer: Arnaldo Carvalho de Melo <[email protected]> CommitDate: Thu, 6 Aug 2015 16:47:58 -0300
perf auxtrace: Fix period type 'i' not working
PERF_ITRACE_PERIOD_INSTRUCTIONS is zero so it got overwritten by the default period type.
Fix by checking if the period type was set rather than if the value was zero when applying the default.
---
 tools/perf/util/auxtrace.c | 6 +++++-
 1 file changed, 5 insertions(+), 1 deletion(-)
tools/perf/util/auxtrace.c +5 -1
@@ -942,6 +942,7 @@ int itrace_parse_synth_opts(const struct option *opt, const char *str,struct itrace_synth_opts *synth_opts = opt->value;const char *p;char *endptr; +bool period_type_set = false; synth_opts->set = true;
@@ -970,10 +971,12 @@ int itrace_parse_synth_opts(const struct option *opt, const char *str,case 'i' : synth_opts->period_type =PERF_ITRACE_PERIOD_INSTRUCTIONS ; + period_type_set = true;break ;case 't' : synth_opts->period_type =PERF_ITRACE_PERIOD_TICKS ; + period_type_set = true;break ;case 'm' : synth_opts->period *=1000 ;
@@ -986,6 +989,7 @@ int itrace_parse_synth_opts(const struct option *opt, const char *str, goto out_err; synth_opts->period_type =PERF_ITRACE_PERIOD_NANOSECS ; + period_type_set = true;break ;case '\0' : goto out;
@@ -1039,7 +1043,7 @@ int itrace_parse_synth_opts(const struct option *opt, const char *str, } out:if (synth_opts->instructions) { -if (!synth_opts->period_type) +if (!period_type_set) synth_opts->period_type =PERF_ITRACE_DEFAULT_PERIOD_TYPE ;if (!synth_opts->period)
Adrian Hunter
reviewerPATCH v8 12/25 perf tools: Fix perf-with-kcore handling of arguments containing spaces
In reply to Adrian HunterFix the perf-with-kcore script so that it doesn't
split arguments that contain spaces.
--- tools/perf/perf-with-kcore.sh | 28 ++++++++++++++-------------- 1 file changed, 14 insertions(+), 14 deletions(-)
tools/perf/perf-with-kcore.sh +14 -14
@@ -50,7 +50,7 @@ copy_kcore() fi rm -f perf.data.junk - ("$PERF" record -o perf.data.junk $PERF_OPTIONS -- sleep 60) >/dev/null 2>/dev/null & + ("$PERF" record -o perf.data.junk "${PERF_OPTIONS[@]}" -- sleep 60) >/dev/null 2>/dev/null & PERF_PID=$! # Need to make sure that perf has started
@@ -160,18 +160,18 @@ record() echo "*** WARNING *** /proc/sys/kernel/kptr_restrict prevents access to kernel addresses" >&2 fi - if echo "$PERF_OPTIONS" | grep -q ' -a \|^-a \| -a$\|^-a$\| --all-cpus \|^--all-cpus \| --all-cpus$\|^--all-cpus$' ; then + if echo "${PERF_OPTIONS[@]}" | grep -q ' -a \|^-a \| -a$\|^-a$\| --all-cpus \|^--all-cpus \| --all-cpus$\|^--all-cpus$' ; then echo "*** WARNING *** system-wide tracing without root access will not be able to read all necessary information from /proc" >&2 fi - if echo "$PERF_OPTIONS" | grep -q 'intel_pt\|intel_bts\| -I\|^-I' ; then + if echo "${PERF_OPTIONS[@]}" | grep -q 'intel_pt\|intel_bts\| -I\|^-I' ; then if [ "$(cat /proc/sys/kernel/perf_event_paranoid)" -gt -1 ] ; then echo "*** WARNING *** /proc/sys/kernel/perf_event_paranoid restricts buffer size and tracepoint (sched_switch) use" >&2 fi - if echo "$PERF_OPTIONS" | grep -q ' --per-thread \|^--per-thread \| --per-thread$\|^--per-thread$' ; then + if echo "${PERF_OPTIONS[@]}" | grep -q ' --per-thread \|^--per-thread \| --per-thread$\|^--per-thread$' ; then true - elif echo "$PERF_OPTIONS" | grep -q ' -t \|^-t \| -t$\|^-t$' ; then + elif echo "${PERF_OPTIONS[@]}" | grep -q ' -t \|^-t \| -t$\|^-t$' ; then true elif [ ! -r /sys/kernel/debug -o ! -x /sys/kernel/debug ] ; then echo "*** WARNING *** /sys/kernel/debug permissions prevent tracepoint (sched_switch) use" >&2
@@ -193,8 +193,8 @@ record() mkdir "$PERF_DATA_DIR" - echo "$PERF record -o $PERF_DATA_DIR/perf.data $PERF_OPTIONS -- $*" - "$PERF" record -o "$PERF_DATA_DIR/perf.data" $PERF_OPTIONS -- $* || true + echo "$PERF record -o $PERF_DATA_DIR/perf.data ${PERF_OPTIONS[@]} -- $@" + "$PERF" record -o "$PERF_DATA_DIR/perf.data" "${PERF_OPTIONS[@]}" -- "$@" || true if rmdir "$PERF_DATA_DIR" > /dev/null 2>/dev/null ; then exit 1
@@ -209,8 +209,8 @@ subcommand() { find_perf check_buildid_cache_permissions - echo "$PERF $PERF_SUB_COMMAND -i $PERF_DATA_DIR/perf.data --kallsyms=$PERF_DATA_DIR/kcore_dir/kallsyms $*" - "$PERF" $PERF_SUB_COMMAND -i "$PERF_DATA_DIR/perf.data" "--kallsyms=$PERF_DATA_DIR/kcore_dir/kallsyms" $* + echo "$PERF $PERF_SUB_COMMAND -i $PERF_DATA_DIR/perf.data --kallsyms=$PERF_DATA_DIR/kcore_dir/kallsyms $@" + "$PERF" $PERF_SUB_COMMAND -i "$PERF_DATA_DIR/perf.data" "--kallsyms=$PERF_DATA_DIR/kcore_dir/kallsyms" "$@" } if [ "$1" = "fix_buildid_cache_permissions" ] ; then
@@ -234,7 +234,7 @@ fi case "$PERF_SUB_COMMAND" in "record") while [ "$1" != "--" ] ; do - PERF_OPTIONS+="$1 " + PERF_OPTIONS+=("$1") shift || break done if [ "$1" != "--" ] ; then
@@ -242,16 +242,16 @@ case "$PERF_SUB_COMMAND" in usage fi shift - record $* + record "$@" ;; "script") - subcommand $* + subcommand "$@" ;; "report") - subcommand $* + subcommand "$@" ;; "inject") - subcommand $* + subcommand "$@" ;; *) usage
Signature · 1 line
1.9.1
Re: [PATCH V8 12/25] perf tools: Fix perf-with-kcore handling of arguments containing spaces
Em Fri, Jul 17, 2015 at 07:33:47PM +0300, Adrian Hunter escreveu:
Quoted 2 lines
Fix the perf-with-kcore script so that it doesn't
split arguments that contain spaces.
Applied
Quoted 95 lines
Signed-off-by Adrian Hunter <[email protected]>--- tools/perf/perf-with-kcore.sh | 28 ++++++++++++++-------------- 1 file changed, 14 insertions(+), 14 deletions(-)tools/perf/perf-with-kcore.sh +14
-14@@ -50,7 +50,7 @@ copy_kcore() fi rm -f perf.data.junk - ("$PERF" record -o perf.data.junk $PERF_OPTIONS -- sleep 60) >/dev/null 2>/dev/null & + ("$PERF" record -o perf.data.junk "${PERF_OPTIONS[@]}" -- sleep 60) >/dev/null 2>/dev/null & PERF_PID=$! # Need to make sure that perf has started@@ -160,18 +160,18 @@ record() echo "*** WARNING *** /proc/sys/kernel/kptr_restrict prevents access to kernel addresses" >&2 fi - if echo "$PERF_OPTIONS" | grep -q ' -a \|^-a \| -a$\|^-a$\| --all-cpus \|^--all-cpus \| --all-cpus$\|^--all-cpus$' ; then + if echo "${PERF_OPTIONS[@]}" | grep -q ' -a \|^-a \| -a$\|^-a$\| --all-cpus \|^--all-cpus \| --all-cpus$\|^--all-cpus$' ; then echo "*** WARNING *** system-wide tracing without root access will not be able to read all necessary information from /proc" >&2 fi - if echo "$PERF_OPTIONS" | grep -q 'intel_pt\|intel_bts\| -I\|^-I' ; then + if echo "${PERF_OPTIONS[@]}" | grep -q 'intel_pt\|intel_bts\| -I\|^-I' ; then if [ "$(cat /proc/sys/kernel/perf_event_paranoid)" -gt -1 ] ; then echo "*** WARNING *** /proc/sys/kernel/perf_event_paranoid restricts buffer size and tracepoint (sched_switch) use" >&2 fi - if echo "$PERF_OPTIONS" | grep -q ' --per-thread \|^--per-thread \| --per-thread$\|^--per-thread$' ; then + if echo "${PERF_OPTIONS[@]}" | grep -q ' --per-thread \|^--per-thread \| --per-thread$\|^--per-thread$' ; then true - elif echo "$PERF_OPTIONS" | grep -q ' -t \|^-t \| -t$\|^-t$' ; then + elif echo "${PERF_OPTIONS[@]}" | grep -q ' -t \|^-t \| -t$\|^-t$' ; then true elif [ ! -r /sys/kernel/debug -o ! -x /sys/kernel/debug ] ; then echo "*** WARNING *** /sys/kernel/debug permissions prevent tracepoint (sched_switch) use" >&2@@ -193,8 +193,8 @@ record() mkdir "$PERF_DATA_DIR" - echo "$PERF record -o $PERF_DATA_DIR/perf.data $PERF_OPTIONS -- $*" - "$PERF" record -o "$PERF_DATA_DIR/perf.data" $PERF_OPTIONS -- $* || true + echo "$PERF record -o $PERF_DATA_DIR/perf.data ${PERF_OPTIONS[@]} -- $@" + "$PERF" record -o "$PERF_DATA_DIR/perf.data" "${PERF_OPTIONS[@]}" -- "$@" || true if rmdir "$PERF_DATA_DIR" > /dev/null 2>/dev/null ; then exit 1@@ -209,8 +209,8 @@ subcommand() { find_perf check_buildid_cache_permissions - echo "$PERF $PERF_SUB_COMMAND -i $PERF_DATA_DIR/perf.data --kallsyms=$PERF_DATA_DIR/kcore_dir/kallsyms $*" - "$PERF" $PERF_SUB_COMMAND -i "$PERF_DATA_DIR/perf.data" "--kallsyms=$PERF_DATA_DIR/kcore_dir/kallsyms" $* + echo "$PERF $PERF_SUB_COMMAND -i $PERF_DATA_DIR/perf.data --kallsyms=$PERF_DATA_DIR/kcore_dir/kallsyms $@" + "$PERF" $PERF_SUB_COMMAND -i "$PERF_DATA_DIR/perf.data" "--kallsyms=$PERF_DATA_DIR/kcore_dir/kallsyms" "$@" } if [ "$1" = "fix_buildid_cache_permissions" ] ; then@@ -234,7 +234,7 @@ fi case "$PERF_SUB_COMMAND" in "record") while [ "$1" != "--" ] ; do - PERF_OPTIONS+="$1 " + PERF_OPTIONS+=("$1") shift || break done if [ "$1" != "--" ] ; then@@ -242,16 +242,16 @@ case "$PERF_SUB_COMMAND" in usage fi shift - record $* + record "$@" ;; "script") - subcommand $* + subcommand "$@" ;; "report") - subcommand $* + subcommand "$@" ;; "inject") - subcommand $* + subcommand "$@" ;; *) usageSignature · 1 line
1.9.1
tip-bot for Adrian Hunter
merge bot[tip:perf/core] perf tools: Fix perf-with-kcore handling of arguments containing spaces
In reply to Adrian Hunterperf tools: Fix perf-with-kcore handling of arguments containing spaces
Commit-ID: 8bd1b2d2578ca2688969352ed1f8a0a8f10dbb63 Gitweb: http://git.kernel.org/tip/8bd1b2d2578ca2688969352ed1f8a0a8f10dbb63 Author: Adrian Hunter <[email protected]> AuthorDate: Fri, 17 Jul 2015 19:33:47 +0300 Committer: Arnaldo Carvalho de Melo <[email protected]> CommitDate: Thu, 6 Aug 2015 16:48:27 -0300
perf tools: Fix perf-with-kcore handling of arguments containing spaces
Fix the perf-with-kcore script so that it doesn't split arguments that contain spaces.
--- tools/perf/perf-with-kcore.sh | 28 ++++++++++++++-------------- 1 file changed, 14 insertions(+), 14 deletions(-)
tools/perf/perf-with-kcore.sh +14 -14
@@ -50,7 +50,7 @@ copy_kcore() fi rm -f perf.data.junk - ("$PERF" record -o perf.data.junk $PERF_OPTIONS -- sleep 60) >/dev/null 2>/dev/null & + ("$PERF" record -o perf.data.junk "${PERF_OPTIONS[@]}" -- sleep 60) >/dev/null 2>/dev/null & PERF_PID=$! # Need to make sure that perf has started
@@ -160,18 +160,18 @@ record() echo "*** WARNING *** /proc/sys/kernel/kptr_restrict prevents access to kernel addresses" >&2 fi - if echo "$PERF_OPTIONS" | grep -q ' -a \|^-a \| -a$\|^-a$\| --all-cpus \|^--all-cpus \| --all-cpus$\|^--all-cpus$' ; then + if echo "${PERF_OPTIONS[@]}" | grep -q ' -a \|^-a \| -a$\|^-a$\| --all-cpus \|^--all-cpus \| --all-cpus$\|^--all-cpus$' ; then echo "*** WARNING *** system-wide tracing without root access will not be able to read all necessary information from /proc" >&2 fi - if echo "$PERF_OPTIONS" | grep -q 'intel_pt\|intel_bts\| -I\|^-I' ; then + if echo "${PERF_OPTIONS[@]}" | grep -q 'intel_pt\|intel_bts\| -I\|^-I' ; then if [ "$(cat /proc/sys/kernel/perf_event_paranoid)" -gt -1 ] ; then echo "*** WARNING *** /proc/sys/kernel/perf_event_paranoid restricts buffer size and tracepoint (sched_switch) use" >&2 fi - if echo "$PERF_OPTIONS" | grep -q ' --per-thread \|^--per-thread \| --per-thread$\|^--per-thread$' ; then + if echo "${PERF_OPTIONS[@]}" | grep -q ' --per-thread \|^--per-thread \| --per-thread$\|^--per-thread$' ; then true - elif echo "$PERF_OPTIONS" | grep -q ' -t \|^-t \| -t$\|^-t$' ; then + elif echo "${PERF_OPTIONS[@]}" | grep -q ' -t \|^-t \| -t$\|^-t$' ; then true elif [ ! -r /sys/kernel/debug -o ! -x /sys/kernel/debug ] ; then echo "*** WARNING *** /sys/kernel/debug permissions prevent tracepoint (sched_switch) use" >&2
@@ -193,8 +193,8 @@ record() mkdir "$PERF_DATA_DIR" - echo "$PERF record -o $PERF_DATA_DIR/perf.data $PERF_OPTIONS -- $*" - "$PERF" record -o "$PERF_DATA_DIR/perf.data" $PERF_OPTIONS -- $* || true + echo "$PERF record -o $PERF_DATA_DIR/perf.data ${PERF_OPTIONS[@]} -- $@" + "$PERF" record -o "$PERF_DATA_DIR/perf.data" "${PERF_OPTIONS[@]}" -- "$@" || true if rmdir "$PERF_DATA_DIR" > /dev/null 2>/dev/null ; then exit 1
@@ -209,8 +209,8 @@ subcommand() { find_perf check_buildid_cache_permissions - echo "$PERF $PERF_SUB_COMMAND -i $PERF_DATA_DIR/perf.data --kallsyms=$PERF_DATA_DIR/kcore_dir/kallsyms $*" - "$PERF" $PERF_SUB_COMMAND -i "$PERF_DATA_DIR/perf.data" "--kallsyms=$PERF_DATA_DIR/kcore_dir/kallsyms" $* + echo "$PERF $PERF_SUB_COMMAND -i $PERF_DATA_DIR/perf.data --kallsyms=$PERF_DATA_DIR/kcore_dir/kallsyms $@" + "$PERF" $PERF_SUB_COMMAND -i "$PERF_DATA_DIR/perf.data" "--kallsyms=$PERF_DATA_DIR/kcore_dir/kallsyms" "$@" } if [ "$1" = "fix_buildid_cache_permissions" ] ; then
@@ -234,7 +234,7 @@ fi case "$PERF_SUB_COMMAND" in "record") while [ "$1" != "--" ] ; do - PERF_OPTIONS+="$1 " + PERF_OPTIONS+=("$1") shift || break done if [ "$1" != "--" ] ; then
@@ -242,16 +242,16 @@ case "$PERF_SUB_COMMAND" in usage fi shift - record $* + record "$@" ;; "script") - subcommand $* + subcommand "$@" ;; "report") - subcommand $* + subcommand "$@" ;; "inject") - subcommand $* + subcommand "$@" ;; *) usage
Adrian Hunter
reviewerPATCH v8 13/25 perf tools: Fix Intel PT 'instructions' sample period
In reply to Adrian HunterThe period on synthesized 'instructions' samples was being set to a fixed value, whereas the correct value is the number of instructions since the last sample, which is a value that the decoder can provide. So do it that way.
--- tools/perf/util/intel-pt-decoder/intel-pt-decoder.c | 3 +++ tools/perf/util/intel-pt-decoder/intel-pt-decoder.h | 1 + tools/perf/util/intel-pt.c | 5 ++++- 3 files changed, 8 insertions(+), 1 deletion(-)
tools/perf/util/intel-pt-decoder/intel-pt-decoder.c +3 -0
@@ -108,6 +108,7 @@ struct intel_pt_decoder {uint64_t sign_bits;uint64_t period;enum intel_pt_period_type period_type; +uint64_t tot_insn_cnt;uint64_t period_insn_cnt;uint64_t period_mask;uint64_t period_ticks;
@@ -559,6 +560,7 @@ static int intel_pt_walk_insn(struct intel_pt_decoder *decoder, err = decoder->walk_insn (intel_pt_insn, &insn_cnt, &decoder->ip, ip, max_insn_cnt, decoder->data); + decoder->tot_insn_cnt += insn_cnt; decoder->timestamp_insn_cnt += insn_cnt; decoder->period_insn_cnt += insn_cnt;
@@ -1529,6 +1531,7 @@ const struct intel_pt_state *intel_pt_decode(struct intel_pt_decoder *decoder) decoder->state.timestamp = decoder->timestamp; decoder->state.est_timestamp =intel_pt_est_timestamp (decoder); decoder->state.cr3 = decoder->cr3; + decoder->state.tot_insn_cnt = decoder->tot_insn_cnt;if (err) decoder->state.from_ip = decoder->ip;
tools/perf/util/intel-pt-decoder/intel-pt-decoder.h +1 -0
@@ -58,6 +58,7 @@ struct intel_pt_state {uint64_t from_ip;uint64_t to_ip;uint64_t cr3; +uint64_t tot_insn_cnt;uint64_t timestamp;uint64_t est_timestamp;uint64_t trace_nr;
tools/perf/util/intel-pt.c +4 -1
@@ -126,6 +126,7 @@ struct intel_pt_queue {u64 timestamp;u32 flags;u16 insn_len; +u64 last_insn_cnt; }; static void intel_pt_dump(struct intel_pt *pt __maybe_unused,
@@ -920,11 +921,13 @@ static int intel_pt_synth_instruction_sample(struct intel_pt_queue *ptq) sample.addr = ptq->state->to_ip; sample.id = ptq->pt->instructions_id; sample.stream_id = ptq->pt->instructions_id; - sample.period = ptq->pt->instructions_sample_period; + sample.period = ptq->state->tot_insn_cnt - ptq->last_insn_cnt; sample.cpu = ptq->cpu; sample.flags = ptq->flags; sample.insn_len = ptq->insn_len; + ptq->last_insn_cnt = ptq->state->tot_insn_cnt; +if (pt->synth_opts.callchain) {thread_stack__sample (ptq->thread, ptq->chain, pt->synth_opts.callchain_sz, sample.ip);
Signature · 1 line
1.9.1
tip-bot for Adrian Hunter
merge bot[tip:perf/core] perf tools: Fix Intel PT 'instructions' sample period
perf tools: Fix Intel PT 'instructions' sample period
Commit-ID: 2a21d03686881331b0af0471588674e7e896eeb2 Gitweb: http://git.kernel.org/tip/2a21d03686881331b0af0471588674e7e896eeb2 Author: Adrian Hunter <[email protected]> AuthorDate: Fri, 17 Jul 2015 19:33:48 +0300 Committer: Arnaldo Carvalho de Melo <[email protected]> CommitDate: Mon, 24 Aug 2015 17:42:26 -0300
perf tools: Fix Intel PT 'instructions' sample period
The period on synthesized 'instructions' samples was being set to a fixed value, whereas the correct value is the number of instructions since the last sample, which is a value that the decoder can provide. So do it that way.
--- tools/perf/util/intel-pt-decoder/intel-pt-decoder.c | 3 +++ tools/perf/util/intel-pt-decoder/intel-pt-decoder.h | 1 + tools/perf/util/intel-pt.c | 5 ++++- 3 files changed, 8 insertions(+), 1 deletion(-)
tools/perf/util/intel-pt-decoder/intel-pt-decoder.c +3 -0
@@ -108,6 +108,7 @@ struct intel_pt_decoder {uint64_t sign_bits;uint64_t period;enum intel_pt_period_type period_type; +uint64_t tot_insn_cnt;uint64_t period_insn_cnt;uint64_t period_mask;uint64_t period_ticks;
@@ -559,6 +560,7 @@ static int intel_pt_walk_insn(struct intel_pt_decoder *decoder, err = decoder->walk_insn (intel_pt_insn, &insn_cnt, &decoder->ip, ip, max_insn_cnt, decoder->data); + decoder->tot_insn_cnt += insn_cnt; decoder->timestamp_insn_cnt += insn_cnt; decoder->period_insn_cnt += insn_cnt;
@@ -1529,6 +1531,7 @@ const struct intel_pt_state *intel_pt_decode(struct intel_pt_decoder *decoder) decoder->state.timestamp = decoder->timestamp; decoder->state.est_timestamp =intel_pt_est_timestamp (decoder); decoder->state.cr3 = decoder->cr3; + decoder->state.tot_insn_cnt = decoder->tot_insn_cnt;if (err) decoder->state.from_ip = decoder->ip;
tools/perf/util/intel-pt-decoder/intel-pt-decoder.h +1 -0
@@ -58,6 +58,7 @@ struct intel_pt_state {uint64_t from_ip;uint64_t to_ip;uint64_t cr3; +uint64_t tot_insn_cnt;uint64_t timestamp;uint64_t est_timestamp;uint64_t trace_nr;
tools/perf/util/intel-pt.c +4 -1
@@ -126,6 +126,7 @@ struct intel_pt_queue {u64 timestamp;u32 flags;u16 insn_len; +u64 last_insn_cnt; }; static void intel_pt_dump(struct intel_pt *pt __maybe_unused,
@@ -920,11 +921,13 @@ static int intel_pt_synth_instruction_sample(struct intel_pt_queue *ptq) sample.addr = ptq->state->to_ip; sample.id = ptq->pt->instructions_id; sample.stream_id = ptq->pt->instructions_id; - sample.period = ptq->pt->instructions_sample_period; + sample.period = ptq->state->tot_insn_cnt - ptq->last_insn_cnt; sample.cpu = ptq->cpu; sample.flags = ptq->flags; sample.insn_len = ptq->insn_len; + ptq->last_insn_cnt = ptq->state->tot_insn_cnt; +if (pt->synth_opts.callchain) {thread_stack__sample (ptq->thread, ptq->chain, pt->synth_opts.callchain_sz, sample.ip);
Adrian Hunter
reviewerPATCH v8 14/25 perf tools: Add perf_pmu__format_bits()
In reply to Adrian HunterAdd perf_pmu__format_bits() to get the format bits for a PMU config term. Intel PT will use this to validate terms and to record format bits to enable later interpreting the config from the attribute stored in the perf.data file.
--- tools/perf/util/pmu.c | 17 ++++++++++++++++- tools/perf/util/pmu.h | 1 + 2 files changed, 17 insertions(+), 1 deletion(-)
tools/perf/util/pmu.c +16 -1
@@ -538,7 +538,7 @@ struct perf_pmu *perf_pmu__find(const char *name) }static struct perf_pmu_format * -pmu_find_format (struct list_head *formats,char *name) +pmu_find_format (struct list_head *formats,const char *name) {struct perf_pmu_format *format;
@@ -549,6 +549,21 @@ pmu_find_format(struct list_head *formats, char *name)return NULL ; } +__u64 perf_pmu__format_bits (struct list_head *formats,const char *name) +{ +struct perf_pmu_format *format =pmu_find_format (formats, name); +__u64 bits =0 ; +int fbit; + +if (!format) +return 0 ; + +for_each_set_bit (fbit, format->bits,PERF_PMU_FORMAT_BITS ) + bits |=1ULL << fbit; + +return bits; +} +/* * Sets value based on the format definition (format parameter) * and unformated value (value parameter).
tools/perf/util/pmu.h +1 -0
@@ -54,6 +54,7 @@ int perf_pmu__config_terms(struct list_head *formats,struct perf_event_attr *attr, struct list_head *head_terms, bool zero, struct parse_events_error *error); +__u64 perf_pmu__format_bits (struct list_head *formats,const char *name);int perf_pmu__check_alias (struct perf_pmu *pmu,struct list_head *head_terms,struct perf_pmu_info *info); struct list_head *perf_pmu__alias(struct perf_pmu *pmu,
Signature · 1 line
1.9.1
Re: [PATCH V8 14/25] perf tools: Add perf_pmu__format_bits()
Em Fri, Jul 17, 2015 at 07:33:49PM +0300, Adrian Hunter escreveu:
Quoted 5 lines
Add
perf_pmu__format_bits()to get the format bits for a PMU config term. Intel PT will use this to validate terms and to record format bits to enable later interpreting the config from the attribute stored in the perf.data file.
Applied
Quoted 55 lines
Signed-off-by Adrian Hunter <[email protected]>--- tools/perf/util/pmu.c | 17 ++++++++++++++++- tools/perf/util/pmu.h | 1 + 2 files changed, 17 insertions(+), 1 deletion(-)tools/perf/util/pmu.c +16
-1@@ -538,7 +538,7 @@ struct perf_pmu *perf_pmu__find(const char *name) }static struct perf_pmu_format * -pmu_find_format (struct list_head *formats,char *name) +pmu_find_format (struct list_head *formats,const char *name) {struct perf_pmu_format *format;@@ -549,6 +549,21 @@ pmu_find_format(struct list_head *formats, char *name)return NULL ; } +__u64 perf_pmu__format_bits (struct list_head *formats,const char *name) +{ +struct perf_pmu_format *format =pmu_find_format (formats, name); +__u64 bits =0 ; +int fbit; + +if (!format) +return 0 ; + +for_each_set_bit (fbit, format->bits,PERF_PMU_FORMAT_BITS ) + bits |=1ULL << fbit; + +return bits; +} +/* * Sets value based on the format definition (format parameter) * and unformated value (value parameter). tools/perf/util/pmu.h +1
-0@@ -54,6 +54,7 @@ int perf_pmu__config_terms(struct list_head *formats,struct perf_event_attr *attr, struct list_head *head_terms, bool zero, struct parse_events_error *error); +__u64 perf_pmu__format_bits (struct list_head *formats,const char *name);int perf_pmu__check_alias (struct perf_pmu *pmu,struct list_head *head_terms,struct perf_pmu_info *info); struct list_head *perf_pmu__alias(struct perf_pmu *pmu,Signature · 1 line
1.9.1
tip-bot for Adrian Hunter
merge bot[tip:perf/core] perf tools: Add perf_pmu__format_bits()
In reply to Adrian Hunterperf tools: Add perf_pmu__format_bits()
Commit-ID: 09ff607176ab2bf7e038150100fdf9290a6fbe47 Gitweb: http://git.kernel.org/tip/09ff607176ab2bf7e038150100fdf9290a6fbe47 Author: Adrian Hunter <[email protected]> AuthorDate: Fri, 17 Jul 2015 19:33:49 +0300 Committer: Arnaldo Carvalho de Melo <[email protected]> CommitDate: Thu, 6 Aug 2015 16:49:01 -0300
perf tools: Add perf_pmu__format_bits()
Add perf_pmu__format_bits() to get the format bits for a PMU config term. Intel PT will use this to validate terms and to record format bits to enable later interpreting the config from the attribute stored in the perf.data file.
--- tools/perf/util/pmu.c | 17 ++++++++++++++++- tools/perf/util/pmu.h | 1 + 2 files changed, 17 insertions(+), 1 deletion(-)
tools/perf/util/pmu.c +16 -1
@@ -542,7 +542,7 @@ struct perf_pmu *perf_pmu__find(const char *name) }static struct perf_pmu_format * -pmu_find_format (struct list_head *formats,char *name) +pmu_find_format (struct list_head *formats,const char *name) {struct perf_pmu_format *format;
@@ -553,6 +553,21 @@ pmu_find_format(struct list_head *formats, char *name)return NULL ; } +__u64 perf_pmu__format_bits (struct list_head *formats,const char *name) +{ +struct perf_pmu_format *format =pmu_find_format (formats, name); +__u64 bits =0 ; +int fbit; + +if (!format) +return 0 ; + +for_each_set_bit (fbit, format->bits,PERF_PMU_FORMAT_BITS ) + bits |=1ULL << fbit; + +return bits; +} +/* * Sets value based on the format definition (format parameter) * and unformated value (value parameter).
tools/perf/util/pmu.h +1 -0
@@ -54,6 +54,7 @@ int perf_pmu__config_terms(struct list_head *formats,struct perf_event_attr *attr, struct list_head *head_terms, bool zero, struct parse_events_error *error); +__u64 perf_pmu__format_bits (struct list_head *formats,const char *name);int perf_pmu__check_alias (struct perf_pmu *pmu,struct list_head *head_terms,struct perf_pmu_info *info); struct list_head *perf_pmu__alias(struct perf_pmu *pmu,
Adrian Hunter
reviewerPATCH v8 15/25 perf tools: Validate config term maximum value
In reply to Adrian HunterCurrently the value of a PMU config term is silently truncated if it is too big. This is an impediment to validating the value for other criteria later on i.e. the user provides an invalid value that gets truncated to a valid one.
The maximum value validation is only done for the parser where the error is passed back to the user. In other cases the silent truncation continues so as not to affect tools that perhaps rely on it.
--- tools/perf/util/pmu.c | 30 +++++++++++++++++++++++++++++- 1 file changed, 29 insertions(+), 1 deletion(-)
tools/perf/util/pmu.c +29 -1
@@ -585,6 +585,18 @@ static void pmu_format_value(unsigned long *format, __u64 value, __u64 *v, } } +static __u64 pmu_format_max_value (const unsigned long *format) +{ +int w; + + w =bitmap_weight (format,PERF_PMU_FORMAT_BITS ); +if (!w) +return 0 ; +if (w <64 ) +return (1ULL << w) -1 ; +return -1 ; +} +/* * Term is a string term, and might be a param-term. Try to look up it's value * in the remaining terms.
@@ -658,7 +670,7 @@ static int pmu_config_term(struct list_head *formats, {struct perf_pmu_format *format;__u64 *vp; -__u64 val; +__u64 val, max_val;/* * If this is a parameter we've already used for parameterized-eval,
@@ -724,6 +736,22 @@ static int pmu_config_term(struct list_head *formats, }else return -EINVAL ; + max_val =pmu_format_max_value (format->bits); +if (val > max_val) { +if (err) { + err->idx = term->err_val; +if (asprintf (&err->str, +"value too big for format, maximum is %llu" , + (unsigned long long )max_val) <0 ) + err->str =strdup ("value too big for format" ); +return -EINVAL ; + } +/* +* Assume we don't care if !err, in which case the value will be +* silently truncated. +*/ + } +pmu_format_value (format->bits, val, vp, zero);return 0 ; }
Signature · 1 line
1.9.1
Re: [PATCH V8 15/25] perf tools: Validate config term maximum value
Em Fri, Jul 17, 2015 at 07:33:50PM +0300, Adrian Hunter escreveu:
Quoted 5 lines
Currently the value of a PMU config term is silently truncated if it is too big. This is an impediment to validating the value for other criteria later on i.e. the user provides an invalid value that gets truncated to a valid one.
Applied
Quoted 67 lines
The maximum value validation is only done for the parser where the error is passed back to the user. In other cases the silent truncation continues so as not to affect tools that perhaps rely on it.
Signed-off-by Adrian Hunter <[email protected]>--- tools/perf/util/pmu.c | 30 +++++++++++++++++++++++++++++- 1 file changed, 29 insertions(+), 1 deletion(-)tools/perf/util/pmu.c +29
-1@@ -585,6 +585,18 @@ static void pmu_format_value(unsigned long *format, __u64 value, __u64 *v, } } +static __u64 pmu_format_max_value (const unsigned long *format) +{ +int w; + + w =bitmap_weight (format,PERF_PMU_FORMAT_BITS ); +if (!w) +return 0 ; +if (w <64 ) +return (1ULL << w) -1 ; +return -1 ; +} +/* * Term is a string term, and might be a param-term. Try to look up it's value * in the remaining terms. @@ -658,7 +670,7 @@ static int pmu_config_term(struct list_head *formats, {struct perf_pmu_format *format;__u64 *vp; -__u64 val; +__u64 val, max_val;/* * If this is a parameter we've already used for parameterized-eval, @@ -724,6 +736,22 @@ static int pmu_config_term(struct list_head *formats, }else return -EINVAL ; + max_val =pmu_format_max_value (format->bits); +if (val > max_val) { +if (err) { + err->idx = term->err_val; +if (asprintf (&err->str, +"value too big for format, maximum is %llu" , + (unsigned long long )max_val) <0 ) + err->str =strdup ("value too big for format" ); +return -EINVAL ; + } +/* +* Assume we don't care if !err, in which case the value will be +* silently truncated. +*/ + } +pmu_format_value (format->bits, val, vp, zero);return 0 ; }Signature · 1 line
1.9.1
tip-bot for Adrian Hunter
merge bot[tip:perf/core] perf tools: Validate config term maximum value
In reply to Adrian Hunterperf tools: Validate config term maximum value
Commit-ID: 0efe6b67690b6546daa0d2f34a17eb3ca46c9dea Gitweb: http://git.kernel.org/tip/0efe6b67690b6546daa0d2f34a17eb3ca46c9dea Author: Adrian Hunter <[email protected]> AuthorDate: Fri, 17 Jul 2015 19:33:50 +0300 Committer: Arnaldo Carvalho de Melo <[email protected]> CommitDate: Thu, 6 Aug 2015 16:49:28 -0300
perf tools: Validate config term maximum value
Currently the value of a PMU config term is silently truncated if it is too big. This is an impediment to validating the value for other criteria later on i.e. the user provides an invalid value that gets truncated to a valid one.
The maximum value validation is only done for the parser where the error is passed back to the user. In other cases the silent truncation continues so as not to affect tools that perhaps rely on it.
--- tools/perf/util/pmu.c | 30 +++++++++++++++++++++++++++++- 1 file changed, 29 insertions(+), 1 deletion(-)
tools/perf/util/pmu.c +29 -1
@@ -589,6 +589,18 @@ static void pmu_format_value(unsigned long *format, __u64 value, __u64 *v, } } +static __u64 pmu_format_max_value (const unsigned long *format) +{ +int w; + + w =bitmap_weight (format,PERF_PMU_FORMAT_BITS ); +if (!w) +return 0 ; +if (w <64 ) +return (1ULL << w) -1 ; +return -1 ; +} +/* * Term is a string term, and might be a param-term. Try to look up it's value * in the remaining terms.
@@ -662,7 +674,7 @@ static int pmu_config_term(struct list_head *formats, {struct perf_pmu_format *format;__u64 *vp; -__u64 val; +__u64 val, max_val;/* * If this is a parameter we've already used for parameterized-eval,
@@ -728,6 +740,22 @@ static int pmu_config_term(struct list_head *formats, }else return -EINVAL ; + max_val =pmu_format_max_value (format->bits); +if (val > max_val) { +if (err) { + err->idx = term->err_val; +if (asprintf (&err->str, +"value too big for format, maximum is %llu" , + (unsigned long long )max_val) <0 ) + err->str =strdup ("value too big for format" ); +return -EINVAL ; + } +/* +* Assume we don't care if !err, in which case the value will be +* silently truncated. +*/ + } +pmu_format_value (format->bits, val, vp, zero);return 0 ; }
Adrian Hunter
reviewerPATCH v8 16/25 perf tools: Extend the event parser maximum error index
In reply to Adrian HunterExtend the event parser maximum error index from 10 to 13. That allows PMU config terms of up to 10 characters to display un-truncated in the error message.
--- tools/perf/util/parse-events.c | 2 +- 1 file changed, 1 insertion(+), 1 deletion(-)
tools/perf/util/parse-events.c +1 -1
@@ -1105,7 +1105,7 @@ static void parse_events_print_error(struct parse_events_error *err,* Maximum error index indent, we will cut * the event string if it's bigger. */ -int max_err_idx =10 ; +int max_err_idx =13 ;/* * Let's be specific with the message when
Signature · 1 line
1.9.1
Re: [PATCH V8 16/25] perf tools: Extend the event parser maximum error index
Em Fri, Jul 17, 2015 at 07:33:51PM +0300, Adrian Hunter escreveu:
Quoted 4 lines
Extend the event parser maximum error index from 10 to 13. That allows PMU config terms of up to 10 characters to display un-truncated in the error message.
Applied
Quoted 20 lines
Signed-off-by Adrian Hunter <[email protected]>--- tools/perf/util/parse-events.c | 2 +- 1 file changed, 1 insertion(+), 1 deletion(-)tools/perf/util/parse-events.c +1
-1@@ -1105,7 +1105,7 @@ static void parse_events_print_error(struct parse_events_error *err,* Maximum error index indent, we will cut * the event string if it's bigger. */ -int max_err_idx =10 ; +int max_err_idx =13 ;/* * Let's be specific with the message when Signature · 1 line
1.9.1
tip-bot for Adrian Hunter
merge bot[tip:perf/core] perf tools: Extend the event parser maximum error index
In reply to Adrian Hunterperf tools: Extend the event parser maximum error index
Commit-ID: 141b2d3161f19a774b3ceaa8faed5e63484a4684 Gitweb: http://git.kernel.org/tip/141b2d3161f19a774b3ceaa8faed5e63484a4684 Author: Adrian Hunter <[email protected]> AuthorDate: Fri, 17 Jul 2015 19:33:51 +0300 Committer: Arnaldo Carvalho de Melo <[email protected]> CommitDate: Thu, 6 Aug 2015 16:49:44 -0300
perf tools: Extend the event parser maximum error index
Extend the event parser maximum error index from 10 to 13. That allows PMU config terms of up to 10 characters to display un-truncated in the error message.
--- tools/perf/util/parse-events.c | 2 +- 1 file changed, 1 insertion(+), 1 deletion(-)
tools/perf/util/parse-events.c +1 -1
@@ -1168,7 +1168,7 @@ static void parse_events_print_error(struct parse_events_error *err,* Maximum error index indent, we will cut * the event string if it's bigger. */ -int max_err_idx =10 ; +int max_err_idx =13 ;/* * Let's be specific with the message when
Adrian Hunter
reviewerPATCH v8 17/25 perf tools: Add Intel PT support for PSB periods
In reply to Adrian HunterThe PSB packet is a synchronization packet that provides a starting point for decoding or recovery from errors.
This patch adds support for a new Intel PT feature that allows the frequency of PSB packets to be specified.
Support for this feature is indicated by /sys/bus/event_source/devices/intel_pt/caps/psb_cyc which contains "1" if the feature is supported and "0" otherwise.
The PSB period can be specified as a PMU config term e.g. perf record -e intel_pt/psb_period=2/u sleep 1
The default value is 3 or the nearest lower value that is supported. 0 is always supported.
Valid values are given by:/sys/bus/event_source/devices/intel_pt/caps/psb_periods which contains a hexadecimal value, the bits of which represent valid values e.g. bit 2 set means value 2 is valid.
The value is converted to the approximate number of trace bytes between PSB packets as:
2 ^ (value + 11)
e.g. value 3 means 16KiB bytes between PSBs
If an invalid value is entered, the error message will give a list of valid values e.g.
$ perf record -e intel_pt/psb_period=15/u uname Invalid psb_period for intel_pt. Valid values are: 0-5
tools/perf/Documentation/intel-pt.txt is updated in a later patch as there are a number of new features being added.
For more information about PSB periods refer to the Intel 64 and IA-32 Architectures SDM Chapter 36 Intel Processor Trace from June 2015 or later.
--- tools/perf/arch/x86/util/intel-pt.c | 217 ++++++++++++++++++++++++++++++++++-- 1 file changed, 210 insertions(+), 7 deletions(-)
tools/perf/arch/x86/util/intel-pt.c +210 -7
@@ -99,17 +99,121 @@ static int intel_pt_parse_terms(struct list_head *formats, const char *str,return intel_pt_parse_terms_with_default (formats, str, config); } -static size_t intel_pt_psb_period (struct perf_pmu *intel_pt_pmu__maybe_unused , -struct perf_evlist *evlist__maybe_unused ) +static u64 intel_pt_masked_bits (u64 mask,u64 bits) { -return 256 ; +const u64 top_bit =1ULL <<63 ; +u64 res =0 ; +int i; + +for (i =0 ; i <64 ; i++) { +if (mask & top_bit) { + res <<=1 ; +if (bits & top_bit) + res |=1 ; + } + mask <<=1 ; + bits <<=1 ; + } + +return res; +} + +static int intel_pt_read_config (struct perf_pmu *intel_pt_pmu,const char *str, +struct perf_evlist *evlist,u64 *res) +{ +struct perf_evsel *evsel; +u64 mask; + + *res =0 ; + + mask =perf_pmu__format_bits (&intel_pt_pmu->format, str); +if (!mask) +return -EINVAL ; + +evlist__for_each (evlist, evsel) { +if (evsel->attr.type == intel_pt_pmu->type) { + *res =intel_pt_masked_bits (mask, evsel->attr.config); +return 0 ; + } + } + +return -EINVAL ; +} + +static size_t intel_pt_psb_period (struct perf_pmu *intel_pt_pmu, +struct perf_evlist *evlist) +{ +u64 val; +int err, topa_multiple_entries; +size_t psb_period; + +if (perf_pmu__scan_file (intel_pt_pmu,"caps/topa_multiple_entries" , +"%d" , &topa_multiple_entries) !=1 ) + topa_multiple_entries =0 ; + +/* +* Use caps/topa_multiple_entries to indicate early hardware that had +* extra frequent PSBs. +*/ +if (!topa_multiple_entries) { + psb_period =256 ; + goto out; + } + + err =intel_pt_read_config (intel_pt_pmu,"psb_period" , evlist, &val); +if (err) + val =0 ; + + psb_period =1 << (val +11 ); +out: +pr_debug2 ("%s psb_period %zu\n" , intel_pt_pmu->name, psb_period); +return psb_period; +} + +static int intel_pt_pick_bit (int bits,int target) +{ +int pos, pick =-1 ; + +for (pos =0 ; bits; bits >>=1 , pos++) { +if (bits &1 ) { +if (pos <= target || pick <0 ) + pick = pos; +if (pos >= target) +break ; + } + } + +return pick; }static u64 intel_pt_default_config (struct perf_pmu *intel_pt_pmu) { +char buf[256 ]; +int psb_cyc, psb_periods, psb_period; +int pos =0 ;u64 config; -intel_pt_parse_terms (&intel_pt_pmu->format,"tsc" , &config); + pos +=scnprintf (buf + pos,sizeof (buf) - pos,"tsc" ); + +if (perf_pmu__scan_file (intel_pt_pmu,"caps/psb_cyc" ,"%d" , + &psb_cyc) !=1 ) + psb_cyc =1 ; + +if (psb_cyc) { +if (perf_pmu__scan_file (intel_pt_pmu,"caps/psb_periods" ,"%x" , + &psb_periods) !=1 ) + psb_periods =0 ; +if (psb_periods) { + psb_period =intel_pt_pick_bit (psb_periods,3 ); + pos +=scnprintf (buf + pos,sizeof (buf) - pos, +",psb_period=%d" , psb_period); + } + } + +pr_debug2 ("%s default config: %s\n" , intel_pt_pmu->name, buf); + +intel_pt_parse_terms (&intel_pt_pmu->format, buf, &config); +return config; }
@@ -239,6 +343,103 @@ static int intel_pt_track_switches(struct perf_evlist *evlist)return 0 ; } +static void intel_pt_valid_str (char *str,size_t len,u64 valid) +{ +unsigned int val, last =0 , state =1 ; +int p =0 ; + + str[0 ] ='\0' ; + +for (val =0 ; val <=64 ; val++, valid >>=1 ) { +if (valid &1 ) { + last = val; +switch (state) { +case 0 : + p +=scnprintf (str + p, len - p,"," ); +/* Fall through */ +case 1 : + p +=scnprintf (str + p, len - p,"%u" , val); + state =2 ; +break ; +case 2 : + state =3 ; +break ; +case 3 : + state =4 ; +break ; +default : +break ; + } + }else { +switch (state) { +case 3 : + p +=scnprintf (str + p, len - p,",%u" , last); + state =0 ; +break ; +case 4 : + p +=scnprintf (str + p, len - p,"-%u" , last); + state =0 ; +break ; +default : +break ; + } +if (state !=1 ) + state =0 ; + } + } +} + +static int intel_pt_val_config_term (struct perf_pmu *intel_pt_pmu, +const char *caps,const char *name, +const char *supported,u64 config) +{ +char valid_str[256 ]; +unsigned int shift; +unsigned long long valid; +u64 bits; +int ok; + +if (perf_pmu__scan_file (intel_pt_pmu, caps,"%llx" , &valid) !=1 ) + valid =0 ; + +if (supported && +perf_pmu__scan_file (intel_pt_pmu, supported,"%d" , &ok) ==1 && !ok) + valid =0 ; + + valid |=1 ; + + bits =perf_pmu__format_bits (&intel_pt_pmu->format, name); + + config &= bits; + +for (shift =0 ; bits && !(bits &1 ); shift++) + bits >>=1 ; + + config >>= shift; + +if (config >63 ) + goto out_err; + +if (valid & (1 << config)) +return 0 ; +out_err: +intel_pt_valid_str (valid_str,sizeof (valid_str), valid); +pr_err ("Invalid %s for %s. Valid values are: %s\n" , + name,INTEL_PT_PMU_NAME , valid_str); +return -EINVAL ; +} + +static int intel_pt_validate_config (struct perf_pmu *intel_pt_pmu, +struct perf_evsel *evsel) +{ +if (!evsel) +return 0 ; + +return intel_pt_val_config_term (intel_pt_pmu,"caps/psb_periods" , +"psb_period" ,"caps/psb_cyc" , + evsel->attr.config); +} +static int intel_pt_recording_options (struct auxtrace_record *itr,struct perf_evlist *evlist,struct record_opts *opts)
@@ -251,6 +452,7 @@ static int intel_pt_recording_options(struct auxtrace_record *itr,const struct cpu_map *cpus = evlist->cpus;bool privileged =geteuid () ==0 ||perf_event_paranoid () <0 ;u64 tsc_bit; +int err; ptr->evlist = evlist; ptr->snapshot_mode = opts->auxtrace_snapshot_mode;
@@ -281,6 +483,10 @@ static int intel_pt_recording_options(struct auxtrace_record *itr,if (!opts->full_auxtrace)return 0 ; + err =intel_pt_validate_config (intel_pt_pmu, intel_pt_evsel); +if (err) +return err; +/* Set default sizes for snapshot mode */ if (opts->auxtrace_snapshot_mode) {size_t psb_period =intel_pt_psb_period (intel_pt_pmu, evlist);
@@ -366,8 +572,6 @@ static int intel_pt_recording_options(struct auxtrace_record *itr,* threads. */ if (have_timing_info && !cpu_map__empty (cpus)) { -int err; - err =intel_pt_track_switches (evlist);if (err == -EPERM )pr_debug2 ("Unable to select sched:sched_switch\n" );
@@ -394,7 +598,6 @@ static int intel_pt_recording_options(struct auxtrace_record *itr,/* Add dummy event to keep tracking */ if (opts->full_auxtrace) {struct perf_evsel *tracking_evsel; -int err; err =parse_events (evlist,"dummy:u" ,NULL );if (err)
Signature · 1 line
1.9.1
tip-bot for Adrian Hunter
merge bot[tip:perf/core] perf tools: Add Intel PT support for PSB periods
perf tools: Add Intel PT support for PSB periods
Commit-ID: bc9b6bf07c8b3f4e85509f9b3a552c86e567b4ae Gitweb: http://git.kernel.org/tip/bc9b6bf07c8b3f4e85509f9b3a552c86e567b4ae Author: Adrian Hunter <[email protected]> AuthorDate: Fri, 17 Jul 2015 19:33:52 +0300 Committer: Arnaldo Carvalho de Melo <[email protected]> CommitDate: Mon, 24 Aug 2015 17:45:08 -0300
perf tools: Add Intel PT support for PSB periods
The PSB packet is a synchronization packet that provides a starting point for decoding or recovery from errors.
This patch adds support for a new Intel PT feature that allows the frequency of PSB packets to be specified.
Support for this feature is indicated by /sys/bus/event_source/devices/intel_pt/caps/psb_cyc which contains "1" if the feature is supported and "0" otherwise.
The PSB period can be specified as a PMU config term e.g. perf record -e intel_pt/psb_period=2/u sleep 1
The default value is 3 or the nearest lower value that is supported. 0 is always supported.
Valid values are given by:
/sys/bus/event_source/devices/intel_pt/caps/psb_periods
which contains a hexadecimal value, the bits of which represent valid values e.g. bit 2 set means value 2 is valid.
The value is converted to the approximate number of trace bytes between PSB packets as:
2 ^ (value + 11)
e.g. value 3 means 16KiB bytes between PSBs
If an invalid value is entered, the error message will give a list of valid values e.g.
$ perf record -e intel_pt/psb_period=15/u uname Invalid psb_period for intel_pt. Valid values are: 0-5
tools/perf/Documentation/intel-pt.txt is updated in a later patch as there are a number of new features being added.
For more information about PSB periods refer to the Intel 64 and IA-32 Architectures SDM Chapter 36 Intel Processor Trace from June 2015 or later.
--- tools/perf/arch/x86/util/intel-pt.c | 217 ++++++++++++++++++++++++++++++++++-- 1 file changed, 210 insertions(+), 7 deletions(-)
tools/perf/arch/x86/util/intel-pt.c +210 -7
@@ -99,17 +99,121 @@ static int intel_pt_parse_terms(struct list_head *formats, const char *str,return intel_pt_parse_terms_with_default (formats, str, config); } -static size_t intel_pt_psb_period (struct perf_pmu *intel_pt_pmu__maybe_unused , -struct perf_evlist *evlist__maybe_unused ) +static u64 intel_pt_masked_bits (u64 mask,u64 bits) { -return 256 ; +const u64 top_bit =1ULL <<63 ; +u64 res =0 ; +int i; + +for (i =0 ; i <64 ; i++) { +if (mask & top_bit) { + res <<=1 ; +if (bits & top_bit) + res |=1 ; + } + mask <<=1 ; + bits <<=1 ; + } + +return res; +} + +static int intel_pt_read_config (struct perf_pmu *intel_pt_pmu,const char *str, +struct perf_evlist *evlist,u64 *res) +{ +struct perf_evsel *evsel; +u64 mask; + + *res =0 ; + + mask =perf_pmu__format_bits (&intel_pt_pmu->format, str); +if (!mask) +return -EINVAL ; + +evlist__for_each (evlist, evsel) { +if (evsel->attr.type == intel_pt_pmu->type) { + *res =intel_pt_masked_bits (mask, evsel->attr.config); +return 0 ; + } + } + +return -EINVAL ; +} + +static size_t intel_pt_psb_period (struct perf_pmu *intel_pt_pmu, +struct perf_evlist *evlist) +{ +u64 val; +int err, topa_multiple_entries; +size_t psb_period; + +if (perf_pmu__scan_file (intel_pt_pmu,"caps/topa_multiple_entries" , +"%d" , &topa_multiple_entries) !=1 ) + topa_multiple_entries =0 ; + +/* +* Use caps/topa_multiple_entries to indicate early hardware that had +* extra frequent PSBs. +*/ +if (!topa_multiple_entries) { + psb_period =256 ; + goto out; + } + + err =intel_pt_read_config (intel_pt_pmu,"psb_period" , evlist, &val); +if (err) + val =0 ; + + psb_period =1 << (val +11 ); +out: +pr_debug2 ("%s psb_period %zu\n" , intel_pt_pmu->name, psb_period); +return psb_period; +} + +static int intel_pt_pick_bit (int bits,int target) +{ +int pos, pick =-1 ; + +for (pos =0 ; bits; bits >>=1 , pos++) { +if (bits &1 ) { +if (pos <= target || pick <0 ) + pick = pos; +if (pos >= target) +break ; + } + } + +return pick; }static u64 intel_pt_default_config (struct perf_pmu *intel_pt_pmu) { +char buf[256 ]; +int psb_cyc, psb_periods, psb_period; +int pos =0 ;u64 config; -intel_pt_parse_terms (&intel_pt_pmu->format,"tsc" , &config); + pos +=scnprintf (buf + pos,sizeof (buf) - pos,"tsc" ); + +if (perf_pmu__scan_file (intel_pt_pmu,"caps/psb_cyc" ,"%d" , + &psb_cyc) !=1 ) + psb_cyc =1 ; + +if (psb_cyc) { +if (perf_pmu__scan_file (intel_pt_pmu,"caps/psb_periods" ,"%x" , + &psb_periods) !=1 ) + psb_periods =0 ; +if (psb_periods) { + psb_period =intel_pt_pick_bit (psb_periods,3 ); + pos +=scnprintf (buf + pos,sizeof (buf) - pos, +",psb_period=%d" , psb_period); + } + } + +pr_debug2 ("%s default config: %s\n" , intel_pt_pmu->name, buf); + +intel_pt_parse_terms (&intel_pt_pmu->format, buf, &config); +return config; }
@@ -239,6 +343,103 @@ static int intel_pt_track_switches(struct perf_evlist *evlist)return 0 ; } +static void intel_pt_valid_str (char *str,size_t len,u64 valid) +{ +unsigned int val, last =0 , state =1 ; +int p =0 ; + + str[0 ] ='\0' ; + +for (val =0 ; val <=64 ; val++, valid >>=1 ) { +if (valid &1 ) { + last = val; +switch (state) { +case 0 : + p +=scnprintf (str + p, len - p,"," ); +/* Fall through */ +case 1 : + p +=scnprintf (str + p, len - p,"%u" , val); + state =2 ; +break ; +case 2 : + state =3 ; +break ; +case 3 : + state =4 ; +break ; +default : +break ; + } + }else { +switch (state) { +case 3 : + p +=scnprintf (str + p, len - p,",%u" , last); + state =0 ; +break ; +case 4 : + p +=scnprintf (str + p, len - p,"-%u" , last); + state =0 ; +break ; +default : +break ; + } +if (state !=1 ) + state =0 ; + } + } +} + +static int intel_pt_val_config_term (struct perf_pmu *intel_pt_pmu, +const char *caps,const char *name, +const char *supported,u64 config) +{ +char valid_str[256 ]; +unsigned int shift; +unsigned long long valid; +u64 bits; +int ok; + +if (perf_pmu__scan_file (intel_pt_pmu, caps,"%llx" , &valid) !=1 ) + valid =0 ; + +if (supported && +perf_pmu__scan_file (intel_pt_pmu, supported,"%d" , &ok) ==1 && !ok) + valid =0 ; + + valid |=1 ; + + bits =perf_pmu__format_bits (&intel_pt_pmu->format, name); + + config &= bits; + +for (shift =0 ; bits && !(bits &1 ); shift++) + bits >>=1 ; + + config >>= shift; + +if (config >63 ) + goto out_err; + +if (valid & (1 << config)) +return 0 ; +out_err: +intel_pt_valid_str (valid_str,sizeof (valid_str), valid); +pr_err ("Invalid %s for %s. Valid values are: %s\n" , + name,INTEL_PT_PMU_NAME , valid_str); +return -EINVAL ; +} + +static int intel_pt_validate_config (struct perf_pmu *intel_pt_pmu, +struct perf_evsel *evsel) +{ +if (!evsel) +return 0 ; + +return intel_pt_val_config_term (intel_pt_pmu,"caps/psb_periods" , +"psb_period" ,"caps/psb_cyc" , + evsel->attr.config); +} +static int intel_pt_recording_options (struct auxtrace_record *itr,struct perf_evlist *evlist,struct record_opts *opts)
@@ -251,6 +452,7 @@ static int intel_pt_recording_options(struct auxtrace_record *itr,const struct cpu_map *cpus = evlist->cpus;bool privileged =geteuid () ==0 ||perf_event_paranoid () <0 ;u64 tsc_bit; +int err; ptr->evlist = evlist; ptr->snapshot_mode = opts->auxtrace_snapshot_mode;
@@ -281,6 +483,10 @@ static int intel_pt_recording_options(struct auxtrace_record *itr,if (!opts->full_auxtrace)return 0 ; + err =intel_pt_validate_config (intel_pt_pmu, intel_pt_evsel); +if (err) +return err; +/* Set default sizes for snapshot mode */ if (opts->auxtrace_snapshot_mode) {size_t psb_period =intel_pt_psb_period (intel_pt_pmu, evlist);
@@ -366,8 +572,6 @@ static int intel_pt_recording_options(struct auxtrace_record *itr,* threads. */ if (have_timing_info && !cpu_map__empty (cpus)) { -int err; - err =intel_pt_track_switches (evlist);if (err == -EPERM )pr_debug2 ("Unable to select sched:sched_switch\n" );
@@ -394,7 +598,6 @@ static int intel_pt_recording_options(struct auxtrace_record *itr,/* Add dummy event to keep tracking */ if (opts->full_auxtrace) {struct perf_evsel *tracking_evsel; -int err; err =parse_events (evlist,"dummy:u" ,NULL );if (err)
Adrian Hunter
reviewerPATCH v8 18/25 perf tools: Add new Intel PT packet definitions
In reply to Adrian HunterNew features have been added to Intel PT which include a number of new packet definitions.
This patch adds packet definitions for new packets: TMA, MTC, CYC, VMCS, TRACESTOP and MNT. Also another bit in PIP is defined.
This patch only adds support for the definitions. Later patches add support for decoding TMA, MTC, CYC and TRACESTOP which is where those packets are explained.
VMCS and the newly defined bit in PIP are used with virtualization which is not supported yet. MNT is a maintenance packet which the decoder should ignore.
For details, refer to the June 2015 or later Intel 64 and IA-32 Architectures SDM Chapter 36 Intel Processor Trace.
--- .../perf/util/intel-pt-decoder/intel-pt-decoder.c | 70 +++++++++- .../util/intel-pt-decoder/intel-pt-pkt-decoder.c | 142 +++++++++++++++++++-- .../util/intel-pt-decoder/intel-pt-pkt-decoder.h | 6 + 3 files changed, 201 insertions(+), 17 deletions(-)
tools/perf/util/intel-pt-decoder/intel-pt-decoder.c +65 -5
@@ -923,6 +923,7 @@ static int intel_pt_walk_psbend(struct intel_pt_decoder *decoder)case INTEL_PT_TIP_PGE :case INTEL_PT_TIP :case INTEL_PT_TNT : +case INTEL_PT_TRACESTOP :case INTEL_PT_BAD :case INTEL_PT_PSB :intel_pt_log ("ERROR: Unexpected packet\n" );
@@ -935,6 +936,9 @@ static int intel_pt_walk_psbend(struct intel_pt_decoder *decoder)intel_pt_calc_tsc_timestamp (decoder);break ; +case INTEL_PT_TMA : +break ; +case INTEL_PT_CBR : decoder->cbr = decoder->packet.payload;break ;
@@ -944,7 +948,7 @@ static int intel_pt_walk_psbend(struct intel_pt_decoder *decoder)break ;case INTEL_PT_PIP : - decoder->cr3 = decoder->packet.payload; + decoder->cr3 = decoder->packet.payload & (BIT63 -1 );break ;case INTEL_PT_FUP :
@@ -956,6 +960,12 @@ static int intel_pt_walk_psbend(struct intel_pt_decoder *decoder)intel_pt_update_in_tx (decoder);break ; +case INTEL_PT_MTC : +break ; + +case INTEL_PT_CYC : +case INTEL_PT_VMCS : +case INTEL_PT_MNT :case INTEL_PT_PAD :default :break ;
@@ -983,8 +993,10 @@ static int intel_pt_walk_fup_tip(struct intel_pt_decoder *decoder)switch (decoder->packet.type) {case INTEL_PT_TNT :case INTEL_PT_FUP : +case INTEL_PT_TRACESTOP :case INTEL_PT_PSB :case INTEL_PT_TSC : +case INTEL_PT_TMA :case INTEL_PT_CBR :case INTEL_PT_MODE_TSX :case INTEL_PT_BAD :
@@ -1032,13 +1044,21 @@ static int intel_pt_walk_fup_tip(struct intel_pt_decoder *decoder)return 0 ;case INTEL_PT_PIP : - decoder->cr3 = decoder->packet.payload; + decoder->cr3 = decoder->packet.payload & (BIT63 -1 ); +break ; + +case INTEL_PT_MTC : +break ; + +case INTEL_PT_CYC :break ;case INTEL_PT_MODE_EXEC : decoder->exec_mode = decoder->packet.payload;break ; +case INTEL_PT_VMCS : +case INTEL_PT_MNT :case INTEL_PT_PAD :break ;
@@ -1122,6 +1142,9 @@ next: }return intel_pt_walk_fup_tip (decoder); +case INTEL_PT_TRACESTOP : +break ; +case INTEL_PT_PSB :intel_pt_clear_stack (&decoder->stack); err =intel_pt_walk_psbend (decoder);
@@ -1132,13 +1155,22 @@ next:break ;case INTEL_PT_PIP : - decoder->cr3 = decoder->packet.payload; + decoder->cr3 = decoder->packet.payload & (BIT63 -1 ); +break ; + +case INTEL_PT_MTC :break ;case INTEL_PT_TSC :intel_pt_calc_tsc_timestamp (decoder);break ; +case INTEL_PT_TMA : +break ; + +case INTEL_PT_CYC : +break ; +case INTEL_PT_CBR : decoder->cbr = decoder->packet.payload;break ;
@@ -1162,6 +1194,8 @@ next:return intel_pt_bug (decoder);case INTEL_PT_PSBEND : +case INTEL_PT_VMCS : +case INTEL_PT_MNT :case INTEL_PT_PAD :break ;
@@ -1202,16 +1236,25 @@ static int intel_pt_walk_psb(struct intel_pt_decoder *decoder) }break ; +case INTEL_PT_MTC : +break ; +case INTEL_PT_TSC :intel_pt_calc_tsc_timestamp (decoder);break ; +case INTEL_PT_TMA : +break ; + +case INTEL_PT_CYC : +break ; +case INTEL_PT_CBR : decoder->cbr = decoder->packet.payload;break ;case INTEL_PT_PIP : - decoder->cr3 = decoder->packet.payload; + decoder->cr3 = decoder->packet.payload & (BIT63 -1 );break ;case INTEL_PT_MODE_EXEC :
@@ -1222,6 +1265,7 @@ static int intel_pt_walk_psb(struct intel_pt_decoder *decoder)intel_pt_update_in_tx (decoder);break ; +case INTEL_PT_TRACESTOP :case INTEL_PT_TNT :intel_pt_log ("ERROR: Unexpected packet\n" );if (decoder->ip)
@@ -1240,6 +1284,8 @@ static int intel_pt_walk_psb(struct intel_pt_decoder *decoder)return 0 ;case INTEL_PT_PSB : +case INTEL_PT_VMCS : +case INTEL_PT_MNT :case INTEL_PT_PAD :default :break ;
@@ -1282,16 +1328,25 @@ static int intel_pt_walk_to_ip(struct intel_pt_decoder *decoder)intel_pt_set_last_ip (decoder);break ; +case INTEL_PT_MTC : +break ; +case INTEL_PT_TSC :intel_pt_calc_tsc_timestamp (decoder);break ; +case INTEL_PT_TMA : +break ; + +case INTEL_PT_CYC : +break ; +case INTEL_PT_CBR : decoder->cbr = decoder->packet.payload;break ;case INTEL_PT_PIP : - decoder->cr3 = decoder->packet.payload; + decoder->cr3 = decoder->packet.payload & (BIT63 -1 );break ;case INTEL_PT_MODE_EXEC :
@@ -1308,6 +1363,9 @@ static int intel_pt_walk_to_ip(struct intel_pt_decoder *decoder)case INTEL_PT_BAD :/* Does not happen */ return intel_pt_bug (decoder); +case INTEL_PT_TRACESTOP : +break ; +case INTEL_PT_PSB : err =intel_pt_walk_psb (decoder);if (err)
@@ -1321,6 +1379,8 @@ static int intel_pt_walk_to_ip(struct intel_pt_decoder *decoder)case INTEL_PT_TNT :case INTEL_PT_PSBEND : +case INTEL_PT_VMCS : +case INTEL_PT_MNT :case INTEL_PT_PAD :default :break ;
tools/perf/util/intel-pt-decoder/intel-pt-pkt-decoder.c +130 -12
255 lines not on this page · raw message
tools/perf/util/intel-pt-decoder/intel-pt-pkt-decoder.h +6 -0
@@ -37,15 +37,21 @@ enum intel_pt_pkt_type {INTEL_PT_TIP_PGD ,INTEL_PT_TIP_PGE ,INTEL_PT_TSC , +INTEL_PT_TMA ,INTEL_PT_MODE_EXEC ,INTEL_PT_MODE_TSX , +INTEL_PT_MTC ,INTEL_PT_TIP ,INTEL_PT_FUP , +INTEL_PT_CYC , +INTEL_PT_VMCS ,INTEL_PT_PSB ,INTEL_PT_PSBEND ,INTEL_PT_CBR , +INTEL_PT_TRACESTOP ,INTEL_PT_PIP ,INTEL_PT_OVF , + INTEL_PT_MNT, }; struct intel_pt_pkt {
Signature · 1 line
1.9.1
tip-bot for Adrian Hunter
merge bot[tip:perf/core] perf tools: Add new Intel PT packet definitions
perf tools: Add new Intel PT packet definitions
Commit-ID: 3d49807870f08d6f3406b77efd94bb3788372162 Gitweb: http://git.kernel.org/tip/3d49807870f08d6f3406b77efd94bb3788372162 Author: Adrian Hunter <[email protected]> AuthorDate: Fri, 17 Jul 2015 19:33:53 +0300 Committer: Arnaldo Carvalho de Melo <[email protected]> CommitDate: Mon, 24 Aug 2015 17:46:06 -0300
perf tools: Add new Intel PT packet definitions
New features have been added to Intel PT which include a number of new packet definitions.
This patch adds packet definitions for new packets: TMA, MTC, CYC, VMCS, TRACESTOP and MNT. Also another bit in PIP is defined.
This patch only adds support for the definitions. Later patches add support for decoding TMA, MTC, CYC and TRACESTOP which is where those packets are explained.
VMCS and the newly defined bit in PIP are used with virtualization which is not supported yet. MNT is a maintenance packet which the decoder should ignore.
For details, refer to the June 2015 or later Intel 64 and IA-32 Architectures SDM Chapter 36 Intel Processor Trace.
--- .../perf/util/intel-pt-decoder/intel-pt-decoder.c | 70 +++++++++- .../util/intel-pt-decoder/intel-pt-pkt-decoder.c | 142 +++++++++++++++++++-- .../util/intel-pt-decoder/intel-pt-pkt-decoder.h | 6 + 3 files changed, 201 insertions(+), 17 deletions(-)
tools/perf/util/intel-pt-decoder/intel-pt-decoder.c +65 -5
@@ -923,6 +923,7 @@ static int intel_pt_walk_psbend(struct intel_pt_decoder *decoder)case INTEL_PT_TIP_PGE :case INTEL_PT_TIP :case INTEL_PT_TNT : +case INTEL_PT_TRACESTOP :case INTEL_PT_BAD :case INTEL_PT_PSB :intel_pt_log ("ERROR: Unexpected packet\n" );
@@ -935,6 +936,9 @@ static int intel_pt_walk_psbend(struct intel_pt_decoder *decoder)intel_pt_calc_tsc_timestamp (decoder);break ; +case INTEL_PT_TMA : +break ; +case INTEL_PT_CBR : decoder->cbr = decoder->packet.payload;break ;
@@ -944,7 +948,7 @@ static int intel_pt_walk_psbend(struct intel_pt_decoder *decoder)break ;case INTEL_PT_PIP : - decoder->cr3 = decoder->packet.payload; + decoder->cr3 = decoder->packet.payload & (BIT63 -1 );break ;case INTEL_PT_FUP :
@@ -956,6 +960,12 @@ static int intel_pt_walk_psbend(struct intel_pt_decoder *decoder)intel_pt_update_in_tx (decoder);break ; +case INTEL_PT_MTC : +break ; + +case INTEL_PT_CYC : +case INTEL_PT_VMCS : +case INTEL_PT_MNT :case INTEL_PT_PAD :default :break ;
@@ -983,8 +993,10 @@ static int intel_pt_walk_fup_tip(struct intel_pt_decoder *decoder)switch (decoder->packet.type) {case INTEL_PT_TNT :case INTEL_PT_FUP : +case INTEL_PT_TRACESTOP :case INTEL_PT_PSB :case INTEL_PT_TSC : +case INTEL_PT_TMA :case INTEL_PT_CBR :case INTEL_PT_MODE_TSX :case INTEL_PT_BAD :
@@ -1032,13 +1044,21 @@ static int intel_pt_walk_fup_tip(struct intel_pt_decoder *decoder)return 0 ;case INTEL_PT_PIP : - decoder->cr3 = decoder->packet.payload; + decoder->cr3 = decoder->packet.payload & (BIT63 -1 ); +break ; + +case INTEL_PT_MTC : +break ; + +case INTEL_PT_CYC :break ;case INTEL_PT_MODE_EXEC : decoder->exec_mode = decoder->packet.payload;break ; +case INTEL_PT_VMCS : +case INTEL_PT_MNT :case INTEL_PT_PAD :break ;
@@ -1122,6 +1142,9 @@ next: }return intel_pt_walk_fup_tip (decoder); +case INTEL_PT_TRACESTOP : +break ; +case INTEL_PT_PSB :intel_pt_clear_stack (&decoder->stack); err =intel_pt_walk_psbend (decoder);
@@ -1132,13 +1155,22 @@ next:break ;case INTEL_PT_PIP : - decoder->cr3 = decoder->packet.payload; + decoder->cr3 = decoder->packet.payload & (BIT63 -1 ); +break ; + +case INTEL_PT_MTC :break ;case INTEL_PT_TSC :intel_pt_calc_tsc_timestamp (decoder);break ; +case INTEL_PT_TMA : +break ; + +case INTEL_PT_CYC : +break ; +case INTEL_PT_CBR : decoder->cbr = decoder->packet.payload;break ;
@@ -1162,6 +1194,8 @@ next:return intel_pt_bug (decoder);case INTEL_PT_PSBEND : +case INTEL_PT_VMCS : +case INTEL_PT_MNT :case INTEL_PT_PAD :break ;
@@ -1202,16 +1236,25 @@ static int intel_pt_walk_psb(struct intel_pt_decoder *decoder) }break ; +case INTEL_PT_MTC : +break ; +case INTEL_PT_TSC :intel_pt_calc_tsc_timestamp (decoder);break ; +case INTEL_PT_TMA : +break ; + +case INTEL_PT_CYC : +break ; +case INTEL_PT_CBR : decoder->cbr = decoder->packet.payload;break ;case INTEL_PT_PIP : - decoder->cr3 = decoder->packet.payload; + decoder->cr3 = decoder->packet.payload & (BIT63 -1 );break ;case INTEL_PT_MODE_EXEC :
@@ -1222,6 +1265,7 @@ static int intel_pt_walk_psb(struct intel_pt_decoder *decoder)intel_pt_update_in_tx (decoder);break ; +case INTEL_PT_TRACESTOP :case INTEL_PT_TNT :intel_pt_log ("ERROR: Unexpected packet\n" );if (decoder->ip)
@@ -1240,6 +1284,8 @@ static int intel_pt_walk_psb(struct intel_pt_decoder *decoder)return 0 ;case INTEL_PT_PSB : +case INTEL_PT_VMCS : +case INTEL_PT_MNT :case INTEL_PT_PAD :default :break ;
@@ -1282,16 +1328,25 @@ static int intel_pt_walk_to_ip(struct intel_pt_decoder *decoder)intel_pt_set_last_ip (decoder);break ; +case INTEL_PT_MTC : +break ; +case INTEL_PT_TSC :intel_pt_calc_tsc_timestamp (decoder);break ; +case INTEL_PT_TMA : +break ; + +case INTEL_PT_CYC : +break ; +case INTEL_PT_CBR : decoder->cbr = decoder->packet.payload;break ;case INTEL_PT_PIP : - decoder->cr3 = decoder->packet.payload; + decoder->cr3 = decoder->packet.payload & (BIT63 -1 );break ;case INTEL_PT_MODE_EXEC :
@@ -1308,6 +1363,9 @@ static int intel_pt_walk_to_ip(struct intel_pt_decoder *decoder)case INTEL_PT_BAD :/* Does not happen */ return intel_pt_bug (decoder); +case INTEL_PT_TRACESTOP : +break ; +case INTEL_PT_PSB : err =intel_pt_walk_psb (decoder);if (err)
@@ -1321,6 +1379,8 @@ static int intel_pt_walk_to_ip(struct intel_pt_decoder *decoder)case INTEL_PT_TNT :case INTEL_PT_PSBEND : +case INTEL_PT_VMCS : +case INTEL_PT_MNT :case INTEL_PT_PAD :default :break ;
tools/perf/util/intel-pt-decoder/intel-pt-pkt-decoder.c +130 -12
255 lines not on this page · raw message
tools/perf/util/intel-pt-decoder/intel-pt-pkt-decoder.h +6 -0
@@ -37,15 +37,21 @@ enum intel_pt_pkt_type {INTEL_PT_TIP_PGD ,INTEL_PT_TIP_PGE ,INTEL_PT_TSC , +INTEL_PT_TMA ,INTEL_PT_MODE_EXEC ,INTEL_PT_MODE_TSX , +INTEL_PT_MTC ,INTEL_PT_TIP ,INTEL_PT_FUP , +INTEL_PT_CYC , +INTEL_PT_VMCS ,INTEL_PT_PSB ,INTEL_PT_PSBEND ,INTEL_PT_CBR , +INTEL_PT_TRACESTOP ,INTEL_PT_PIP ,INTEL_PT_OVF , + INTEL_PT_MNT, }; struct intel_pt_pkt {
Adrian Hunter
reviewerPATCH v8 19/25 perf tools: Pass Intel PT information for decoding MTC and CYC
In reply to Adrian HunterRecord additional information in the AUXTRACE_INFO event in preparation for decoding MTC and CYC packets. Pass the information to the decoder.
The AUXTRACE_INFO record can be extended by using the size to indicate the presence of new members.
The additional information includes PMU config bit positions and the TSC to CTC (hardware crystal clock) ratio needed to decode MTC packets.
--- tools/perf/arch/x86/util/intel-pt.c | 24 ++++++++- .../perf/util/intel-pt-decoder/intel-pt-decoder.h | 3 ++ tools/perf/util/intel-pt.c | 62 ++++++++++++++++++---- tools/perf/util/intel-pt.h | 5 ++ 4 files changed, 83 insertions(+), 11 deletions(-)
tools/perf/arch/x86/util/intel-pt.c +23 -1
@@ -18,6 +18,7 @@#include <linux/types.h> #include <linux/bitops.h> #include <linux/log2.h> +#include <cpuid.h> #include "../../perf.h" #include "../../util/session.h"
@@ -261,6 +262,15 @@ static size_t intel_pt_info_priv_size(struct auxtrace_record *itr __maybe_unusedreturn INTEL_PT_AUXTRACE_PRIV_SIZE ; } +static void intel_pt_tsc_ctc_ratio (u32 *n,u32 *d) +{ +unsigned int eax =0 , ebx =0 , ecx =0 , edx =0 ; + +__get_cpuid (0x15 , &eax, &ebx, &ecx, &edx); + *n = ebx; + *d = eax; +} + static int intel_pt_info_fill(struct auxtrace_record *itr, struct perf_session *session, struct auxtrace_info_event *auxtrace_info,
@@ -272,7 +282,8 @@ static int intel_pt_info_fill(struct auxtrace_record *itr,struct perf_event_mmap_page *pc;struct perf_tsc_conversion tc = { .time_mult =0 , };bool cap_user_time_zero = false, per_cpu_mmaps; -u64 tsc_bit, noretcomp_bit; +u64 tsc_bit, mtc_bit, mtc_freq_bits, cyc_bit, noretcomp_bit; +u32 tsc_ctc_ratio_n, tsc_ctc_ratio_d;int err;if (priv_size !=INTEL_PT_AUXTRACE_PRIV_SIZE )
@@ -281,6 +292,12 @@ static int intel_pt_info_fill(struct auxtrace_record *itr,intel_pt_parse_terms (&intel_pt_pmu->format,"tsc" , &tsc_bit);intel_pt_parse_terms (&intel_pt_pmu->format,"noretcomp" , &noretcomp_bit); +intel_pt_parse_terms (&intel_pt_pmu->format,"mtc" , &mtc_bit); + mtc_freq_bits =perf_pmu__format_bits (&intel_pt_pmu->format, +"mtc_period" ); +intel_pt_parse_terms (&intel_pt_pmu->format,"cyc" , &cyc_bit); + +intel_pt_tsc_ctc_ratio (&tsc_ctc_ratio_n, &tsc_ctc_ratio_d);if (!session->evlist->nr_mmaps)return -EINVAL ;
@@ -311,6 +328,11 @@ static int intel_pt_info_fill(struct auxtrace_record *itr, auxtrace_info->priv[INTEL_PT_HAVE_SCHED_SWITCH ] = ptr->have_sched_switch; auxtrace_info->priv[INTEL_PT_SNAPSHOT_MODE ] = ptr->snapshot_mode; auxtrace_info->priv[INTEL_PT_PER_CPU_MMAPS ] = per_cpu_mmaps; + auxtrace_info->priv[INTEL_PT_MTC_BIT ] = mtc_bit; + auxtrace_info->priv[INTEL_PT_MTC_FREQ_BITS ] = mtc_freq_bits; + auxtrace_info->priv[INTEL_PT_TSC_CTC_N ] = tsc_ctc_ratio_n; + auxtrace_info->priv[INTEL_PT_TSC_CTC_D ] = tsc_ctc_ratio_d; + auxtrace_info->priv[INTEL_PT_CYC_BIT ] = cyc_bit;return 0 ; }
tools/perf/util/intel-pt-decoder/intel-pt-decoder.h +3 -0
@@ -87,6 +87,9 @@ struct intel_pt_params {uint64_t period;enum intel_pt_period_type period_type;unsigned max_non_turbo_ratio; +unsigned int mtc_period; +uint32_t tsc_ctc_ratio_n; +uint32_t tsc_ctc_ratio_d; };struct intel_pt_decoder ;
tools/perf/util/intel-pt.c +52 -10
92 lines not on this page · raw message
tools/perf/util/intel-pt.h +5 -0
@@ -29,6 +29,11 @@ enum {INTEL_PT_HAVE_SCHED_SWITCH ,INTEL_PT_SNAPSHOT_MODE ,INTEL_PT_PER_CPU_MMAPS , +INTEL_PT_MTC_BIT , +INTEL_PT_MTC_FREQ_BITS , +INTEL_PT_TSC_CTC_N , +INTEL_PT_TSC_CTC_D , +INTEL_PT_CYC_BIT , INTEL_PT_AUXTRACE_PRIV_MAX, };
Signature · 1 line
1.9.1
tip-bot for Adrian Hunter
merge bot[tip:perf/core] perf tools: Pass Intel PT information for decoding MTC and CYC
perf tools: Pass Intel PT information for decoding MTC and CYC
Commit-ID: 11fa7cb86b56d3610043ba2ac6cbd81feab4b7c4 Gitweb: http://git.kernel.org/tip/11fa7cb86b56d3610043ba2ac6cbd81feab4b7c4 Author: Adrian Hunter <[email protected]> AuthorDate: Fri, 17 Jul 2015 19:33:54 +0300 Committer: Arnaldo Carvalho de Melo <[email protected]> CommitDate: Mon, 24 Aug 2015 17:46:43 -0300
perf tools: Pass Intel PT information for decoding MTC and CYC
Record additional information in the AUXTRACE_INFO event in preparation for decoding MTC and CYC packets. Pass the information to the decoder.
The AUXTRACE_INFO record can be extended by using the size to indicate the presence of new members.
The additional information includes PMU config bit positions and the TSC to CTC (hardware crystal clock) ratio needed to decode MTC packets.
--- tools/perf/arch/x86/util/intel-pt.c | 24 ++++++++- .../perf/util/intel-pt-decoder/intel-pt-decoder.h | 3 ++ tools/perf/util/intel-pt.c | 62 ++++++++++++++++++---- tools/perf/util/intel-pt.h | 5 ++ 4 files changed, 83 insertions(+), 11 deletions(-)
tools/perf/arch/x86/util/intel-pt.c +23 -1
@@ -18,6 +18,7 @@#include <linux/types.h> #include <linux/bitops.h> #include <linux/log2.h> +#include <cpuid.h> #include "../../perf.h" #include "../../util/session.h"
@@ -261,6 +262,15 @@ static size_t intel_pt_info_priv_size(struct auxtrace_record *itr __maybe_unusedreturn INTEL_PT_AUXTRACE_PRIV_SIZE ; } +static void intel_pt_tsc_ctc_ratio (u32 *n,u32 *d) +{ +unsigned int eax =0 , ebx =0 , ecx =0 , edx =0 ; + +__get_cpuid (0x15 , &eax, &ebx, &ecx, &edx); + *n = ebx; + *d = eax; +} + static int intel_pt_info_fill(struct auxtrace_record *itr, struct perf_session *session, struct auxtrace_info_event *auxtrace_info,
@@ -272,7 +282,8 @@ static int intel_pt_info_fill(struct auxtrace_record *itr,struct perf_event_mmap_page *pc;struct perf_tsc_conversion tc = { .time_mult =0 , };bool cap_user_time_zero = false, per_cpu_mmaps; -u64 tsc_bit, noretcomp_bit; +u64 tsc_bit, mtc_bit, mtc_freq_bits, cyc_bit, noretcomp_bit; +u32 tsc_ctc_ratio_n, tsc_ctc_ratio_d;int err;if (priv_size !=INTEL_PT_AUXTRACE_PRIV_SIZE )
@@ -281,6 +292,12 @@ static int intel_pt_info_fill(struct auxtrace_record *itr,intel_pt_parse_terms (&intel_pt_pmu->format,"tsc" , &tsc_bit);intel_pt_parse_terms (&intel_pt_pmu->format,"noretcomp" , &noretcomp_bit); +intel_pt_parse_terms (&intel_pt_pmu->format,"mtc" , &mtc_bit); + mtc_freq_bits =perf_pmu__format_bits (&intel_pt_pmu->format, +"mtc_period" ); +intel_pt_parse_terms (&intel_pt_pmu->format,"cyc" , &cyc_bit); + +intel_pt_tsc_ctc_ratio (&tsc_ctc_ratio_n, &tsc_ctc_ratio_d);if (!session->evlist->nr_mmaps)return -EINVAL ;
@@ -311,6 +328,11 @@ static int intel_pt_info_fill(struct auxtrace_record *itr, auxtrace_info->priv[INTEL_PT_HAVE_SCHED_SWITCH ] = ptr->have_sched_switch; auxtrace_info->priv[INTEL_PT_SNAPSHOT_MODE ] = ptr->snapshot_mode; auxtrace_info->priv[INTEL_PT_PER_CPU_MMAPS ] = per_cpu_mmaps; + auxtrace_info->priv[INTEL_PT_MTC_BIT ] = mtc_bit; + auxtrace_info->priv[INTEL_PT_MTC_FREQ_BITS ] = mtc_freq_bits; + auxtrace_info->priv[INTEL_PT_TSC_CTC_N ] = tsc_ctc_ratio_n; + auxtrace_info->priv[INTEL_PT_TSC_CTC_D ] = tsc_ctc_ratio_d; + auxtrace_info->priv[INTEL_PT_CYC_BIT ] = cyc_bit;return 0 ; }
tools/perf/util/intel-pt-decoder/intel-pt-decoder.h +3 -0
@@ -87,6 +87,9 @@ struct intel_pt_params {uint64_t period;enum intel_pt_period_type period_type;unsigned max_non_turbo_ratio; +unsigned int mtc_period; +uint32_t tsc_ctc_ratio_n; +uint32_t tsc_ctc_ratio_d; };struct intel_pt_decoder ;
tools/perf/util/intel-pt.c +52 -10
92 lines not on this page · raw message
tools/perf/util/intel-pt.h +5 -0
@@ -29,6 +29,11 @@ enum {INTEL_PT_HAVE_SCHED_SWITCH ,INTEL_PT_SNAPSHOT_MODE ,INTEL_PT_PER_CPU_MMAPS , +INTEL_PT_MTC_BIT , +INTEL_PT_MTC_FREQ_BITS , +INTEL_PT_TSC_CTC_N , +INTEL_PT_TSC_CTC_D , +INTEL_PT_CYC_BIT , INTEL_PT_AUXTRACE_PRIV_MAX, };
Adrian Hunter
reviewerPATCH v8 20/25 perf tools: Add Intel PT support for decoding MTC packets
In reply to Adrian HunterMTC packets provide finer grain timestamp information than TSC packets. MTC packets record time using the hardware crystal clock (CTC) which is related to TSC packets using a TMA packet.
This patch just adds decoder support.
Support for a default value and validation of values is provided by a later patch. Also documentation is updated in a separate patch.
For details refer to the June 2015 or later Intel 64 and IA-32 Architectures SDM Chapter 36 Intel Processor Trace.
--- .../perf/util/intel-pt-decoder/intel-pt-decoder.c | 162 ++++++++++++++++++++- .../perf/util/intel-pt-decoder/intel-pt-decoder.h | 1 + 2 files changed, 159 insertions(+), 4 deletions(-)
tools/perf/util/intel-pt-decoder/intel-pt-decoder.c +158 -4
@@ -85,7 +85,9 @@ struct intel_pt_decoder {const unsigned char *buf;size_t len;bool return_compression; +bool mtc_insn;bool pge; +bool have_tma;uint64_t pos;uint64_t last_ip;uint64_t ip;
@@ -94,6 +96,15 @@ struct intel_pt_decoder {uint64_t tsc_timestamp;uint64_t ref_timestamp;uint64_t ret_addr; +uint64_t ctc_timestamp; +uint64_t ctc_delta; +uint32_t last_mtc; +uint32_t tsc_ctc_ratio_n; +uint32_t tsc_ctc_ratio_d; +uint32_t tsc_ctc_mult; +uint32_t tsc_slip; +uint32_t ctc_rem_mask; +int mtc_shift;struct intel_pt_stack stack;enum intel_pt_pkt_state pkt_state;struct intel_pt_pkt packet;
@@ -149,6 +160,13 @@ static void intel_pt_setup_period(struct intel_pt_decoder *decoder) } } +static uint64_t multdiv (uint64_t t,uint32_t n,uint32_t d) +{ +if (!d) +return 0 ; +return (t / d) * n + ((t % d) * n) / d; +} +struct intel_pt_decoder *intel_pt_decoder_new (struct intel_pt_params *params) {struct intel_pt_decoder *decoder;
@@ -175,6 +193,39 @@ struct intel_pt_decoder *intel_pt_decoder_new(struct intel_pt_params *params)intel_pt_setup_period (decoder); + decoder->mtc_shift = params->mtc_period; + decoder->ctc_rem_mask = (1 << decoder->mtc_shift) -1 ; + + decoder->tsc_ctc_ratio_n = params->tsc_ctc_ratio_n; + decoder->tsc_ctc_ratio_d = params->tsc_ctc_ratio_d; + +if (!decoder->tsc_ctc_ratio_n) + decoder->tsc_ctc_ratio_d =0 ; + +if (decoder->tsc_ctc_ratio_d) { +if (!(decoder->tsc_ctc_ratio_n % decoder->tsc_ctc_ratio_d)) + decoder->tsc_ctc_mult = decoder->tsc_ctc_ratio_n / + decoder->tsc_ctc_ratio_d; + +/* +* Allow for timestamps appearing to backwards because a TSC +* packet has slipped past a MTC packet, so allow 2 MTC ticks +* or ... +*/ + decoder->tsc_slip =multdiv (2 << decoder->mtc_shift, + decoder->tsc_ctc_ratio_n, + decoder->tsc_ctc_ratio_d); + } +/* ... or 0x100 paranoia */ +if (decoder->tsc_slip <0x100 ) + decoder->tsc_slip =0x100 ; + +intel_pt_log ("timestamp: mtc_shift %u\n" , decoder->mtc_shift); +intel_pt_log ("timestamp: tsc_ctc_ratio_n %u\n" , decoder->tsc_ctc_ratio_n); +intel_pt_log ("timestamp: tsc_ctc_ratio_d %u\n" , decoder->tsc_ctc_ratio_d); +intel_pt_log ("timestamp: tsc_ctc_mult %u\n" , decoder->tsc_ctc_mult); +intel_pt_log ("timestamp: tsc_slip %#x\n" , decoder->tsc_slip); +return decoder; }
@@ -368,6 +419,7 @@ static inline void intel_pt_update_in_tx(struct intel_pt_decoder *decoder)static int intel_pt_bad_packet (struct intel_pt_decoder *decoder) {intel_pt_clear_tx_flags (decoder); + decoder->have_tma = false; decoder->pkt_len =1 ; decoder->pkt_step =1 ;intel_pt_decoder_log_packet (decoder);
@@ -400,6 +452,7 @@ static int intel_pt_get_data(struct intel_pt_decoder *decoder) decoder->pkt_state =INTEL_PT_STATE_NO_PSB ; decoder->ref_timestamp = buffer.ref_timestamp; decoder->timestamp =0 ; + decoder->have_tma = false; decoder->state.trace_nr = buffer.trace_nr;intel_pt_log ("Reference timestamp 0x%" PRIx64"\n" , decoder->ref_timestamp);
@@ -523,6 +576,7 @@ static uint64_t intel_pt_next_sample(struct intel_pt_decoder *decoder)case INTEL_PT_PERIOD_TICKS :return intel_pt_next_period (decoder);case INTEL_PT_PERIOD_NONE : +case INTEL_PT_PERIOD_MTC :default :return 0 ; }
@@ -542,6 +596,7 @@ static void intel_pt_sample_insn(struct intel_pt_decoder *decoder) decoder->last_masked_timestamp = masked_timestamp;break ;case INTEL_PT_PERIOD_NONE : +case INTEL_PT_PERIOD_MTC :default :break ; }
@@ -555,6 +610,9 @@ static int intel_pt_walk_insn(struct intel_pt_decoder *decoder,uint64_t max_insn_cnt, insn_cnt =0 ;int err; +if (!decoder->mtc_insn) + decoder->mtc_insn = true; + max_insn_cnt =intel_pt_next_sample (decoder); err = decoder->walk_insn(intel_pt_insn, &insn_cnt, &decoder->ip, ip,
@@ -861,6 +919,8 @@ static void intel_pt_calc_tsc_timestamp(struct intel_pt_decoder *decoder) {uint64_t timestamp; + decoder->have_tma = false; +if (decoder->ref_timestamp) { timestamp = decoder->packet.payload | (decoder->ref_timestamp & (0xffULL <<56 ));
@@ -878,17 +938,18 @@ static void intel_pt_calc_tsc_timestamp(struct intel_pt_decoder *decoder) }else if (decoder->timestamp) { timestamp = decoder->packet.payload | (decoder->timestamp & (0xffULL <<56 )); + decoder->tsc_timestamp = timestamp;if (timestamp < decoder->timestamp && - decoder->timestamp - timestamp <0x100 ) { -intel_pt_log_to ("ERROR: Suppressing backwards timestamp" , + decoder->timestamp - timestamp < decoder->tsc_slip) { +intel_pt_log_to ("Suppressing backwards timestamp" , timestamp); timestamp = decoder->timestamp; }while (timestamp < decoder->timestamp) {intel_pt_log_to ("Wraparound timestamp" , timestamp); timestamp += (1ULL <<56 ); + decoder->tsc_timestamp = timestamp; } - decoder->tsc_timestamp = timestamp; decoder->timestamp = timestamp; decoder->timestamp_insn_cnt =0 ; }
@@ -900,11 +961,73 @@ static int intel_pt_overflow(struct intel_pt_decoder *decoder) {intel_pt_log ("ERROR: Buffer overflow\n" );intel_pt_clear_tx_flags (decoder); + decoder->have_tma = false; decoder->pkt_state =INTEL_PT_STATE_ERR_RESYNC ; decoder->overflow = true;return -EOVERFLOW ; } +static void intel_pt_calc_tma (struct intel_pt_decoder *decoder) +{ +uint32_t ctc = decoder->packet.payload; +uint32_t fc = decoder->packet.count; +uint32_t ctc_rem = ctc & decoder->ctc_rem_mask; + +if (!decoder->tsc_ctc_ratio_d) +return ; + + decoder->last_mtc = (ctc >> decoder->mtc_shift) &0xff ; + decoder->ctc_timestamp = decoder->tsc_timestamp - fc; +if (decoder->tsc_ctc_mult) { + decoder->ctc_timestamp -= ctc_rem * decoder->tsc_ctc_mult; + }else { + decoder->ctc_timestamp -=multdiv (ctc_rem, + decoder->tsc_ctc_ratio_n, + decoder->tsc_ctc_ratio_d); + } + decoder->ctc_delta =0 ; + decoder->have_tma = true; +intel_pt_log ("CTC timestamp " x64_fmt" last MTC %#x CTC rem %#x\n" , + decoder->ctc_timestamp, decoder->last_mtc, ctc_rem); +} + +static void intel_pt_calc_mtc_timestamp (struct intel_pt_decoder *decoder) +{ +uint64_t timestamp; +uint32_t mtc, mtc_delta; + +if (!decoder->have_tma) +return ; + + mtc = decoder->packet.payload; + +if (mtc > decoder->last_mtc) + mtc_delta = mtc - decoder->last_mtc; +else + mtc_delta = mtc +256 - decoder->last_mtc; + + decoder->ctc_delta += mtc_delta << decoder->mtc_shift; + +if (decoder->tsc_ctc_mult) { + timestamp = decoder->ctc_timestamp + + decoder->ctc_delta * decoder->tsc_ctc_mult; + }else { + timestamp = decoder->ctc_timestamp + +multdiv (decoder->ctc_delta, + decoder->tsc_ctc_ratio_n, + decoder->tsc_ctc_ratio_d); + } + +if (timestamp < decoder->timestamp) +intel_pt_log ("Suppressing MTC timestamp " x64_fmt" less than current timestamp " x64_fmt"\n" , + timestamp, decoder->timestamp); +else + decoder->timestamp = timestamp; + + decoder->timestamp_insn_cnt =0 ; + decoder->last_mtc = mtc; +} +/* Walk PSB+ packets when already in sync. */ static int intel_pt_walk_psbend (struct intel_pt_decoder *decoder) {
@@ -926,6 +1049,7 @@ static int intel_pt_walk_psbend(struct intel_pt_decoder *decoder)case INTEL_PT_TRACESTOP :case INTEL_PT_BAD :case INTEL_PT_PSB : + decoder->have_tma = false;intel_pt_log ("ERROR: Unexpected packet\n" );return -EAGAIN ;
@@ -937,6 +1061,7 @@ static int intel_pt_walk_psbend(struct intel_pt_decoder *decoder)break ;case INTEL_PT_TMA : +intel_pt_calc_tma (decoder);break ;case INTEL_PT_CBR :
@@ -961,6 +1086,9 @@ static int intel_pt_walk_psbend(struct intel_pt_decoder *decoder)break ;case INTEL_PT_MTC : +intel_pt_calc_mtc_timestamp (decoder); +if (decoder->period_type ==INTEL_PT_PERIOD_MTC ) + decoder->state.type |=INTEL_PT_INSTRUCTION ;break ;case INTEL_PT_CYC :
@@ -1048,6 +1176,9 @@ static int intel_pt_walk_fup_tip(struct intel_pt_decoder *decoder)break ;case INTEL_PT_MTC : +intel_pt_calc_mtc_timestamp (decoder); +if (decoder->period_type ==INTEL_PT_PERIOD_MTC ) + decoder->state.type |=INTEL_PT_INSTRUCTION ;break ;case INTEL_PT_CYC :
@@ -1159,13 +1290,31 @@ next:break ;case INTEL_PT_MTC : -break ; +intel_pt_calc_mtc_timestamp (decoder); +if (decoder->period_type !=INTEL_PT_PERIOD_MTC ) +break ; +/* +* Ensure that there has been an instruction since the +* last MTC. +*/ +if (!decoder->mtc_insn) +break ; + decoder->mtc_insn = false; +/* Ensure that there is a timestamp */ +if (!decoder->timestamp) +break ; + decoder->state.type =INTEL_PT_INSTRUCTION ; + decoder->state.from_ip = decoder->ip; + decoder->state.to_ip =0 ; + decoder->mtc_insn = false; +return 0 ;case INTEL_PT_TSC :intel_pt_calc_tsc_timestamp (decoder);break ;case INTEL_PT_TMA : +intel_pt_calc_tma (decoder);break ;case INTEL_PT_CYC :
@@ -1237,6 +1386,7 @@ static int intel_pt_walk_psb(struct intel_pt_decoder *decoder)break ;case INTEL_PT_MTC : +intel_pt_calc_mtc_timestamp (decoder);break ;case INTEL_PT_TSC :
@@ -1244,6 +1394,7 @@ static int intel_pt_walk_psb(struct intel_pt_decoder *decoder)break ;case INTEL_PT_TMA : +intel_pt_calc_tma (decoder);break ;case INTEL_PT_CYC :
@@ -1267,6 +1418,7 @@ static int intel_pt_walk_psb(struct intel_pt_decoder *decoder)case INTEL_PT_TRACESTOP :case INTEL_PT_TNT : + decoder->have_tma = false;intel_pt_log ("ERROR: Unexpected packet\n" );if (decoder->ip) decoder->pkt_state =INTEL_PT_STATE_ERR4 ;
@@ -1329,6 +1481,7 @@ static int intel_pt_walk_to_ip(struct intel_pt_decoder *decoder)break ;case INTEL_PT_MTC : +intel_pt_calc_mtc_timestamp (decoder);break ;case INTEL_PT_TSC :
@@ -1336,6 +1489,7 @@ static int intel_pt_walk_to_ip(struct intel_pt_decoder *decoder)break ;case INTEL_PT_TMA : +intel_pt_calc_tma (decoder);break ;case INTEL_PT_CYC :
tools/perf/util/intel-pt-decoder/intel-pt-decoder.h +1 -0
@@ -36,6 +36,7 @@ enum intel_pt_period_type {INTEL_PT_PERIOD_NONE ,INTEL_PT_PERIOD_INSTRUCTIONS ,INTEL_PT_PERIOD_TICKS , + INTEL_PT_PERIOD_MTC, }; enum {
Signature · 1 line
1.9.1
tip-bot for Adrian Hunter
merge bot[tip:perf/core] perf tools: Add Intel PT support for decoding MTC packets
perf tools: Add Intel PT support for decoding MTC packets
Commit-ID: 79b58424b821c651a4b4df9018a14684e3670f42 Gitweb: http://git.kernel.org/tip/79b58424b821c651a4b4df9018a14684e3670f42 Author: Adrian Hunter <[email protected]> AuthorDate: Fri, 17 Jul 2015 19:33:55 +0300 Committer: Arnaldo Carvalho de Melo <[email protected]> CommitDate: Mon, 24 Aug 2015 17:46:56 -0300
perf tools: Add Intel PT support for decoding MTC packets
MTC packets provide finer grain timestamp information than TSC packets. MTC packets record time using the hardware crystal clock (CTC) which is related to TSC packets using a TMA packet.
This patch just adds decoder support.
Support for a default value and validation of values is provided by a later patch. Also documentation is updated in a separate patch.
For details refer to the June 2015 or later Intel 64 and IA-32 Architectures SDM Chapter 36 Intel Processor Trace.
--- .../perf/util/intel-pt-decoder/intel-pt-decoder.c | 162 ++++++++++++++++++++- .../perf/util/intel-pt-decoder/intel-pt-decoder.h | 1 + 2 files changed, 159 insertions(+), 4 deletions(-)
tools/perf/util/intel-pt-decoder/intel-pt-decoder.c +158 -4
@@ -85,7 +85,9 @@ struct intel_pt_decoder {const unsigned char *buf;size_t len;bool return_compression; +bool mtc_insn;bool pge; +bool have_tma;uint64_t pos;uint64_t last_ip;uint64_t ip;
@@ -94,6 +96,15 @@ struct intel_pt_decoder {uint64_t tsc_timestamp;uint64_t ref_timestamp;uint64_t ret_addr; +uint64_t ctc_timestamp; +uint64_t ctc_delta; +uint32_t last_mtc; +uint32_t tsc_ctc_ratio_n; +uint32_t tsc_ctc_ratio_d; +uint32_t tsc_ctc_mult; +uint32_t tsc_slip; +uint32_t ctc_rem_mask; +int mtc_shift;struct intel_pt_stack stack;enum intel_pt_pkt_state pkt_state;struct intel_pt_pkt packet;
@@ -149,6 +160,13 @@ static void intel_pt_setup_period(struct intel_pt_decoder *decoder) } } +static uint64_t multdiv (uint64_t t,uint32_t n,uint32_t d) +{ +if (!d) +return 0 ; +return (t / d) * n + ((t % d) * n) / d; +} +struct intel_pt_decoder *intel_pt_decoder_new (struct intel_pt_params *params) {struct intel_pt_decoder *decoder;
@@ -175,6 +193,39 @@ struct intel_pt_decoder *intel_pt_decoder_new(struct intel_pt_params *params)intel_pt_setup_period (decoder); + decoder->mtc_shift = params->mtc_period; + decoder->ctc_rem_mask = (1 << decoder->mtc_shift) -1 ; + + decoder->tsc_ctc_ratio_n = params->tsc_ctc_ratio_n; + decoder->tsc_ctc_ratio_d = params->tsc_ctc_ratio_d; + +if (!decoder->tsc_ctc_ratio_n) + decoder->tsc_ctc_ratio_d =0 ; + +if (decoder->tsc_ctc_ratio_d) { +if (!(decoder->tsc_ctc_ratio_n % decoder->tsc_ctc_ratio_d)) + decoder->tsc_ctc_mult = decoder->tsc_ctc_ratio_n / + decoder->tsc_ctc_ratio_d; + +/* +* Allow for timestamps appearing to backwards because a TSC +* packet has slipped past a MTC packet, so allow 2 MTC ticks +* or ... +*/ + decoder->tsc_slip =multdiv (2 << decoder->mtc_shift, + decoder->tsc_ctc_ratio_n, + decoder->tsc_ctc_ratio_d); + } +/* ... or 0x100 paranoia */ +if (decoder->tsc_slip <0x100 ) + decoder->tsc_slip =0x100 ; + +intel_pt_log ("timestamp: mtc_shift %u\n" , decoder->mtc_shift); +intel_pt_log ("timestamp: tsc_ctc_ratio_n %u\n" , decoder->tsc_ctc_ratio_n); +intel_pt_log ("timestamp: tsc_ctc_ratio_d %u\n" , decoder->tsc_ctc_ratio_d); +intel_pt_log ("timestamp: tsc_ctc_mult %u\n" , decoder->tsc_ctc_mult); +intel_pt_log ("timestamp: tsc_slip %#x\n" , decoder->tsc_slip); +return decoder; }
@@ -368,6 +419,7 @@ static inline void intel_pt_update_in_tx(struct intel_pt_decoder *decoder)static int intel_pt_bad_packet (struct intel_pt_decoder *decoder) {intel_pt_clear_tx_flags (decoder); + decoder->have_tma = false; decoder->pkt_len =1 ; decoder->pkt_step =1 ;intel_pt_decoder_log_packet (decoder);
@@ -400,6 +452,7 @@ static int intel_pt_get_data(struct intel_pt_decoder *decoder) decoder->pkt_state =INTEL_PT_STATE_NO_PSB ; decoder->ref_timestamp = buffer.ref_timestamp; decoder->timestamp =0 ; + decoder->have_tma = false; decoder->state.trace_nr = buffer.trace_nr;intel_pt_log ("Reference timestamp 0x%" PRIx64"\n" , decoder->ref_timestamp);
@@ -523,6 +576,7 @@ static uint64_t intel_pt_next_sample(struct intel_pt_decoder *decoder)case INTEL_PT_PERIOD_TICKS :return intel_pt_next_period (decoder);case INTEL_PT_PERIOD_NONE : +case INTEL_PT_PERIOD_MTC :default :return 0 ; }
@@ -542,6 +596,7 @@ static void intel_pt_sample_insn(struct intel_pt_decoder *decoder) decoder->last_masked_timestamp = masked_timestamp;break ;case INTEL_PT_PERIOD_NONE : +case INTEL_PT_PERIOD_MTC :default :break ; }
@@ -555,6 +610,9 @@ static int intel_pt_walk_insn(struct intel_pt_decoder *decoder,uint64_t max_insn_cnt, insn_cnt =0 ;int err; +if (!decoder->mtc_insn) + decoder->mtc_insn = true; + max_insn_cnt =intel_pt_next_sample (decoder); err = decoder->walk_insn(intel_pt_insn, &insn_cnt, &decoder->ip, ip,
@@ -861,6 +919,8 @@ static void intel_pt_calc_tsc_timestamp(struct intel_pt_decoder *decoder) {uint64_t timestamp; + decoder->have_tma = false; +if (decoder->ref_timestamp) { timestamp = decoder->packet.payload | (decoder->ref_timestamp & (0xffULL <<56 ));
@@ -878,17 +938,18 @@ static void intel_pt_calc_tsc_timestamp(struct intel_pt_decoder *decoder) }else if (decoder->timestamp) { timestamp = decoder->packet.payload | (decoder->timestamp & (0xffULL <<56 )); + decoder->tsc_timestamp = timestamp;if (timestamp < decoder->timestamp && - decoder->timestamp - timestamp <0x100 ) { -intel_pt_log_to ("ERROR: Suppressing backwards timestamp" , + decoder->timestamp - timestamp < decoder->tsc_slip) { +intel_pt_log_to ("Suppressing backwards timestamp" , timestamp); timestamp = decoder->timestamp; }while (timestamp < decoder->timestamp) {intel_pt_log_to ("Wraparound timestamp" , timestamp); timestamp += (1ULL <<56 ); + decoder->tsc_timestamp = timestamp; } - decoder->tsc_timestamp = timestamp; decoder->timestamp = timestamp; decoder->timestamp_insn_cnt =0 ; }
@@ -900,11 +961,73 @@ static int intel_pt_overflow(struct intel_pt_decoder *decoder) {intel_pt_log ("ERROR: Buffer overflow\n" );intel_pt_clear_tx_flags (decoder); + decoder->have_tma = false; decoder->pkt_state =INTEL_PT_STATE_ERR_RESYNC ; decoder->overflow = true;return -EOVERFLOW ; } +static void intel_pt_calc_tma (struct intel_pt_decoder *decoder) +{ +uint32_t ctc = decoder->packet.payload; +uint32_t fc = decoder->packet.count; +uint32_t ctc_rem = ctc & decoder->ctc_rem_mask; + +if (!decoder->tsc_ctc_ratio_d) +return ; + + decoder->last_mtc = (ctc >> decoder->mtc_shift) &0xff ; + decoder->ctc_timestamp = decoder->tsc_timestamp - fc; +if (decoder->tsc_ctc_mult) { + decoder->ctc_timestamp -= ctc_rem * decoder->tsc_ctc_mult; + }else { + decoder->ctc_timestamp -=multdiv (ctc_rem, + decoder->tsc_ctc_ratio_n, + decoder->tsc_ctc_ratio_d); + } + decoder->ctc_delta =0 ; + decoder->have_tma = true; +intel_pt_log ("CTC timestamp " x64_fmt" last MTC %#x CTC rem %#x\n" , + decoder->ctc_timestamp, decoder->last_mtc, ctc_rem); +} + +static void intel_pt_calc_mtc_timestamp (struct intel_pt_decoder *decoder) +{ +uint64_t timestamp; +uint32_t mtc, mtc_delta; + +if (!decoder->have_tma) +return ; + + mtc = decoder->packet.payload; + +if (mtc > decoder->last_mtc) + mtc_delta = mtc - decoder->last_mtc; +else + mtc_delta = mtc +256 - decoder->last_mtc; + + decoder->ctc_delta += mtc_delta << decoder->mtc_shift; + +if (decoder->tsc_ctc_mult) { + timestamp = decoder->ctc_timestamp + + decoder->ctc_delta * decoder->tsc_ctc_mult; + }else { + timestamp = decoder->ctc_timestamp + +multdiv (decoder->ctc_delta, + decoder->tsc_ctc_ratio_n, + decoder->tsc_ctc_ratio_d); + } + +if (timestamp < decoder->timestamp) +intel_pt_log ("Suppressing MTC timestamp " x64_fmt" less than current timestamp " x64_fmt"\n" , + timestamp, decoder->timestamp); +else + decoder->timestamp = timestamp; + + decoder->timestamp_insn_cnt =0 ; + decoder->last_mtc = mtc; +} +/* Walk PSB+ packets when already in sync. */ static int intel_pt_walk_psbend (struct intel_pt_decoder *decoder) {
@@ -926,6 +1049,7 @@ static int intel_pt_walk_psbend(struct intel_pt_decoder *decoder)case INTEL_PT_TRACESTOP :case INTEL_PT_BAD :case INTEL_PT_PSB : + decoder->have_tma = false;intel_pt_log ("ERROR: Unexpected packet\n" );return -EAGAIN ;
@@ -937,6 +1061,7 @@ static int intel_pt_walk_psbend(struct intel_pt_decoder *decoder)break ;case INTEL_PT_TMA : +intel_pt_calc_tma (decoder);break ;case INTEL_PT_CBR :
@@ -961,6 +1086,9 @@ static int intel_pt_walk_psbend(struct intel_pt_decoder *decoder)break ;case INTEL_PT_MTC : +intel_pt_calc_mtc_timestamp (decoder); +if (decoder->period_type ==INTEL_PT_PERIOD_MTC ) + decoder->state.type |=INTEL_PT_INSTRUCTION ;break ;case INTEL_PT_CYC :
@@ -1048,6 +1176,9 @@ static int intel_pt_walk_fup_tip(struct intel_pt_decoder *decoder)break ;case INTEL_PT_MTC : +intel_pt_calc_mtc_timestamp (decoder); +if (decoder->period_type ==INTEL_PT_PERIOD_MTC ) + decoder->state.type |=INTEL_PT_INSTRUCTION ;break ;case INTEL_PT_CYC :
@@ -1159,13 +1290,31 @@ next:break ;case INTEL_PT_MTC : -break ; +intel_pt_calc_mtc_timestamp (decoder); +if (decoder->period_type !=INTEL_PT_PERIOD_MTC ) +break ; +/* +* Ensure that there has been an instruction since the +* last MTC. +*/ +if (!decoder->mtc_insn) +break ; + decoder->mtc_insn = false; +/* Ensure that there is a timestamp */ +if (!decoder->timestamp) +break ; + decoder->state.type =INTEL_PT_INSTRUCTION ; + decoder->state.from_ip = decoder->ip; + decoder->state.to_ip =0 ; + decoder->mtc_insn = false; +return 0 ;case INTEL_PT_TSC :intel_pt_calc_tsc_timestamp (decoder);break ;case INTEL_PT_TMA : +intel_pt_calc_tma (decoder);break ;case INTEL_PT_CYC :
@@ -1237,6 +1386,7 @@ static int intel_pt_walk_psb(struct intel_pt_decoder *decoder)break ;case INTEL_PT_MTC : +intel_pt_calc_mtc_timestamp (decoder);break ;case INTEL_PT_TSC :
@@ -1244,6 +1394,7 @@ static int intel_pt_walk_psb(struct intel_pt_decoder *decoder)break ;case INTEL_PT_TMA : +intel_pt_calc_tma (decoder);break ;case INTEL_PT_CYC :
@@ -1267,6 +1418,7 @@ static int intel_pt_walk_psb(struct intel_pt_decoder *decoder)case INTEL_PT_TRACESTOP :case INTEL_PT_TNT : + decoder->have_tma = false;intel_pt_log ("ERROR: Unexpected packet\n" );if (decoder->ip) decoder->pkt_state =INTEL_PT_STATE_ERR4 ;
@@ -1329,6 +1481,7 @@ static int intel_pt_walk_to_ip(struct intel_pt_decoder *decoder)break ;case INTEL_PT_MTC : +intel_pt_calc_mtc_timestamp (decoder);break ;case INTEL_PT_TSC :
@@ -1336,6 +1489,7 @@ static int intel_pt_walk_to_ip(struct intel_pt_decoder *decoder)break ;case INTEL_PT_TMA : +intel_pt_calc_tma (decoder);break ;case INTEL_PT_CYC :
tools/perf/util/intel-pt-decoder/intel-pt-decoder.h +1 -0
@@ -36,6 +36,7 @@ enum intel_pt_period_type {INTEL_PT_PERIOD_NONE ,INTEL_PT_PERIOD_INSTRUCTIONS ,INTEL_PT_PERIOD_TICKS , + INTEL_PT_PERIOD_MTC, }; enum {
Adrian Hunter
reviewerPATCH v8 21/25 perf tools: Add Intel PT support for using MTC packets
In reply to Adrian HunterMTC packets are a new Intel PT feature.
MTC packets provide finer grain timestamp information than TSC packets.
Support for this feature is indicated by /sys/bus/event_source/devices/intel_pt/caps/mtc which contains "1" if the feature is supported and "0" otherwise.
MTC packets can be requested using a PMU config term e.g. perf record -e intel_pt/mtc/u sleep 1
The frequency of MTC packets can also be specified. e.g. perf record -e intel_pt/mtc,mtc_period=2/u sleep 1
The default value is 3 or the nearest lower value
that is supported. 0 is always supported.
Valid values are given by:/sys/bus/event_source/devices/intel_pt/caps/mtc_periods which contains a hexadecimal value, the bits of which represent valid values e.g. bit 2 set means value 2 is valid.
The value is converted to the MTC frequency as:
CTC-frequency / (2 ^ value)
e.g. value 3 means one eighth of CTC-frequency
Where CTC is the hardware crystal clock, the frequency of which can be related to TSC via values provided in cpuid leaf 0x15.
If an invalid value is entered, the error message
will give a list of valid values e.g.
$ perf record -e intel_pt/mtc_period=15/u uname Invalid mtc_period for intel_pt. Valid values are: 0,3,6,9
tools/perf/Documentation/intel-pt.txt is updated in a later patch as there are a number of new features being added.
For more information refer to the June 2015 or later Intel 64 and IA-32 Architectures SDM Chapter 36 Intel Processor Trace.
--- tools/perf/arch/x86/util/intel-pt.c | 26 +++++++++++++++++++++++++- 1 file changed, 25 insertions(+), 1 deletion(-)
tools/perf/arch/x86/util/intel-pt.c +25 -1
@@ -190,17 +190,33 @@ static int intel_pt_pick_bit(int bits, int target)static u64 intel_pt_default_config (struct perf_pmu *intel_pt_pmu) {char buf[256 ]; +int mtc, mtc_periods =0 , mtc_period;int psb_cyc, psb_periods, psb_period;int pos =0 ;u64 config; pos +=scnprintf (buf + pos,sizeof (buf) - pos,"tsc" ); +if (perf_pmu__scan_file (intel_pt_pmu,"caps/mtc" ,"%d" , + &mtc) !=1 ) + mtc =1 ; + +if (mtc) { +if (perf_pmu__scan_file (intel_pt_pmu,"caps/mtc_periods" ,"%x" , + &mtc_periods) !=1 ) + mtc_periods =0 ; +if (mtc_periods) { + mtc_period =intel_pt_pick_bit (mtc_periods,3 ); + pos +=scnprintf (buf + pos,sizeof (buf) - pos, +",mtc,mtc_period=%d" , mtc_period); + } + } +if (perf_pmu__scan_file (intel_pt_pmu,"caps/psb_cyc" ,"%d" , &psb_cyc) !=1 ) psb_cyc =1 ; -if (psb_cyc) { +if (psb_cyc && mtc_periods) {if (perf_pmu__scan_file (intel_pt_pmu,"caps/psb_periods" ,"%x" , &psb_periods) !=1 ) psb_periods =0 ;
@@ -454,9 +470,17 @@ out_err:static int intel_pt_validate_config (struct perf_pmu *intel_pt_pmu,struct perf_evsel *evsel) { +int err; +if (!evsel)return 0 ; + err =intel_pt_val_config_term (intel_pt_pmu,"caps/mtc_periods" , +"mtc_period" ,"caps/mtc" , + evsel->attr.config); +if (err) +return err; +return intel_pt_val_config_term (intel_pt_pmu,"caps/psb_periods" ,"psb_period" ,"caps/psb_cyc" , evsel->attr.config);
Signature · 1 line
1.9.1
tip-bot for Adrian Hunter
merge bot[tip:perf/core] perf tools: Add Intel PT support for using MTC packets
perf tools: Add Intel PT support for using MTC packets
Commit-ID: b45fc0bfaf4a0b60ce2deda222f8ef2a23b89a5f Gitweb: http://git.kernel.org/tip/b45fc0bfaf4a0b60ce2deda222f8ef2a23b89a5f Author: Adrian Hunter <[email protected]> AuthorDate: Fri, 17 Jul 2015 19:33:56 +0300 Committer: Arnaldo Carvalho de Melo <[email protected]> CommitDate: Mon, 24 Aug 2015 17:48:06 -0300
perf tools: Add Intel PT support for using MTC packets
MTC packets are a new Intel PT feature.
MTC packets provide finer grain timestamp information than TSC packets.
Support for this feature is indicated by:
/sys/bus/event_source/devices/intel_pt/caps/mtc
which contains "1" if the feature is supported and "0" otherwise.
MTC packets can be requested using a PMU config term e.g. perf record -e intel_pt/mtc/u sleep 1
The frequency of MTC packets can also be specified. e.g. perf record -e intel_pt/mtc,mtc_period=2/u sleep 1
The default value is 3 or the nearest lower value that is supported. 0 is always supported.
Valid values are given by:
/sys/bus/event_source/devices/intel_pt/caps/mtc_periods
which contains a hexadecimal value, the bits of which represent valid values e.g. bit 2 set means value 2 is valid.
The value is converted to the MTC frequency as:
CTC-frequency / (2 ^ value)
e.g. value 3 means one eighth of CTC-frequency
Where CTC is the hardware crystal clock, the frequency of which can be related to TSC via values provided in cpuid leaf 0x15.
If an invalid value is entered, the error message will give a list of valid values e.g.
$ perf record -e intel_pt/mtc_period=15/u uname Invalid mtc_period for intel_pt. Valid values are: 0,3,6,9
tools/perf/Documentation/intel-pt.txt is updated in a later patch as there are a number of new features being added.
For more information refer to the June 2015 or later Intel 64 and IA-32 Architectures SDM Chapter 36 Intel Processor Trace.
--- tools/perf/arch/x86/util/intel-pt.c | 26 +++++++++++++++++++++++++- 1 file changed, 25 insertions(+), 1 deletion(-)
tools/perf/arch/x86/util/intel-pt.c +25 -1
@@ -190,17 +190,33 @@ static int intel_pt_pick_bit(int bits, int target)static u64 intel_pt_default_config (struct perf_pmu *intel_pt_pmu) {char buf[256 ]; +int mtc, mtc_periods =0 , mtc_period;int psb_cyc, psb_periods, psb_period;int pos =0 ;u64 config; pos +=scnprintf (buf + pos,sizeof (buf) - pos,"tsc" ); +if (perf_pmu__scan_file (intel_pt_pmu,"caps/mtc" ,"%d" , + &mtc) !=1 ) + mtc =1 ; + +if (mtc) { +if (perf_pmu__scan_file (intel_pt_pmu,"caps/mtc_periods" ,"%x" , + &mtc_periods) !=1 ) + mtc_periods =0 ; +if (mtc_periods) { + mtc_period =intel_pt_pick_bit (mtc_periods,3 ); + pos +=scnprintf (buf + pos,sizeof (buf) - pos, +",mtc,mtc_period=%d" , mtc_period); + } + } +if (perf_pmu__scan_file (intel_pt_pmu,"caps/psb_cyc" ,"%d" , &psb_cyc) !=1 ) psb_cyc =1 ; -if (psb_cyc) { +if (psb_cyc && mtc_periods) {if (perf_pmu__scan_file (intel_pt_pmu,"caps/psb_periods" ,"%x" , &psb_periods) !=1 ) psb_periods =0 ;
@@ -454,9 +470,17 @@ out_err:static int intel_pt_validate_config (struct perf_pmu *intel_pt_pmu,struct perf_evsel *evsel) { +int err; +if (!evsel)return 0 ; + err =intel_pt_val_config_term (intel_pt_pmu,"caps/mtc_periods" , +"mtc_period" ,"caps/mtc" , + evsel->attr.config); +if (err) +return err; +return intel_pt_val_config_term (intel_pt_pmu,"caps/psb_periods" ,"psb_period" ,"caps/psb_cyc" , evsel->attr.config);
Adrian Hunter
reviewerPATCH v8 22/25 perf tools: Add Intel PT support for decoding CYC packets
In reply to Adrian HunterCYC packets provide even finer grain timestamp information than MTC and TSC packets. A CYC packet contains the number of CPU cycles since the last CYC packet.
This patch just adds decoder support. The CPU frequency can be related to TSC using the Maximum Non-Turbo Ratio in combination with the CBR (core-to-bus ratio) packet. However more accuracy is achieved by simply interpolating the number of cycles between other timing packets like MTC or TSC. This patch takes the latter approach.
Support for a default value and validation of values is provided by a later patch. Also documentation is updated in a separate patch.
For details refer to the June 2015 or later Intel 64 and IA-32 Architectures SDM Chapter 36 Intel Processor Trace.
--- .../perf/util/intel-pt-decoder/intel-pt-decoder.c | 311 ++++++++++++++++++++- 1 file changed, 306 insertions(+), 5 deletions(-)
tools/perf/util/intel-pt-decoder/intel-pt-decoder.c +306 -5
@@ -88,6 +88,7 @@ struct intel_pt_decoder {bool mtc_insn;bool pge;bool have_tma; +bool have_cyc;uint64_t pos;uint64_t last_ip;uint64_t ip;
@@ -98,6 +99,8 @@ struct intel_pt_decoder {uint64_t ret_addr;uint64_t ctc_timestamp;uint64_t ctc_delta; +uint64_t cycle_cnt; +uint64_t cyc_ref_timestamp;uint32_t last_mtc;uint32_t tsc_ctc_ratio_n;uint32_t tsc_ctc_ratio_d;
@@ -111,8 +114,13 @@ struct intel_pt_decoder {struct intel_pt_pkt tnt;int pkt_step;int pkt_len; +int last_packet_type;unsigned int cbr;unsigned int max_non_turbo_ratio; +double max_non_turbo_ratio_fp; +double cbr_cyc_to_tsc; +double calc_cyc_to_tsc; +bool have_calc_cyc_to_tsc;int exec_mode;unsigned int insn_bytes;uint64_t sign_bit;
@@ -189,7 +197,8 @@ struct intel_pt_decoder *intel_pt_decoder_new(struct intel_pt_params *params) decoder->period = params->period; decoder->period_type = params->period_type; - decoder->max_non_turbo_ratio = params->max_non_turbo_ratio; + decoder->max_non_turbo_ratio = params->max_non_turbo_ratio; + decoder->max_non_turbo_ratio_fp = params->max_non_turbo_ratio;intel_pt_setup_period (decoder);
@@ -514,10 +523,247 @@ static int intel_pt_get_split_packet(struct intel_pt_decoder *decoder)return ret; } +struct intel_pt_pkt_info { +struct intel_pt_decoder *decoder; +struct intel_pt_pkt packet; +uint64_t pos; +int pkt_len; +int last_packet_type; +void *data; +}; + +typedef int (*intel_pt_pkt_cb_t )(struct intel_pt_pkt_info *pkt_info); + +/* Lookahead packets in current buffer */ +static int intel_pt_pkt_lookahead (struct intel_pt_decoder *decoder, +intel_pt_pkt_cb_t cb,void *data) +{ +struct intel_pt_pkt_info pkt_info; +const unsigned char *buf = decoder->buf; +size_t len = decoder->len; +int ret; + + pkt_info.decoder = decoder; + pkt_info.pos = decoder->pos; + pkt_info.pkt_len = decoder->pkt_step; + pkt_info.last_packet_type = decoder->last_packet_type; + pkt_info.data = data; + +while (1 ) { +do { + pkt_info.pos += pkt_info.pkt_len; + buf += pkt_info.pkt_len; + len -= pkt_info.pkt_len; + +if (!len) +return INTEL_PT_NEED_MORE_BYTES ; + + ret =intel_pt_get_packet (buf, len, &pkt_info.packet); +if (!ret) +return INTEL_PT_NEED_MORE_BYTES ; +if (ret <0 ) +return ret; + + pkt_info.pkt_len = ret; + }while (pkt_info.packet.type ==INTEL_PT_PAD ); + + ret =cb (&pkt_info); +if (ret) +return 0 ; + + pkt_info.last_packet_type = pkt_info.packet.type; + } +} + +struct intel_pt_calc_cyc_to_tsc_info { +uint64_t cycle_cnt; +unsigned int cbr; +uint32_t last_mtc; +uint64_t ctc_timestamp; +uint64_t ctc_delta; +uint64_t tsc_timestamp; +uint64_t timestamp; +bool have_tma; +bool from_mtc; +double cbr_cyc_to_tsc; +}; + +static int intel_pt_calc_cyc_cb (struct intel_pt_pkt_info *pkt_info) +{ +struct intel_pt_decoder *decoder = pkt_info->decoder; +struct intel_pt_calc_cyc_to_tsc_info *data = pkt_info->data; +uint64_t timestamp; +double cyc_to_tsc; +unsigned int cbr; +uint32_t mtc, mtc_delta, ctc, fc, ctc_rem; + +switch (pkt_info->packet.type) { +case INTEL_PT_TNT : +case INTEL_PT_TIP_PGE : +case INTEL_PT_TIP : +case INTEL_PT_FUP : +case INTEL_PT_PSB : +case INTEL_PT_PIP : +case INTEL_PT_MODE_EXEC : +case INTEL_PT_MODE_TSX : +case INTEL_PT_PSBEND : +case INTEL_PT_PAD : +case INTEL_PT_VMCS : +case INTEL_PT_MNT : +return 0 ; + +case INTEL_PT_MTC : +if (!data->have_tma) +return 0 ; + + mtc = pkt_info->packet.payload; +if (mtc > data->last_mtc) + mtc_delta = mtc - data->last_mtc; +else + mtc_delta = mtc +256 - data->last_mtc; + data->ctc_delta += mtc_delta << decoder->mtc_shift; + data->last_mtc = mtc; + +if (decoder->tsc_ctc_mult) { + timestamp = data->ctc_timestamp + + data->ctc_delta * decoder->tsc_ctc_mult; + }else { + timestamp = data->ctc_timestamp + +multdiv (data->ctc_delta, + decoder->tsc_ctc_ratio_n, + decoder->tsc_ctc_ratio_d); + } + +if (timestamp < data->timestamp) +return 1 ; + +if (pkt_info->last_packet_type !=INTEL_PT_CYC ) { + data->timestamp = timestamp; +return 0 ; + } + +break ; + +case INTEL_PT_TSC : + timestamp = pkt_info->packet.payload | + (data->timestamp & (0xffULL <<56 )); +if (data->from_mtc && timestamp < data->timestamp && + data->timestamp - timestamp < decoder->tsc_slip) +return 1 ; +while (timestamp < data->timestamp) + timestamp += (1ULL <<56 ); +if (pkt_info->last_packet_type !=INTEL_PT_CYC ) { +if (data->from_mtc) +return 1 ; + data->tsc_timestamp = timestamp; + data->timestamp = timestamp; +return 0 ; + } +break ; + +case INTEL_PT_TMA : +if (data->from_mtc) +return 1 ; + +if (!decoder->tsc_ctc_ratio_d) +return 0 ; + + ctc = pkt_info->packet.payload; + fc = pkt_info->packet.count; + ctc_rem = ctc & decoder->ctc_rem_mask; + + data->last_mtc = (ctc >> decoder->mtc_shift) &0xff ; + + data->ctc_timestamp = data->tsc_timestamp - fc; +if (decoder->tsc_ctc_mult) { + data->ctc_timestamp -= ctc_rem * decoder->tsc_ctc_mult; + }else { + data->ctc_timestamp -= +multdiv (ctc_rem, decoder->tsc_ctc_ratio_n, + decoder->tsc_ctc_ratio_d); + } + + data->ctc_delta =0 ; + data->have_tma = true; + +return 0 ; + +case INTEL_PT_CYC : + data->cycle_cnt += pkt_info->packet.payload; +return 0 ; + +case INTEL_PT_CBR : + cbr = pkt_info->packet.payload; +if (data->cbr && data->cbr != cbr) +return 1 ; + data->cbr = cbr; + data->cbr_cyc_to_tsc = decoder->max_non_turbo_ratio_fp / cbr; +return 0 ; + +case INTEL_PT_TIP_PGD : +case INTEL_PT_TRACESTOP : +case INTEL_PT_OVF : +case INTEL_PT_BAD :/* Does not happen */ +default : +return 1 ; + } + +if (!data->cbr && decoder->cbr) { + data->cbr = decoder->cbr; + data->cbr_cyc_to_tsc = decoder->cbr_cyc_to_tsc; + } + +if (!data->cycle_cnt) +return 1 ; + + cyc_to_tsc = (double )(timestamp - decoder->timestamp) / data->cycle_cnt; + +if (data->cbr && cyc_to_tsc > data->cbr_cyc_to_tsc && + cyc_to_tsc / data->cbr_cyc_to_tsc >1.25 ) { +intel_pt_log ("Timestamp: calculated %g TSC ticks per cycle too big (c.f. CBR-based value %g), pos " x64_fmt"\n" , + cyc_to_tsc, data->cbr_cyc_to_tsc, pkt_info->pos); +return 1 ; + } + + decoder->calc_cyc_to_tsc = cyc_to_tsc; + decoder->have_calc_cyc_to_tsc = true; + +if (data->cbr) { +intel_pt_log ("Timestamp: calculated %g TSC ticks per cycle c.f. CBR-based value %g, pos " x64_fmt"\n" , + cyc_to_tsc, data->cbr_cyc_to_tsc, pkt_info->pos); + }else { +intel_pt_log ("Timestamp: calculated %g TSC ticks per cycle c.f. unknown CBR-based value, pos " x64_fmt"\n" , + cyc_to_tsc, pkt_info->pos); + } + +return 1 ; +} + +static void intel_pt_calc_cyc_to_tsc (struct intel_pt_decoder *decoder, +bool from_mtc) +{ +struct intel_pt_calc_cyc_to_tsc_info data = { + .cycle_cnt =0 , + .cbr =0 , + .last_mtc = decoder->last_mtc, + .ctc_timestamp = decoder->ctc_timestamp, + .ctc_delta = decoder->ctc_delta, + .tsc_timestamp = decoder->tsc_timestamp, + .timestamp = decoder->timestamp, + .have_tma = decoder->have_tma, + .from_mtc = from_mtc, + .cbr_cyc_to_tsc =0 , + }; + +intel_pt_pkt_lookahead (decoder, intel_pt_calc_cyc_cb, &data); +} +static int intel_pt_get_next_packet (struct intel_pt_decoder *decoder) {int ret; + decoder->last_packet_type = decoder->packet.type; + do { decoder->pos += decoder->pkt_step; decoder->buf += decoder->pkt_step;
@@ -954,6 +1200,13 @@ static void intel_pt_calc_tsc_timestamp(struct intel_pt_decoder *decoder) decoder->timestamp_insn_cnt =0 ; } +if (decoder->last_packet_type ==INTEL_PT_CYC ) { + decoder->cyc_ref_timestamp = decoder->timestamp; + decoder->cycle_cnt =0 ; + decoder->have_calc_cyc_to_tsc = false; +intel_pt_calc_cyc_to_tsc (decoder, false); + } +intel_pt_log_to ("Setting timestamp" , decoder->timestamp); }
@@ -962,6 +1215,7 @@ static int intel_pt_overflow(struct intel_pt_decoder *decoder)intel_pt_log ("ERROR: Buffer overflow\n" );intel_pt_clear_tx_flags (decoder); decoder->have_tma = false; + decoder->cbr =0 ; decoder->pkt_state =INTEL_PT_STATE_ERR_RESYNC ; decoder->overflow = true;return -EOVERFLOW ;
@@ -1026,6 +1280,49 @@ static void intel_pt_calc_mtc_timestamp(struct intel_pt_decoder *decoder) decoder->timestamp_insn_cnt =0 ; decoder->last_mtc = mtc; + +if (decoder->last_packet_type ==INTEL_PT_CYC ) { + decoder->cyc_ref_timestamp = decoder->timestamp; + decoder->cycle_cnt =0 ; + decoder->have_calc_cyc_to_tsc = false; +intel_pt_calc_cyc_to_tsc (decoder, true); + } +} + +static void intel_pt_calc_cbr (struct intel_pt_decoder *decoder) +{ +unsigned int cbr = decoder->packet.payload; + +if (decoder->cbr == cbr) +return ; + + decoder->cbr = cbr; + decoder->cbr_cyc_to_tsc = decoder->max_non_turbo_ratio_fp / cbr; +} + +static void intel_pt_calc_cyc_timestamp (struct intel_pt_decoder *decoder) +{ +uint64_t timestamp = decoder->cyc_ref_timestamp; + + decoder->have_cyc = true; + + decoder->cycle_cnt += decoder->packet.payload; + +if (!decoder->cyc_ref_timestamp) +return ; + +if (decoder->have_calc_cyc_to_tsc) + timestamp += decoder->cycle_cnt * decoder->calc_cyc_to_tsc; +else if (decoder->cbr) + timestamp += decoder->cycle_cnt * decoder->cbr_cyc_to_tsc; +else +return ; + +if (timestamp < decoder->timestamp) +intel_pt_log ("Suppressing CYC timestamp " x64_fmt" less than current timestamp " x64_fmt"\n" , + timestamp, decoder->timestamp); +else + decoder->timestamp = timestamp; }/* Walk PSB+ packets when already in sync. */
@@ -1065,7 +1362,7 @@ static int intel_pt_walk_psbend(struct intel_pt_decoder *decoder)break ;case INTEL_PT_CBR : - decoder->cbr = decoder->packet.payload; +intel_pt_calc_cbr (decoder);break ;case INTEL_PT_MODE_EXEC :
@@ -1182,6 +1479,7 @@ static int intel_pt_walk_fup_tip(struct intel_pt_decoder *decoder)break ;case INTEL_PT_CYC : +intel_pt_calc_cyc_timestamp (decoder);break ;case INTEL_PT_MODE_EXEC :
@@ -1318,10 +1616,11 @@ next:break ;case INTEL_PT_CYC : +intel_pt_calc_cyc_timestamp (decoder);break ;case INTEL_PT_CBR : - decoder->cbr = decoder->packet.payload; +intel_pt_calc_cbr (decoder);break ;case INTEL_PT_MODE_EXEC :
@@ -1398,10 +1697,11 @@ static int intel_pt_walk_psb(struct intel_pt_decoder *decoder)break ;case INTEL_PT_CYC : +intel_pt_calc_cyc_timestamp (decoder);break ;case INTEL_PT_CBR : - decoder->cbr = decoder->packet.payload; +intel_pt_calc_cbr (decoder);break ;case INTEL_PT_PIP :
@@ -1493,10 +1793,11 @@ static int intel_pt_walk_to_ip(struct intel_pt_decoder *decoder)break ;case INTEL_PT_CYC : +intel_pt_calc_cyc_timestamp (decoder);break ;case INTEL_PT_CBR : - decoder->cbr = decoder->packet.payload; +intel_pt_calc_cbr (decoder);break ;case INTEL_PT_PIP :
Signature · 1 line
1.9.1
tip-bot for Adrian Hunter
merge bot[tip:perf/core] perf tools: Add Intel PT support for decoding CYC packets
perf tools: Add Intel PT support for decoding CYC packets
Commit-ID: cc33618619cefc6d730cca3bb8e15311016a4da7 Gitweb: http://git.kernel.org/tip/cc33618619cefc6d730cca3bb8e15311016a4da7 Author: Adrian Hunter <[email protected]> AuthorDate: Fri, 17 Jul 2015 19:33:57 +0300 Committer: Arnaldo Carvalho de Melo <[email protected]> CommitDate: Mon, 24 Aug 2015 17:49:04 -0300
perf tools: Add Intel PT support for decoding CYC packets
CYC packets provide even finer grain timestamp information than MTC and TSC packets. A CYC packet contains the number of CPU cycles since the last CYC packet.
This patch just adds decoder support. The CPU frequency can be related to TSC using the Maximum Non-Turbo Ratio in combination with the CBR (core-to-bus ratio) packet. However more accuracy is achieved by simply interpolating the number of cycles between other timing packets like MTC or TSC. This patch takes the latter approach.
Support for a default value and validation of values is provided by a later patch. Also documentation is updated in a separate patch.
For details refer to the June 2015 or later Intel 64 and IA-32 Architectures SDM Chapter 36 Intel Processor Trace.
--- .../perf/util/intel-pt-decoder/intel-pt-decoder.c | 311 ++++++++++++++++++++- 1 file changed, 306 insertions(+), 5 deletions(-)
tools/perf/util/intel-pt-decoder/intel-pt-decoder.c +306 -5
@@ -88,6 +88,7 @@ struct intel_pt_decoder {bool mtc_insn;bool pge;bool have_tma; +bool have_cyc;uint64_t pos;uint64_t last_ip;uint64_t ip;
@@ -98,6 +99,8 @@ struct intel_pt_decoder {uint64_t ret_addr;uint64_t ctc_timestamp;uint64_t ctc_delta; +uint64_t cycle_cnt; +uint64_t cyc_ref_timestamp;uint32_t last_mtc;uint32_t tsc_ctc_ratio_n;uint32_t tsc_ctc_ratio_d;
@@ -111,8 +114,13 @@ struct intel_pt_decoder {struct intel_pt_pkt tnt;int pkt_step;int pkt_len; +int last_packet_type;unsigned int cbr;unsigned int max_non_turbo_ratio; +double max_non_turbo_ratio_fp; +double cbr_cyc_to_tsc; +double calc_cyc_to_tsc; +bool have_calc_cyc_to_tsc;int exec_mode;unsigned int insn_bytes;uint64_t sign_bit;
@@ -189,7 +197,8 @@ struct intel_pt_decoder *intel_pt_decoder_new(struct intel_pt_params *params) decoder->period = params->period; decoder->period_type = params->period_type; - decoder->max_non_turbo_ratio = params->max_non_turbo_ratio; + decoder->max_non_turbo_ratio = params->max_non_turbo_ratio; + decoder->max_non_turbo_ratio_fp = params->max_non_turbo_ratio;intel_pt_setup_period (decoder);
@@ -514,10 +523,247 @@ static int intel_pt_get_split_packet(struct intel_pt_decoder *decoder)return ret; } +struct intel_pt_pkt_info { +struct intel_pt_decoder *decoder; +struct intel_pt_pkt packet; +uint64_t pos; +int pkt_len; +int last_packet_type; +void *data; +}; + +typedef int (*intel_pt_pkt_cb_t )(struct intel_pt_pkt_info *pkt_info); + +/* Lookahead packets in current buffer */ +static int intel_pt_pkt_lookahead (struct intel_pt_decoder *decoder, +intel_pt_pkt_cb_t cb,void *data) +{ +struct intel_pt_pkt_info pkt_info; +const unsigned char *buf = decoder->buf; +size_t len = decoder->len; +int ret; + + pkt_info.decoder = decoder; + pkt_info.pos = decoder->pos; + pkt_info.pkt_len = decoder->pkt_step; + pkt_info.last_packet_type = decoder->last_packet_type; + pkt_info.data = data; + +while (1 ) { +do { + pkt_info.pos += pkt_info.pkt_len; + buf += pkt_info.pkt_len; + len -= pkt_info.pkt_len; + +if (!len) +return INTEL_PT_NEED_MORE_BYTES ; + + ret =intel_pt_get_packet (buf, len, &pkt_info.packet); +if (!ret) +return INTEL_PT_NEED_MORE_BYTES ; +if (ret <0 ) +return ret; + + pkt_info.pkt_len = ret; + }while (pkt_info.packet.type ==INTEL_PT_PAD ); + + ret =cb (&pkt_info); +if (ret) +return 0 ; + + pkt_info.last_packet_type = pkt_info.packet.type; + } +} + +struct intel_pt_calc_cyc_to_tsc_info { +uint64_t cycle_cnt; +unsigned int cbr; +uint32_t last_mtc; +uint64_t ctc_timestamp; +uint64_t ctc_delta; +uint64_t tsc_timestamp; +uint64_t timestamp; +bool have_tma; +bool from_mtc; +double cbr_cyc_to_tsc; +}; + +static int intel_pt_calc_cyc_cb (struct intel_pt_pkt_info *pkt_info) +{ +struct intel_pt_decoder *decoder = pkt_info->decoder; +struct intel_pt_calc_cyc_to_tsc_info *data = pkt_info->data; +uint64_t timestamp; +double cyc_to_tsc; +unsigned int cbr; +uint32_t mtc, mtc_delta, ctc, fc, ctc_rem; + +switch (pkt_info->packet.type) { +case INTEL_PT_TNT : +case INTEL_PT_TIP_PGE : +case INTEL_PT_TIP : +case INTEL_PT_FUP : +case INTEL_PT_PSB : +case INTEL_PT_PIP : +case INTEL_PT_MODE_EXEC : +case INTEL_PT_MODE_TSX : +case INTEL_PT_PSBEND : +case INTEL_PT_PAD : +case INTEL_PT_VMCS : +case INTEL_PT_MNT : +return 0 ; + +case INTEL_PT_MTC : +if (!data->have_tma) +return 0 ; + + mtc = pkt_info->packet.payload; +if (mtc > data->last_mtc) + mtc_delta = mtc - data->last_mtc; +else + mtc_delta = mtc +256 - data->last_mtc; + data->ctc_delta += mtc_delta << decoder->mtc_shift; + data->last_mtc = mtc; + +if (decoder->tsc_ctc_mult) { + timestamp = data->ctc_timestamp + + data->ctc_delta * decoder->tsc_ctc_mult; + }else { + timestamp = data->ctc_timestamp + +multdiv (data->ctc_delta, + decoder->tsc_ctc_ratio_n, + decoder->tsc_ctc_ratio_d); + } + +if (timestamp < data->timestamp) +return 1 ; + +if (pkt_info->last_packet_type !=INTEL_PT_CYC ) { + data->timestamp = timestamp; +return 0 ; + } + +break ; + +case INTEL_PT_TSC : + timestamp = pkt_info->packet.payload | + (data->timestamp & (0xffULL <<56 )); +if (data->from_mtc && timestamp < data->timestamp && + data->timestamp - timestamp < decoder->tsc_slip) +return 1 ; +while (timestamp < data->timestamp) + timestamp += (1ULL <<56 ); +if (pkt_info->last_packet_type !=INTEL_PT_CYC ) { +if (data->from_mtc) +return 1 ; + data->tsc_timestamp = timestamp; + data->timestamp = timestamp; +return 0 ; + } +break ; + +case INTEL_PT_TMA : +if (data->from_mtc) +return 1 ; + +if (!decoder->tsc_ctc_ratio_d) +return 0 ; + + ctc = pkt_info->packet.payload; + fc = pkt_info->packet.count; + ctc_rem = ctc & decoder->ctc_rem_mask; + + data->last_mtc = (ctc >> decoder->mtc_shift) &0xff ; + + data->ctc_timestamp = data->tsc_timestamp - fc; +if (decoder->tsc_ctc_mult) { + data->ctc_timestamp -= ctc_rem * decoder->tsc_ctc_mult; + }else { + data->ctc_timestamp -= +multdiv (ctc_rem, decoder->tsc_ctc_ratio_n, + decoder->tsc_ctc_ratio_d); + } + + data->ctc_delta =0 ; + data->have_tma = true; + +return 0 ; + +case INTEL_PT_CYC : + data->cycle_cnt += pkt_info->packet.payload; +return 0 ; + +case INTEL_PT_CBR : + cbr = pkt_info->packet.payload; +if (data->cbr && data->cbr != cbr) +return 1 ; + data->cbr = cbr; + data->cbr_cyc_to_tsc = decoder->max_non_turbo_ratio_fp / cbr; +return 0 ; + +case INTEL_PT_TIP_PGD : +case INTEL_PT_TRACESTOP : +case INTEL_PT_OVF : +case INTEL_PT_BAD :/* Does not happen */ +default : +return 1 ; + } + +if (!data->cbr && decoder->cbr) { + data->cbr = decoder->cbr; + data->cbr_cyc_to_tsc = decoder->cbr_cyc_to_tsc; + } + +if (!data->cycle_cnt) +return 1 ; + + cyc_to_tsc = (double )(timestamp - decoder->timestamp) / data->cycle_cnt; + +if (data->cbr && cyc_to_tsc > data->cbr_cyc_to_tsc && + cyc_to_tsc / data->cbr_cyc_to_tsc >1.25 ) { +intel_pt_log ("Timestamp: calculated %g TSC ticks per cycle too big (c.f. CBR-based value %g), pos " x64_fmt"\n" , + cyc_to_tsc, data->cbr_cyc_to_tsc, pkt_info->pos); +return 1 ; + } + + decoder->calc_cyc_to_tsc = cyc_to_tsc; + decoder->have_calc_cyc_to_tsc = true; + +if (data->cbr) { +intel_pt_log ("Timestamp: calculated %g TSC ticks per cycle c.f. CBR-based value %g, pos " x64_fmt"\n" , + cyc_to_tsc, data->cbr_cyc_to_tsc, pkt_info->pos); + }else { +intel_pt_log ("Timestamp: calculated %g TSC ticks per cycle c.f. unknown CBR-based value, pos " x64_fmt"\n" , + cyc_to_tsc, pkt_info->pos); + } + +return 1 ; +} + +static void intel_pt_calc_cyc_to_tsc (struct intel_pt_decoder *decoder, +bool from_mtc) +{ +struct intel_pt_calc_cyc_to_tsc_info data = { + .cycle_cnt =0 , + .cbr =0 , + .last_mtc = decoder->last_mtc, + .ctc_timestamp = decoder->ctc_timestamp, + .ctc_delta = decoder->ctc_delta, + .tsc_timestamp = decoder->tsc_timestamp, + .timestamp = decoder->timestamp, + .have_tma = decoder->have_tma, + .from_mtc = from_mtc, + .cbr_cyc_to_tsc =0 , + }; + +intel_pt_pkt_lookahead (decoder, intel_pt_calc_cyc_cb, &data); +} +static int intel_pt_get_next_packet (struct intel_pt_decoder *decoder) {int ret; + decoder->last_packet_type = decoder->packet.type; + do { decoder->pos += decoder->pkt_step; decoder->buf += decoder->pkt_step;
@@ -954,6 +1200,13 @@ static void intel_pt_calc_tsc_timestamp(struct intel_pt_decoder *decoder) decoder->timestamp_insn_cnt =0 ; } +if (decoder->last_packet_type ==INTEL_PT_CYC ) { + decoder->cyc_ref_timestamp = decoder->timestamp; + decoder->cycle_cnt =0 ; + decoder->have_calc_cyc_to_tsc = false; +intel_pt_calc_cyc_to_tsc (decoder, false); + } +intel_pt_log_to ("Setting timestamp" , decoder->timestamp); }
@@ -962,6 +1215,7 @@ static int intel_pt_overflow(struct intel_pt_decoder *decoder)intel_pt_log ("ERROR: Buffer overflow\n" );intel_pt_clear_tx_flags (decoder); decoder->have_tma = false; + decoder->cbr =0 ; decoder->pkt_state =INTEL_PT_STATE_ERR_RESYNC ; decoder->overflow = true;return -EOVERFLOW ;
@@ -1026,6 +1280,49 @@ static void intel_pt_calc_mtc_timestamp(struct intel_pt_decoder *decoder) decoder->timestamp_insn_cnt =0 ; decoder->last_mtc = mtc; + +if (decoder->last_packet_type ==INTEL_PT_CYC ) { + decoder->cyc_ref_timestamp = decoder->timestamp; + decoder->cycle_cnt =0 ; + decoder->have_calc_cyc_to_tsc = false; +intel_pt_calc_cyc_to_tsc (decoder, true); + } +} + +static void intel_pt_calc_cbr (struct intel_pt_decoder *decoder) +{ +unsigned int cbr = decoder->packet.payload; + +if (decoder->cbr == cbr) +return ; + + decoder->cbr = cbr; + decoder->cbr_cyc_to_tsc = decoder->max_non_turbo_ratio_fp / cbr; +} + +static void intel_pt_calc_cyc_timestamp (struct intel_pt_decoder *decoder) +{ +uint64_t timestamp = decoder->cyc_ref_timestamp; + + decoder->have_cyc = true; + + decoder->cycle_cnt += decoder->packet.payload; + +if (!decoder->cyc_ref_timestamp) +return ; + +if (decoder->have_calc_cyc_to_tsc) + timestamp += decoder->cycle_cnt * decoder->calc_cyc_to_tsc; +else if (decoder->cbr) + timestamp += decoder->cycle_cnt * decoder->cbr_cyc_to_tsc; +else +return ; + +if (timestamp < decoder->timestamp) +intel_pt_log ("Suppressing CYC timestamp " x64_fmt" less than current timestamp " x64_fmt"\n" , + timestamp, decoder->timestamp); +else + decoder->timestamp = timestamp; }/* Walk PSB+ packets when already in sync. */
@@ -1065,7 +1362,7 @@ static int intel_pt_walk_psbend(struct intel_pt_decoder *decoder)break ;case INTEL_PT_CBR : - decoder->cbr = decoder->packet.payload; +intel_pt_calc_cbr (decoder);break ;case INTEL_PT_MODE_EXEC :
@@ -1182,6 +1479,7 @@ static int intel_pt_walk_fup_tip(struct intel_pt_decoder *decoder)break ;case INTEL_PT_CYC : +intel_pt_calc_cyc_timestamp (decoder);break ;case INTEL_PT_MODE_EXEC :
@@ -1318,10 +1616,11 @@ next:break ;case INTEL_PT_CYC : +intel_pt_calc_cyc_timestamp (decoder);break ;case INTEL_PT_CBR : - decoder->cbr = decoder->packet.payload; +intel_pt_calc_cbr (decoder);break ;case INTEL_PT_MODE_EXEC :
@@ -1398,10 +1697,11 @@ static int intel_pt_walk_psb(struct intel_pt_decoder *decoder)break ;case INTEL_PT_CYC : +intel_pt_calc_cyc_timestamp (decoder);break ;case INTEL_PT_CBR : - decoder->cbr = decoder->packet.payload; +intel_pt_calc_cbr (decoder);break ;case INTEL_PT_PIP :
@@ -1493,10 +1793,11 @@ static int intel_pt_walk_to_ip(struct intel_pt_decoder *decoder)break ;case INTEL_PT_CYC : +intel_pt_calc_cyc_timestamp (decoder);break ;case INTEL_PT_CBR : - decoder->cbr = decoder->packet.payload; +intel_pt_calc_cbr (decoder);break ;case INTEL_PT_PIP :
Adrian Hunter
reviewerPATCH v8 23/25 perf tools: Add Intel PT support for using CYC packets
In reply to Adrian HunterCYC packets are a new Intel PT feature.
CYC packets provide even finer grain timestamp information than MTC and TSC packets. A CYC packet contains the number of CPU cycles since the last CYC packet. Unlike MTC and TSC packets, CYC packets are only sent when another packet is also sent.
Support for this feature is indicated by /sys/bus/event_source/devices/intel_pt/caps/psb_cyc which contains "1" if the feature is supported and "0" otherwise.
CYC packets can be requested using a PMU config term e.g. perf record -e intel_pt/cyc/u sleep 1
The frequency of CYC packets can also be specified. e.g. perf record -e intel_pt/cyc,cyc_thresh=2/u sleep 1
CYC packets are not requested by default.
Valid cyc_thresh values are given by:/sys/bus/event_source/devices/intel_pt/caps/cycle_thresholds which contains a hexadecimal value, the bits of which represent valid values e.g. bit 2 set means value 2 is valid.
The value represents the minimum number of CPU cycles that must have passed before a CYC packet can be sent. The number of CPU cycles is:
2 ^ (value - 1)
e.g. value 4 means 8 CPU cycles must pass before a CYC packet can be sent. Note a CYC packet is still only sent when another packet is sent, not at, e.g. every 8 CPU cycles.
If an invalid value is entered, the error message
will give a list of valid values e.g.
$ perf record -e intel_pt/cyc,cyc_thresh=15/u uname
Invalid cyc_thresh for intel_pt. Valid values are: 0-12tools/perf/Documentation/intel-pt.txt is updated in a later patch as there are a number of new features being added.
For more information refer to the June 2015 or later Intel 64 and IA-32 Architectures SDM Chapter 36 Intel Processor Trace.
--- tools/perf/arch/x86/util/intel-pt.c | 6 ++++++ 1 file changed, 6 insertions(+)
tools/perf/arch/x86/util/intel-pt.c +6 -0
@@ -475,6 +475,12 @@ static int intel_pt_validate_config(struct perf_pmu *intel_pt_pmu,if (!evsel)return 0 ; + err =intel_pt_val_config_term (intel_pt_pmu,"caps/cycle_thresholds" , +"cyc_thresh" ,"caps/psb_cyc" , + evsel->attr.config); +if (err) +return err; + err =intel_pt_val_config_term (intel_pt_pmu,"caps/mtc_periods" ,"mtc_period" ,"caps/mtc" , evsel->attr.config);
Signature · 1 line
1.9.1
tip-bot for Adrian Hunter
merge bot[tip:perf/core] perf tools: Add Intel PT support for using CYC packets
perf tools: Add Intel PT support for using CYC packets
Commit-ID: 0de802abd14abdf8cbbba28b421a1a00fa0939d5 Gitweb: http://git.kernel.org/tip/0de802abd14abdf8cbbba28b421a1a00fa0939d5 Author: Adrian Hunter <[email protected]> AuthorDate: Fri, 17 Jul 2015 19:33:58 +0300 Committer: Arnaldo Carvalho de Melo <[email protected]> CommitDate: Mon, 24 Aug 2015 17:49:43 -0300
perf tools: Add Intel PT support for using CYC packets
CYC packets are a new Intel PT feature.
CYC packets provide even finer grain timestamp information than MTC and TSC packets. A CYC packet contains the number of CPU cycles since the last CYC packet. Unlike MTC and TSC packets, CYC packets are only sent when another packet is also sent.
Support for this feature is indicated by:
/sys/bus/event_source/devices/intel_pt/caps/psb_cyc
which contains "1" if the feature is supported and "0" otherwise.
CYC packets can be requested using a PMU config term e.g. perf record -e intel_pt/cyc/u sleep 1
The frequency of CYC packets can also be specified. e.g. perf record -e intel_pt/cyc,cyc_thresh=2/u sleep 1
CYC packets are not requested by default.
Valid cyc_thresh values are given by:
/sys/bus/event_source/devices/intel_pt/caps/cycle_thresholds
which contains a hexadecimal value, the bits of which represent valid values e.g. bit 2 set means value 2 is valid.
The value represents the minimum number of CPU cycles that must have passed before a CYC packet can be sent. The number of CPU cycles is:
2 ^ (value - 1)
e.g. value 4 means 8 CPU cycles must pass before a CYC packet can be sent. Note a CYC packet is still only sent when another packet is sent, not at, e.g. every 8 CPU cycles.
If an invalid value is entered, the error message will give a list of valid values e.g.
$ perf record -e intel_pt/cyc,cyc_thresh=15/u uname
Invalid cyc_thresh for intel_pt. Valid values are: 0-12tools/perf/Documentation/intel-pt.txt is updated in a later patch as there are a number of new features being added.
For more information refer to the June 2015 or later Intel 64 and IA-32 Architectures SDM Chapter 36 Intel Processor Trace.
--- tools/perf/arch/x86/util/intel-pt.c | 6 ++++++ 1 file changed, 6 insertions(+)
tools/perf/arch/x86/util/intel-pt.c +6 -0
@@ -475,6 +475,12 @@ static int intel_pt_validate_config(struct perf_pmu *intel_pt_pmu,if (!evsel)return 0 ; + err =intel_pt_val_config_term (intel_pt_pmu,"caps/cycle_thresholds" , +"cyc_thresh" ,"caps/psb_cyc" , + evsel->attr.config); +if (err) +return err; + err =intel_pt_val_config_term (intel_pt_pmu,"caps/mtc_periods" ,"mtc_period" ,"caps/mtc" , evsel->attr.config);
Adrian Hunter
reviewerPATCH v8 24/25 perf tools: Add Intel PT support for decoding TRACESTOP packets
In reply to Adrian HunterA TRACESTOP packet is produced when an Intel PT trace enters a defined region of the address space at which point the tracing stops.
This patch just adds decoder support.
Support for specifying TRACESTOP regions is left until later.
For details refer to the June 2015 or later Intel 64 and IA-32 Architectures SDM Chapter 36 Intel Processor Trace.
--- tools/perf/util/intel-pt-decoder/intel-pt-decoder.c | 11 +++++++++++ 1 file changed, 11 insertions(+)
tools/perf/util/intel-pt-decoder/intel-pt-decoder.c +11 -0
@@ -1572,6 +1572,10 @@ next:return intel_pt_walk_fup_tip (decoder);case INTEL_PT_TRACESTOP : + decoder->pge = false; + decoder->continuous_period = false; +intel_pt_clear_tx_flags (decoder); + decoder->have_tma = false;break ;case INTEL_PT_PSB :
@@ -1717,6 +1721,9 @@ static int intel_pt_walk_psb(struct intel_pt_decoder *decoder)break ;case INTEL_PT_TRACESTOP : + decoder->pge = false; + decoder->continuous_period = false; +intel_pt_clear_tx_flags (decoder);case INTEL_PT_TNT : decoder->have_tma = false;intel_pt_log ("ERROR: Unexpected packet\n" );
@@ -1819,6 +1826,10 @@ static int intel_pt_walk_to_ip(struct intel_pt_decoder *decoder)return intel_pt_bug (decoder);case INTEL_PT_TRACESTOP : + decoder->pge = false; + decoder->continuous_period = false; +intel_pt_clear_tx_flags (decoder); + decoder->have_tma = false;break ;case INTEL_PT_PSB :
Signature · 1 line
1.9.1
tip-bot for Adrian Hunter
merge bot[tip:perf/core] perf tools: Add Intel PT support for decoding TRACESTOP packets
perf tools: Add Intel PT support for decoding TRACESTOP packets
Commit-ID: 7eacca3ebb03a4ee7bb41284aafeb19a54242621 Gitweb: http://git.kernel.org/tip/7eacca3ebb03a4ee7bb41284aafeb19a54242621 Author: Adrian Hunter <[email protected]> AuthorDate: Fri, 17 Jul 2015 19:33:59 +0300 Committer: Arnaldo Carvalho de Melo <[email protected]> CommitDate: Mon, 24 Aug 2015 17:50:23 -0300
perf tools: Add Intel PT support for decoding TRACESTOP packets
A TRACESTOP packet is produced when an Intel PT trace enters a defined region of the address space at which point the tracing stops.
This patch just adds decoder support.
Support for specifying TRACESTOP regions is left until later.
For details refer to the June 2015 or later Intel 64 and IA-32 Architectures SDM Chapter 36 Intel Processor Trace.
--- tools/perf/util/intel-pt-decoder/intel-pt-decoder.c | 11 +++++++++++ 1 file changed, 11 insertions(+)
tools/perf/util/intel-pt-decoder/intel-pt-decoder.c +11 -0
@@ -1572,6 +1572,10 @@ next:return intel_pt_walk_fup_tip (decoder);case INTEL_PT_TRACESTOP : + decoder->pge = false; + decoder->continuous_period = false; +intel_pt_clear_tx_flags (decoder); + decoder->have_tma = false;break ;case INTEL_PT_PSB :
@@ -1717,6 +1721,9 @@ static int intel_pt_walk_psb(struct intel_pt_decoder *decoder)break ;case INTEL_PT_TRACESTOP : + decoder->pge = false; + decoder->continuous_period = false; +intel_pt_clear_tx_flags (decoder);case INTEL_PT_TNT : decoder->have_tma = false;intel_pt_log ("ERROR: Unexpected packet\n" );
@@ -1819,6 +1826,10 @@ static int intel_pt_walk_to_ip(struct intel_pt_decoder *decoder)return intel_pt_bug (decoder);case INTEL_PT_TRACESTOP : + decoder->pge = false; + decoder->continuous_period = false; +intel_pt_clear_tx_flags (decoder); + decoder->have_tma = false;break ;case INTEL_PT_PSB :
Adrian Hunter
reviewerPATCH v8 25/25 perf tools: Update Intel PT documentation
In reply to Adrian HunterUpdate Intel PT documentation to describe new
features.
--- tools/perf/Documentation/intel-pt.txt | 194 ++++++++++++++++++++++++++++++++-- 1 file changed, 186 insertions(+), 8 deletions(-)
tools/perf/Documentation/intel-pt.txt +186 -8
@@ -142,19 +142,21 @@ which is the same as -e intel_pt/tsc=1,noretcomp=0/ +Note there are now new config terms - see section 'config terms' further below. + The config terms are listed in /sys/devices/intel_pt/format. They are bit fields within the config member of the struct perf_event_attr which is passed to the kernel by the perf_event_open system call. They correspond to bit fields in the IA32_RTIT_CTL MSR. Here is a list of them and their definitions: - $ for f in `ls /sys/devices/intel_pt/format`;do - > echo $f - > cat /sys/devices/intel_pt/format/$f - > done - noretcomp - config:11 - tsc - config:10 + $ grep -H . /sys/bus/event_source/devices/intel_pt/format/* + /sys/bus/event_source/devices/intel_pt/format/cyc:config:1 + /sys/bus/event_source/devices/intel_pt/format/cyc_thresh:config:19-22 + /sys/bus/event_source/devices/intel_pt/format/mtc:config:9 + /sys/bus/event_source/devices/intel_pt/format/mtc_period:config:14-17 + /sys/bus/event_source/devices/intel_pt/format/noretcomp:config:11 + /sys/bus/event_source/devices/intel_pt/format/psb_period:config:24-27 + /sys/bus/event_source/devices/intel_pt/format/tsc:config:10 Note that the default config must be overridden for each term i.e.
@@ -209,9 +211,185 @@ perf_event_attr is displayed if the -vv option is used e.g. ------------------------------------------------------------ +config terms +------------ + +The June 2015 version of Intel 64 and IA-32 Architectures Software Developer +Manuals, Chapter 36 Intel Processor Trace, defined new Intel PT features. +Some of the features are reflect in new config terms. All the config terms are +described below. + +tsc Always supported. Produces TSC timestamp packets to provide + timing information. In some cases it is possible to decode + without timing information, for example a per-thread context + that does not overlap executable memory maps. + + The default config selects tsc (i.e. tsc=1). + +noretcomp Always supported. Disables "return compression" so a TIP packet + is produced when a function returns. Causes more packets to be + produced but might make decoding more reliable. + + The default config does not select noretcomp (i.e. noretcomp=0). + +psb_period Allows the frequency of PSB packets to be specified. + + The PSB packet is a synchronization packet that provides a + starting point for decoding or recovery from errors. + + Support for psb_period is indicated by: + + /sys/bus/event_source/devices/intel_pt/caps/psb_cyc + + which contains "1" if the feature is supported and "0" + otherwise. + + Valid values are given by: + + /sys/bus/event_source/devices/intel_pt/caps/psb_periods + + which contains a hexadecimal value, the bits of which represent + valid values e.g. bit 2 set means value 2 is valid. + + The psb_period value is converted to the approximate number of + trace bytes between PSB packets as: + + 2 ^ (value + 11) + + e.g. value 3 means 16KiB bytes between PSBs + + If an invalid value is entered, the error message + will give a list of valid values e.g. + + $ perf record -e intel_pt/psb_period=15/u uname + Invalid psb_period for intel_pt. Valid values are: 0-5 + + If MTC packets are selected, the default config selects a value + of 3 (i.e. psb_period=3) or the nearest lower value that is + supported (0 is always supported). Otherwise the default is 0. + + If decoding is expected to be reliable and the buffer is large + then a large PSB period can be used. + + Because a TSC packet is produced with PSB, the PSB period can + also affect the granularity to timing information in the absence + of MTC or CYC. + +mtc Produces MTC timing packets. + + MTC packets provide finer grain timestamp information than TSC + packets. MTC packets record time using the hardware crystal + clock (CTC) which is related to TSC packets using a TMA packet. + + Support for this feature is indicated by: + + /sys/bus/event_source/devices/intel_pt/caps/mtc + + which contains "1" if the feature is supported and + "0" otherwise. + + The frequency of MTC packets can also be specified - see + mtc_period below. + +mtc_period Specifies how frequently MTC packets are produced - see mtc + above for how to determine if MTC packets are supported. + + Valid values are given by: + + /sys/bus/event_source/devices/intel_pt/caps/mtc_periods + + which contains a hexadecimal value, the bits of which represent + valid values e.g. bit 2 set means value 2 is valid. + + The mtc_period value is converted to the MTC frequency as: + + CTC-frequency / (2 ^ value) + + e.g. value 3 means one eighth of CTC-frequency + + Where CTC is the hardware crystal clock, the frequency of which + can be related to TSC via values provided in cpuid leaf 0x15. + + If an invalid value is entered, the error message + will give a list of valid values e.g. + + $ perf record -e intel_pt/mtc_period=15/u uname + Invalid mtc_period for intel_pt. Valid values are: 0,3,6,9 + + The default value is 3 or the nearest lower value + that is supported (0 is always supported). + +cyc Produces CYC timing packets. + + CYC packets provide even finer grain timestamp information than + MTC and TSC packets. A CYC packet contains the number of CPU + cycles since the last CYC packet. Unlike MTC and TSC packets, + CYC packets are only sent when another packet is also sent. + + Support for this feature is indicated by: + + /sys/bus/event_source/devices/intel_pt/caps/psb_cyc + + which contains "1" if the feature is supported and + "0" otherwise. + + The number of CYC packets produced can be reduced by specifying + a threshold - see cyc_thresh below. + +cyc_thresh Specifies how frequently CYC packets are produced - see cyc + above for how to determine if CYC packets are supported. + + Valid cyc_thresh values are given by: + + /sys/bus/event_source/devices/intel_pt/caps/cycle_thresholds + + which contains a hexadecimal value, the bits of which represent + valid values e.g. bit 2 set means value 2 is valid. + + The cyc_thresh value represents the minimum number of CPU cycles + that must have passed before a CYC packet can be sent. The + number of CPU cycles is: + + 2 ^ (value - 1) + + e.g. value 4 means 8 CPU cycles must pass before a CYC packet + can be sent. Note a CYC packet is still only sent when another + packet is sent, not at, e.g. every 8 CPU cycles. + + If an invalid value is entered, the error message + will give a list of valid values e.g. + + $ perf record -e intel_pt/cyc,cyc_thresh=15/u uname + Invalid cyc_thresh for intel_pt. Valid values are: 0-12 + + CYC packets are not requested by default. + +no_force_psb This is a driver option and is not in the IA32_RTIT_CTL MSR. + + It stops the driver resetting the byte count to zero whenever + enabling the trace (for example on context switches) which in + turn results in no PSB being forced. However some processors + will produce a PSB anyway. + + In any case, there is still a PSB when the trace is enabled for + the first time. + + no_force_psb can be used to slightly decrease the trace size but + may make it harder for the decoder to recover from errors. + + no_force_psb is not selected by default. + + new snapshot option ------------------- +The difference between full trace and snapshot from the kernel's perspective is +that in full trace we don't overwrite trace data that the user hasn't collected +yet (and indicated that by advancing aux_tail), whereas in snapshot mode we let +the trace run and overwrite older data in the buffer so that whenever something +interesting happens, we can stop it and grab a snapshot of what was going on +around that interesting moment. + To select snapshot mode a new option has been added: -S
Signature · 1 line
1.9.1
tip-bot for Adrian Hunter
merge bot[tip:perf/core] perf tools: Update Intel PT documentation
perf tools: Update Intel PT documentation
Commit-ID: 9d1bf02ac3d41367896b38793db6f8f30bb9a295 Gitweb: http://git.kernel.org/tip/9d1bf02ac3d41367896b38793db6f8f30bb9a295 Author: Adrian Hunter <[email protected]> AuthorDate: Fri, 17 Jul 2015 19:34:00 +0300 Committer: Arnaldo Carvalho de Melo <[email protected]> CommitDate: Mon, 24 Aug 2015 17:51:09 -0300
perf tools: Update Intel PT documentation
Update Intel PT documentation to describe new features.
--- tools/perf/Documentation/intel-pt.txt | 194 ++++++++++++++++++++++++++++++++-- 1 file changed, 186 insertions(+), 8 deletions(-)
tools/perf/Documentation/intel-pt.txt +186 -8
@@ -142,19 +142,21 @@ which is the same as -e intel_pt/tsc=1,noretcomp=0/ +Note there are now new config terms - see section 'config terms' further below. + The config terms are listed in /sys/devices/intel_pt/format. They are bit fields within the config member of the struct perf_event_attr which is passed to the kernel by the perf_event_open system call. They correspond to bit fields in the IA32_RTIT_CTL MSR. Here is a list of them and their definitions: - $ for f in `ls /sys/devices/intel_pt/format`;do - > echo $f - > cat /sys/devices/intel_pt/format/$f - > done - noretcomp - config:11 - tsc - config:10 + $ grep -H . /sys/bus/event_source/devices/intel_pt/format/* + /sys/bus/event_source/devices/intel_pt/format/cyc:config:1 + /sys/bus/event_source/devices/intel_pt/format/cyc_thresh:config:19-22 + /sys/bus/event_source/devices/intel_pt/format/mtc:config:9 + /sys/bus/event_source/devices/intel_pt/format/mtc_period:config:14-17 + /sys/bus/event_source/devices/intel_pt/format/noretcomp:config:11 + /sys/bus/event_source/devices/intel_pt/format/psb_period:config:24-27 + /sys/bus/event_source/devices/intel_pt/format/tsc:config:10 Note that the default config must be overridden for each term i.e.
@@ -209,9 +211,185 @@ perf_event_attr is displayed if the -vv option is used e.g. ------------------------------------------------------------ +config terms +------------ + +The June 2015 version of Intel 64 and IA-32 Architectures Software Developer +Manuals, Chapter 36 Intel Processor Trace, defined new Intel PT features. +Some of the features are reflect in new config terms. All the config terms are +described below. + +tsc Always supported. Produces TSC timestamp packets to provide + timing information. In some cases it is possible to decode + without timing information, for example a per-thread context + that does not overlap executable memory maps. + + The default config selects tsc (i.e. tsc=1). + +noretcomp Always supported. Disables "return compression" so a TIP packet + is produced when a function returns. Causes more packets to be + produced but might make decoding more reliable. + + The default config does not select noretcomp (i.e. noretcomp=0). + +psb_period Allows the frequency of PSB packets to be specified. + + The PSB packet is a synchronization packet that provides a + starting point for decoding or recovery from errors. + + Support for psb_period is indicated by: + + /sys/bus/event_source/devices/intel_pt/caps/psb_cyc + + which contains "1" if the feature is supported and "0" + otherwise. + + Valid values are given by: + + /sys/bus/event_source/devices/intel_pt/caps/psb_periods + + which contains a hexadecimal value, the bits of which represent + valid values e.g. bit 2 set means value 2 is valid. + + The psb_period value is converted to the approximate number of + trace bytes between PSB packets as: + + 2 ^ (value + 11) + + e.g. value 3 means 16KiB bytes between PSBs + + If an invalid value is entered, the error message + will give a list of valid values e.g. + + $ perf record -e intel_pt/psb_period=15/u uname + Invalid psb_period for intel_pt. Valid values are: 0-5 + + If MTC packets are selected, the default config selects a value + of 3 (i.e. psb_period=3) or the nearest lower value that is + supported (0 is always supported). Otherwise the default is 0. + + If decoding is expected to be reliable and the buffer is large + then a large PSB period can be used. + + Because a TSC packet is produced with PSB, the PSB period can + also affect the granularity to timing information in the absence + of MTC or CYC. + +mtc Produces MTC timing packets. + + MTC packets provide finer grain timestamp information than TSC + packets. MTC packets record time using the hardware crystal + clock (CTC) which is related to TSC packets using a TMA packet. + + Support for this feature is indicated by: + + /sys/bus/event_source/devices/intel_pt/caps/mtc + + which contains "1" if the feature is supported and + "0" otherwise. + + The frequency of MTC packets can also be specified - see + mtc_period below. + +mtc_period Specifies how frequently MTC packets are produced - see mtc + above for how to determine if MTC packets are supported. + + Valid values are given by: + + /sys/bus/event_source/devices/intel_pt/caps/mtc_periods + + which contains a hexadecimal value, the bits of which represent + valid values e.g. bit 2 set means value 2 is valid. + + The mtc_period value is converted to the MTC frequency as: + + CTC-frequency / (2 ^ value) + + e.g. value 3 means one eighth of CTC-frequency + + Where CTC is the hardware crystal clock, the frequency of which + can be related to TSC via values provided in cpuid leaf 0x15. + + If an invalid value is entered, the error message + will give a list of valid values e.g. + + $ perf record -e intel_pt/mtc_period=15/u uname + Invalid mtc_period for intel_pt. Valid values are: 0,3,6,9 + + The default value is 3 or the nearest lower value + that is supported (0 is always supported). + +cyc Produces CYC timing packets. + + CYC packets provide even finer grain timestamp information than + MTC and TSC packets. A CYC packet contains the number of CPU + cycles since the last CYC packet. Unlike MTC and TSC packets, + CYC packets are only sent when another packet is also sent. + + Support for this feature is indicated by: + + /sys/bus/event_source/devices/intel_pt/caps/psb_cyc + + which contains "1" if the feature is supported and + "0" otherwise. + + The number of CYC packets produced can be reduced by specifying + a threshold - see cyc_thresh below. + +cyc_thresh Specifies how frequently CYC packets are produced - see cyc + above for how to determine if CYC packets are supported. + + Valid cyc_thresh values are given by: + + /sys/bus/event_source/devices/intel_pt/caps/cycle_thresholds + + which contains a hexadecimal value, the bits of which represent + valid values e.g. bit 2 set means value 2 is valid. + + The cyc_thresh value represents the minimum number of CPU cycles + that must have passed before a CYC packet can be sent. The + number of CPU cycles is: + + 2 ^ (value - 1) + + e.g. value 4 means 8 CPU cycles must pass before a CYC packet + can be sent. Note a CYC packet is still only sent when another + packet is sent, not at, e.g. every 8 CPU cycles. + + If an invalid value is entered, the error message + will give a list of valid values e.g. + + $ perf record -e intel_pt/cyc,cyc_thresh=15/u uname + Invalid cyc_thresh for intel_pt. Valid values are: 0-12 + + CYC packets are not requested by default. + +no_force_psb This is a driver option and is not in the IA32_RTIT_CTL MSR. + + It stops the driver resetting the byte count to zero whenever + enabling the trace (for example on context switches) which in + turn results in no PSB being forced. However some processors + will produce a PSB anyway. + + In any case, there is still a PSB when the trace is enabled for + the first time. + + no_force_psb can be used to slightly decrease the trace size but + may make it harder for the decoder to recover from errors. + + no_force_psb is not selected by default. + + new snapshot option ------------------- +The difference between full trace and snapshot from the kernel's perspective is +that in full trace we don't overwrite trace data that the user hasn't collected +yet (and indicated that by advancing aux_tail), whereas in snapshot mode we let +the trace run and overwrite older data in the buffer so that whenever something +interesting happens, we can stop it and grab a snapshot of what was going on +around that interesting moment. + To select snapshot mode a new option has been added: -S