perf/core improvements and fixes
Arnaldo Carvalho de Melo
maintainerHi Ingo,
Please consider pulling,
- Arnaldo
The following changes since commit c0b172e5b6770048751b2c0a4fe44346c2080c5d:
Merge tag 'perf-core-for-mingo-20160901' of git://git.kernel.org/pub/scm/linux/kernel/git/acme/linux into perf/core (2016-09-05 15:15:49 +0200)
are available in the git repository at:
git://git.kernel.org/pub/scm/linux/kernel/git/acme/linux.git tags/perf-core-for-mingo-20160908
for you to fetch changes up to 25b8592e912f085ce2ff736a2927584ddeab238c:
perf powerpc: Fix build-test failure (2016-09-08 13:44:07 -0300)
----------------------------------------------------------------
perf/core improvements and fixes:
User visible:
- Add branch stack / basic block info to 'perf annotate --stdio', where for each branch, we add an asm comment after the instruction with information on how often it was taken and predicted. See example with color output at:
http://vger.kernel.org/~acme/perf/annotate_basic_blocks.png
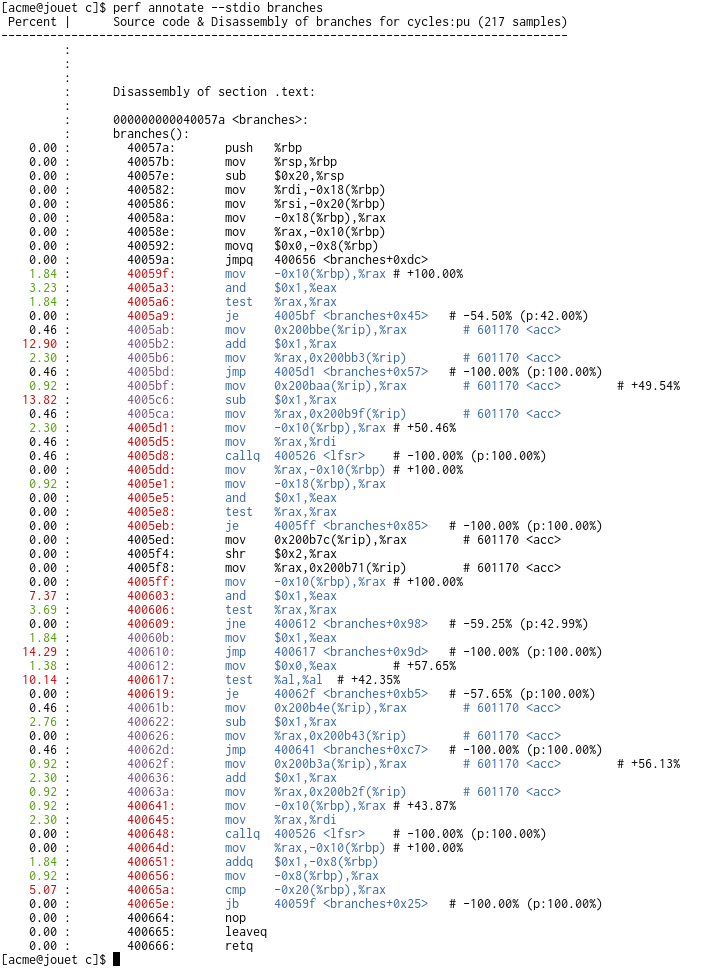
(Peter Zijlstra)
- Only open an evsel in CPUs in its cpu map, fixing some use cases in systems with multiple PMUs with different CPU maps (Mark Rutland)
- Fix handling of huge TLB maps, recognizing it as anonymous (Wang Nan)
Infrastructure:
- Remove the symbol filtering code, i.e. the callbacks passed to all functions that could end up loading a DSO symtab, simplifying the code, eventually allowing what we should have had since day one: removing the 'map' parameter from dso__load() functions (Arnaldo Carvalho de Melo)
Arch specific build fixes:
- Fix detached tarball build on powerpc, where we were still accessing a file outside tools/ (Ravi Bangoria)
----------------------------------------------------------------
Arnaldo Carvalho de Melo (5):
perf symbols: Mark if a symbol is idle in the library perf top: Remove old kernel-only symbol filter perf machine: Remove machine->symbol_filter and friends perf test vmlinux: Remove dead symbol_filter_t code perf symbols: Remove symbol_filter_t machinery
Mark Rutland (2):
perf evlist: Only open events on CPUs an evsel permits perf pmu: Support alternative sysfs cpumask
Peter Zijlstra (1):
perf annotate: Add branch stack / basic block
Ravi Bangoria (1):
perf powerpc: Fix build-test failure
Wang Nan (3):
perf tools: Recognize hugetlb mapping as anon mapping tools lib api fs: Add hugetlbfs filesystem detector perf record: Mark MAP_HUGETLB when synthesizing mmap events
 tools/lib/api/fs/fs.c                       |  15 ++
 tools/lib/api/fs/fs.h                       |   1 +
 tools/perf/arch/powerpc/util/sym-handling.c |   2 +-
 tools/perf/builtin-annotate.c               | 104 +++++++++
 tools/perf/builtin-inject.c                 |   2 +-
 tools/perf/builtin-kmem.c                   |  10 +-
 tools/perf/builtin-script.c                 |   4 +-
 tools/perf/builtin-top.c                    |  30 ---
 tools/perf/perf-sys.h                       |   1 -
 tools/perf/tests/code-reading.c             |   4 +-
 tools/perf/tests/vmlinux-kallsyms.c         |  17 +-
 tools/perf/ui/browsers/annotate.c           |   2 +-
 tools/perf/ui/browsers/map.c                |   4 +-
 tools/perf/util/Build                       |   1 +
 tools/perf/util/annotate.c                  |  95 +++++++-
 tools/perf/util/annotate.h                  |   1 +
 tools/perf/util/block-range.c               | 328 ++++++++++++++++++++++++++++
 tools/perf/util/block-range.h               |  71 ++++++
 tools/perf/util/event.c                     |  21 +-
 tools/perf/util/evlist.c                    |   8 +-
 tools/perf/util/intel-bts.c                 |   2 +-
 tools/perf/util/intel-pt.c                  |   4 +-
 tools/perf/util/machine.c                   |  38 +---
 tools/perf/util/machine.h                   |  34 +--
 tools/perf/util/map.c                       |  50 ++---
 tools/perf/util/map.h                       |  32 +--
 tools/perf/util/pmu.c                       |  15 +-
 tools/perf/util/probe-event.c               |  17 +-
 tools/perf/util/symbol-elf.c                |  32 +--
 tools/perf/util/symbol-minimal.c            |   4 +-
 tools/perf/util/symbol.c                    | 134 ++++++------
 tools/perf/util/symbol.h                    |  20 +-
 32 files changed, 817 insertions(+), 286 deletions(-)
 create mode 100644 tools/perf/util/block-range.c
 create mode 100644 tools/perf/util/block-range.h
Build stats:
[root@jouet ~]# time dm
1 69.078 alpine:3.4: Ok
2 24.055 android-ndk:r12b-arm: Ok
3 71.911 archlinux:latest: Ok
4 41.209 centos:5: Ok
5 58.240 centos:6: Ok
6 67.238 centos:7: Ok
7 62.040 debian:7: Ok
8 69.061 debian:8: Ok
9 38.124 debian:experimental: Ok
10 67.623 fedora:20: Ok
11 71.458 fedora:21: Ok
12 70.807 fedora:22: Ok
13 71.013 fedora:23: Ok
14 73.330 fedora:24: Ok
15 30.062 fedora:24-x-ARC-uClibc: Ok
16 77.616 fedora:rawhide: Ok
17 73.663 mageia:5: Ok
18 69.264 opensuse:13.2: Ok
19 71.532 opensuse:42.1: Ok
20 76.282 opensuse:tumbleweed: Ok
21 54.666 ubuntu:12.04.5: Ok
22 37.170 ubuntu:14.04: Ok
23 66.101 ubuntu:14.04.4: Ok
24 68.881 ubuntu:15.10: Ok
25 62.698 ubuntu:16.04: Ok
26 53.046 ubuntu:16.04-x-arm: Ok
27 51.609 ubuntu:16.04-x-arm64: Ok
28 51.842 ubuntu:16.04-x-powerpc64: Ok
29 53.347 ubuntu:16.04-x-powerpc64el: Ok
30 72.280 ubuntu:16.10: Ok
31 54.078 ubuntu:16.10-x-s390: Ok
real 31m19.919s
user 0m1.890s
sys 0m2.201s
[root@jouet ~]#
Arnaldo Carvalho de Melo
maintainerPATCH 1/12 perf symbols: Mark if a symbol is idle in the library
From: Arnaldo Carvalho de Melo <[email protected]>
This was being done just in 'perf top', but grouping idle symbols should be useful in other places as well, so remove one more symbol_filter_t user by moving this to the symbol library.
---
 tools/perf/builtin-top.c     |  3 ---
 tools/perf/util/symbol-elf.c |  2 +-
 tools/perf/util/symbol.c     | 32 +++++++++++++++++++++++---------
 tools/perf/util/symbol.h     |  2 +-
 4 files changed, 25 insertions(+), 14 deletions(-)
tools/perf/builtin-top.c +0 -3
@@ -679,9 +679,6 @@ static int symbol_filter(struct map *map, struct symbol *sym) strstr(name, "_text_end"))return 1 ; -if (symbol__is_idle (sym)) - sym->idle =1 ; -return 0 ; }
tools/perf/util/symbol-elf.c +1 -1
@@ -1127,7 +1127,7 @@ new_symbol:if (filter &&filter (curr_map, f))symbol__delete (f);else { -symbols__insert (&curr_dso->symbols[curr_map->type], f); +__symbols__insert (&curr_dso->symbols[curr_map->type], f, dso->kernel); nr++; } }
tools/perf/util/symbol.c +23 -9
@@ -28,6 +28,8 @@ static int dso__load_kernel_sym(struct dso *dso, struct map *map, symbol_filter_t filter);static int dso__load_guest_kernel_sym (struct dso *dso,struct map *map,symbol_filter_t filter); +static bool symbol__is_idle (const char *name); +int vmlinux_path__nr_entries;char **vmlinux_path;
@@ -277,13 +279,24 @@ void symbols__delete(struct rb_root *symbols) } } -void symbols__insert (struct rb_root *symbols,struct symbol *sym) +void __symbols__insert (struct rb_root *symbols,struct symbol *sym,bool kernel) {struct rb_node **p = &symbols->rb_node;struct rb_node *parent =NULL ;const u64 ip = sym->start;struct symbol *s; +if (kernel) { +const char *name = sym->name; +/* +* ppc64 uses function descriptors and appends a '.' to the +* start of every instruction address. Remove it. +*/ +if (name[0 ] =='.' ) + name++; + sym->idle =symbol__is_idle (name); + } +while (*p !=NULL ) { parent = *p; s = rb_entry(parent, struct symbol, rb_node);
@@ -296,6 +309,11 @@ void symbols__insert(struct rb_root *symbols, struct symbol *sym)rb_insert_color (&sym->rb_node, symbols); } +void symbols__insert (struct rb_root *symbols,struct symbol *sym) +{ +__symbols__insert (symbols, sym, false); +} +static struct symbol *symbols__find (struct rb_root *symbols,u64 ip) {struct rb_node *n;
@@ -424,7 +442,7 @@ void dso__reset_find_symbol_cache(struct dso *dso)void dso__insert_symbol (struct dso *dso,enum map_type type,struct symbol *sym) { -symbols__insert (&dso->symbols[type], sym); +__symbols__insert (&dso->symbols[type], sym, dso->kernel);/* update the symbol cache if necessary */ if (dso->last_find_result[type].addr >= sym->start &&
@@ -546,7 +564,7 @@ struct process_kallsyms_args {* These are symbols in the kernel image, so make sure that * sym is from a kernel DSO. */ -bool symbol__is_idle (struct symbol *sym) +static bool symbol__is_idle (const char *name) {const char *const idle_symbols[] = {"cpu_idle" ,
@@ -563,14 +581,10 @@ bool symbol__is_idle(struct symbol *sym)"pseries_dedicated_idle_sleep" , NULL }; -int i; -if (!sym) -return false; -for (i =0 ; idle_symbols[i]; i++) { -if (!strcmp (idle_symbols[i], sym->name)) +if (!strcmp (idle_symbols[i], name))return true; }
@@ -599,7 +613,7 @@ static int map__process_kallsym_symbol(void *arg, const char *name,* We will pass the symbols to the filter later, in * map__split_kallsyms, when we have split the maps per module */ -symbols__insert (root, sym); +__symbols__insert (root, sym, !strchr (name,'[' ));return 0 ; }
tools/perf/util/symbol.h +1 -1
@@ -294,7 +294,6 @@ size_t symbol__fprintf(struct symbol *sym, FILE *fp);bool symbol_type__is_a (char symbol_type,enum map_type map_type);bool symbol__restricted_filename (const char *filename,const char *restricted_filename); -bool symbol__is_idle (struct symbol *sym);int symbol__config_symfs (const struct option *opt__maybe_unused ,const char *dir,int unset__maybe_unused );
@@ -304,6 +303,7 @@ int dso__load_sym(struct dso *dso, struct map *map, struct symsrc *syms_ss,int dso__synthesize_plt_symbols (struct dso *dso,struct symsrc *ss,struct map *map,symbol_filter_t filter); +void __symbols__insert (struct rb_root *symbols,struct symbol *sym,bool kernel);void symbols__insert (struct rb_root *symbols,struct symbol *sym);void symbols__fixup_duplicate (struct rb_root *symbols);void symbols__fixup_end (struct rb_root *symbols);
Signature · 1 line
2.7.4
Arnaldo Carvalho de Melo
maintainerPATCH 2/12 perf top: Remove old kernel-only symbol filter
In reply to Arnaldo Carvalho de MeloFrom: Arnaldo Carvalho de Melo <[email protected]>
Not needed, we already have code to prune aliases.
---
 tools/perf/builtin-top.c | 27 ---------------------------
 1 file changed, 27 deletions(-)
tools/perf/builtin-top.c +0 -27
@@ -657,31 +657,6 @@ repeat:return NULL ; } -static int symbol_filter (struct map *map,struct symbol *sym) -{ -const char *name = sym->name; - -if (!__map__is_kernel (map)) -return 0 ; -/* -* ppc64 uses function descriptors and appends a '.' to the -* start of every instruction address. Remove it. -*/ -if (name[0 ] =='.' ) - name++; - -if (!strcmp (name,"_text" ) || - !strcmp (name,"_etext" ) || - !strcmp (name,"_sinittext" ) || - !strncmp ("init_module" , name,11 ) || - !strncmp ("cleanup_module" , name,14 ) || -strstr (name,"_text_start" ) || -strstr (name,"_text_end" )) -return 1 ; - -return 0 ; -} -static int hist_iter__top_callback (struct hist_entry_iter *iter,struct addr_location *al,bool single,void *arg)
@@ -946,8 +921,6 @@ static int __cmd_top(struct perf_top *top)if (top->session ==NULL )return -1 ; -machines__set_symbol_filter (&top->session->machines, symbol_filter); -if (!objdump_path) { ret =perf_env__lookup_objdump (&top->session->header.env);if (ret)
Signature · 1 line
2.7.4
Arnaldo Carvalho de Melo
maintainerPATCH 3/12 perf machine: Remove machine->symbol_filter and friends
In reply to Arnaldo Carvalho de MeloFrom: Arnaldo Carvalho de Melo <[email protected]>
Including machines__set_symbol_filter(), not used anymore.
---
 tools/perf/util/event.c     |  8 +++-----
 tools/perf/util/intel-bts.c |  2 +-
 tools/perf/util/intel-pt.c  |  4 ++--
 tools/perf/util/machine.c   | 21 +--------------------
 tools/perf/util/machine.h   |  4 ----
 5 files changed, 7 insertions(+), 32 deletions(-)
tools/perf/util/event.c +3 -5
@@ -1286,7 +1286,7 @@ try_again:* must be done prior to using kernel maps. */ if (load_map) -map__load (al->map, machine->symbol_filter); +map__load (al->map,NULL ); al->addr = al->map->map_ip (al->map, al->addr); } }
@@ -1297,8 +1297,7 @@ void thread__find_addr_location(struct thread *thread, {thread__find_addr_map (thread, cpumode, type, addr, al);if (al->map !=NULL ) - al->sym =map__find_symbol (al->map, al->addr, - thread->mg->machine->symbol_filter); + al->sym =map__find_symbol (al->map, al->addr,NULL );else al->sym =NULL ; }
@@ -1359,8 +1358,7 @@ int machine__resolve(struct machine *machine, struct addr_location *al, al->filtered |= (1 <<HIST_FILTER__DSO ); } - al->sym =map__find_symbol (al->map, al->addr, - machine->symbol_filter); + al->sym =map__find_symbol (al->map, al->addr,NULL ); } if (symbol_conf.sym_list &&
tools/perf/util/intel-bts.c +1 -1
@@ -346,7 +346,7 @@ static int intel_bts_get_next_insn(struct intel_bts_queue *btsq, u64 ip) goto out_put;/* Load maps to ensure dso->is_64_bit has been updated */ -map__load (al.map, machine->symbol_filter); +map__load (al.map,NULL ); x86_64 = al.map->dso->is_64_bit;
tools/perf/util/intel-pt.c +2 -2
@@ -477,7 +477,7 @@ static int intel_pt_walk_next_insn(struct intel_pt_insn *intel_pt_insn, start_ip = *ip;/* Load maps to ensure dso->is_64_bit has been updated */ -map__load (al.map, machine->symbol_filter); +map__load (al.map,NULL ); x86_64 = al.map->dso->is_64_bit;
@@ -1294,7 +1294,7 @@ static u64 intel_pt_switch_ip(struct intel_pt *pt, u64 *ptss_ip)if (!map)return 0 ; -if (map__load (map, machine->symbol_filter)) +if (map__load (map,NULL ))return 0 ; start =dso__first_symbol (map->dso,MAP__FUNCTION );
tools/perf/util/machine.c +1 -20
@@ -41,7 +41,6 @@ int machine__init(struct machine *machine, const char *root_dir, pid_t pid) machine->pid = pid; - machine->symbol_filter =NULL ; machine->id_hdr_size =0 ; machine->kptr_restrict_warned = false; machine->comm_exec = false;
@@ -148,7 +147,6 @@ void machines__init(struct machines *machines) {machine__init (&machines->host,"" ,HOST_KERNEL_ID ); machines->guests =RB_ROOT ; - machines->symbol_filter =NULL ; }void machines__exit (struct machines *machines)
@@ -172,8 +170,6 @@ struct machine *machines__add(struct machines *machines, pid_t pid,return NULL ; } - machine->symbol_filter = machines->symbol_filter; -while (*p !=NULL ) { parent = *p; pos = rb_entry(parent, struct machine, rb_node);
@@ -189,21 +185,6 @@ struct machine *machines__add(struct machines *machines, pid_t pid,return machine; } -void machines__set_symbol_filter (struct machines *machines, -symbol_filter_t symbol_filter) -{ -struct rb_node *nd; - - machines->symbol_filter = symbol_filter; - machines->host.symbol_filter = symbol_filter; - -for (nd =rb_first (&machines->guests); nd; nd =rb_next (nd)) { - struct machine *machine = rb_entry(nd, struct machine, rb_node); - - machine->symbol_filter = symbol_filter; - } -} -void machines__set_comm_exec (struct machines *machines,bool comm_exec) {struct rb_node *nd;
@@ -2115,7 +2096,7 @@ int machine__get_kernel_start(struct machine *machine)*/ machine->kernel_start =1ULL <<63 ;if (map) { - err =map__load (map, machine->symbol_filter); + err =map__load (map,NULL );if (map->start) machine->kernel_start = map->start; }
tools/perf/util/machine.h +0 -4
@@ -41,7 +41,6 @@ struct machine {struct map_groups kmaps;struct map *vmlinux_maps[MAP__NR_TYPES ];u64 kernel_start; -symbol_filter_t symbol_filter;pid_t *current_tid;union {/* Tool specific area */ void *priv;
@@ -110,7 +109,6 @@ typedef void (*machine__process_t)(struct machine *machine, void *data);struct machines {struct machine host;struct rb_root guests; -symbol_filter_t symbol_filter; };void machines__init (struct machines *machines);
@@ -128,8 +126,6 @@ struct machine *machines__findnew(struct machines *machines, pid_t pid);void machines__set_id_hdr_size (struct machines *machines,u16 id_hdr_size);char *machine__mmap_name (struct machine *machine,char *bf,size_t size); -void machines__set_symbol_filter (struct machines *machines, -symbol_filter_t symbol_filter);void machines__set_comm_exec (struct machines *machines,bool comm_exec);struct machine *machine__new_host (void );
Signature · 1 line
2.7.4
Arnaldo Carvalho de Melo
maintainerPATCH 4/12 perf test vmlinux: Remove dead symbol_filter_t code
In reply to Arnaldo Carvalho de MeloFrom: Arnaldo Carvalho de Melo <[email protected]>
We don't need to initialize that area as we're not using it afterwards, leftover, ditch it.
---
 tools/perf/tests/vmlinux-kallsyms.c | 11 +----------
 1 file changed, 1 insertion(+), 10 deletions(-)
tools/perf/tests/vmlinux-kallsyms.c +1 -10
@@ -8,14 +8,6 @@#include "debug.h" #include "machine.h" -static int vmlinux_matches_kallsyms_filter (struct map *map__maybe_unused , -struct symbol *sym) -{ -bool *visited =symbol__priv (sym); - *visited = true; -return 0 ; -} -#define UM (x) kallsyms_map->unmap_ip(kallsyms_map, (x))int test__vmlinux_matches_kallsyms (int subtest__maybe_unused )
@@ -100,8 +92,7 @@ int test__vmlinux_matches_kallsyms(int subtest __maybe_unused)* maps__reloc_vmlinux will notice and set proper ->[un]map_ip routines * to fixup the symbols. */ -if (machine__load_vmlinux_path (&vmlinux, type, - vmlinux_matches_kallsyms_filter) <=0 ) { +if (machine__load_vmlinux_path (&vmlinux, type,NULL ) <=0 ) {pr_debug ("Couldn't find a vmlinux that matches the kernel running on this machine, skipping test\n" ); err =TEST_SKIP ; goto out;
Signature · 1 line
2.7.4
Arnaldo Carvalho de Melo
maintainerPATCH 5/12 perf symbols: Remove symbol_filter_t machinery
In reply to Arnaldo Carvalho de MeloFrom: Arnaldo Carvalho de Melo <[email protected]>
We're not using it anymore, few users were, but we really could do without it, simplify lots of functions by removing it.
---
 tools/perf/arch/powerpc/util/sym-handling.c |   2 +-
 tools/perf/builtin-inject.c                 |   2 +-
 tools/perf/builtin-kmem.c                   |  10 ++-
 tools/perf/builtin-script.c                 |   4 +-
 tools/perf/tests/code-reading.c             |   4 +-
 tools/perf/tests/vmlinux-kallsyms.c         |   8 +--
 tools/perf/ui/browsers/annotate.c           |   2 +-
 tools/perf/ui/browsers/map.c                |   4 +-
 tools/perf/util/annotate.c                  |   2 +-
 tools/perf/util/event.c                     |   8 +--
 tools/perf/util/intel-bts.c                 |   2 +-
 tools/perf/util/intel-pt.c                  |   4 +-
 tools/perf/util/machine.c                   |  19 +++---
 tools/perf/util/machine.h                   |  30 +++-----
 tools/perf/util/map.c                       |  37 ++++------
 tools/perf/util/map.h                       |  32 ++++-----
 tools/perf/util/probe-event.c               |  17 +++--
 tools/perf/util/symbol-elf.c                |  32 +++------
 tools/perf/util/symbol-minimal.c            |   4 +-
 tools/perf/util/symbol.c                    | 102 ++++++++++++----------------
 tools/perf/util/symbol.h                    |  18 ++---
 21 files changed, 141 insertions(+), 202 deletions(-)
tools/perf/arch/powerpc/util/sym-handling.c +1 -1
@@ -108,7 +108,7 @@ void arch__post_process_probe_trace_events(struct perf_probe_event *pev,int i =0 ; map =get_target_map (pev->target, pev->uprobes); -if (!map ||map__load (map,NULL ) <0 ) +if (!map ||map__load (map) <0 )return ;for (i =0 ; i < ntevs; i++) {
tools/perf/builtin-inject.c +1 -1
@@ -429,7 +429,7 @@ static int perf_event__inject_buildid(struct perf_tool *tool,if (al.map !=NULL ) {if (!al.map->dso->hit) { al.map->dso->hit =1 ; -if (map__load (al.map,NULL ) >=0 ) { +if (map__load (al.map) >=0 ) {dso__inject_build_id (al.map->dso, tool, machine);/* * If this fails, too bad, let the other side
tools/perf/builtin-kmem.c +4 -6
@@ -330,7 +330,7 @@ static int build_alloc_func_list(void) } kernel_map =machine__kernel_map (machine); -if (map__load (kernel_map,NULL ) <0 ) { +if (map__load (kernel_map) <0 ) {pr_err ("cannot load kernel map\n" );return -ENOENT ; }
@@ -979,7 +979,7 @@ static void __print_slab_result(struct rb_root *root,if (is_caller) { addr = data->call_site;if (!raw_ip) - sym =machine__find_kernel_function (machine, addr, &map,NULL ); + sym =machine__find_kernel_function (machine, addr, &map); }else addr = data->ptr;
@@ -1043,8 +1043,7 @@ static void __print_page_alloc_result(struct perf_session *session, int n_lines)char *caller = buf; data = rb_entry(next, struct page_stat, node); - sym =machine__find_kernel_function (machine, data->callsite, - &map,NULL ); + sym =machine__find_kernel_function (machine, data->callsite, &map);if (sym && sym->name) caller = sym->name;else
@@ -1086,8 +1085,7 @@ static void __print_page_caller_result(struct perf_session *session, int n_lineschar *caller = buf; data = rb_entry(next, struct page_stat, node); - sym =machine__find_kernel_function (machine, data->callsite, - &map,NULL ); + sym =machine__find_kernel_function (machine, data->callsite, &map);if (sym && sym->name) caller = sym->name;else
tools/perf/builtin-script.c +2 -2
@@ -522,11 +522,11 @@ static void print_sample_brstacksym(struct perf_sample *sample,thread__find_addr_map (thread, sample->cpumode,MAP__FUNCTION , from, &alf);if (alf.map) - alf.sym =map__find_symbol (alf.map, alf.addr,NULL ); + alf.sym =map__find_symbol (alf.map, alf.addr);thread__find_addr_map (thread, sample->cpumode,MAP__FUNCTION , to, &alt);if (alt.map) - alt.sym =map__find_symbol (alt.map, alt.addr,NULL ); + alt.sym =map__find_symbol (alt.map, alt.addr);symbol__fprintf_symname_offs (alf.sym, &alf, stdout);putchar ('/' );
tools/perf/tests/code-reading.c +2 -2
@@ -263,7 +263,7 @@ static int read_object_code(u64 addr, size_t len, u8 cpumode,* Converting addresses for use by objdump requires more information. * map__load() does that. See map__rip_2objdump() for details. */ -if (map__load (al.map,NULL )) +if (map__load (al.map))return -1 ;/* objdump struggles with kcore - try each map only once */
@@ -511,7 +511,7 @@ static int do_test_code_reading(bool try_kcore)/* Load kernel map */ map =machine__kernel_map (machine); - ret =map__load (map,NULL ); + ret =map__load (map);if (ret <0 ) {pr_debug ("map__load failed\n" ); goto out_err;
tools/perf/tests/vmlinux-kallsyms.c +4 -4
@@ -54,7 +54,7 @@ int test__vmlinux_matches_kallsyms(int subtest __maybe_unused)* be compacted against the list of modules found in the "vmlinux" * code and with the one got from /proc/modules from the "kallsyms" code. */ -if (__machine__load_kallsyms (&kallsyms,"/proc/kallsyms" , type, true,NULL ) <=0 ) { +if (__machine__load_kallsyms (&kallsyms,"/proc/kallsyms" , type, true) <=0 ) {pr_debug ("dso__load_kallsyms " ); goto out; }
@@ -92,7 +92,7 @@ int test__vmlinux_matches_kallsyms(int subtest __maybe_unused)* maps__reloc_vmlinux will notice and set proper ->[un]map_ip routines * to fixup the symbols. */ -if (machine__load_vmlinux_path (&vmlinux, type,NULL ) <=0 ) { +if (machine__load_vmlinux_path (&vmlinux, type) <=0 ) {pr_debug ("Couldn't find a vmlinux that matches the kernel running on this machine, skipping test\n" ); err =TEST_SKIP ; goto out;
@@ -118,7 +118,7 @@ int test__vmlinux_matches_kallsyms(int subtest __maybe_unused) mem_end = vmlinux_map->unmap_ip (vmlinux_map, sym->end); first_pair =machine__find_kernel_symbol (&kallsyms, type, - mem_start,NULL ,NULL ); + mem_start,NULL ); pair = first_pair;if (pair &&UM (pair->start) == mem_start) {
@@ -147,7 +147,7 @@ next_pair:*/ continue ; }else { - pair =machine__find_kernel_symbol_by_name (&kallsyms, type, sym->name,NULL ,NULL ); + pair =machine__find_kernel_symbol_by_name (&kallsyms, type, sym->name,NULL );if (pair) {if (UM (pair->start) == mem_start) goto next_pair;
tools/perf/ui/browsers/annotate.c +1 -1
@@ -495,7 +495,7 @@ static bool annotate_browser__callq(struct annotate_browser *browser,if (!ins__is_call (dl->ins))return false; -if (map_groups__find_ams (&target,NULL ) || +if (map_groups__find_ams (&target) ||map__rip_2objdump (target.map, target.map->map_ip (target.map, target.addr)) != dl->ops.target.addr) {
tools/perf/ui/browsers/map.c +2 -2
@@ -52,9 +52,9 @@ static int map_browser__search(struct map_browser *browser)if (target[0 ] =='0' &&tolower (target[1 ]) =='x' ) {u64 addr =strtoull (target,NULL ,16 ); - sym =map__find_symbol (browser->map, addr,NULL ); + sym =map__find_symbol (browser->map, addr); }else - sym =map__find_symbol_by_name (browser->map, target,NULL ); + sym =map__find_symbol_by_name (browser->map, target);if (sym !=NULL ) {u32 *idx =symbol__browser_index (sym);
tools/perf/util/annotate.c +1 -1
@@ -1077,7 +1077,7 @@ static int symbol__parse_objdump_line(struct symbol *sym, struct map *map, .addr = dl->ops.target.addr, }; -if (!map_groups__find_ams (&target,NULL ) && +if (!map_groups__find_ams (&target) && target.sym->start == target.al_addr) dl->ops.target.name =strdup (target.sym->name); }
tools/perf/util/event.c +4 -4
@@ -1286,7 +1286,7 @@ try_again:* must be done prior to using kernel maps. */ if (load_map) -map__load (al->map,NULL ); +map__load (al->map); al->addr = al->map->map_ip (al->map, al->addr); } }
@@ -1297,7 +1297,7 @@ void thread__find_addr_location(struct thread *thread, {thread__find_addr_map (thread, cpumode, type, addr, al);if (al->map !=NULL ) - al->sym =map__find_symbol (al->map, al->addr,NULL ); + al->sym =map__find_symbol (al->map, al->addr);else al->sym =NULL ; }
@@ -1358,7 +1358,7 @@ int machine__resolve(struct machine *machine, struct addr_location *al, al->filtered |= (1 <<HIST_FILTER__DSO ); } - al->sym =map__find_symbol (al->map, al->addr,NULL ); + al->sym =map__find_symbol (al->map, al->addr); } if (symbol_conf.sym_list &&
@@ -1414,5 +1414,5 @@ void thread__resolve(struct thread *thread, struct addr_location *al, al->sym =NULL ;if (al->map) - al->sym =map__find_symbol (al->map, al->addr,NULL ); + al->sym =map__find_symbol (al->map, al->addr); }
tools/perf/util/intel-bts.c +1 -1
@@ -346,7 +346,7 @@ static int intel_bts_get_next_insn(struct intel_bts_queue *btsq, u64 ip) goto out_put;/* Load maps to ensure dso->is_64_bit has been updated */ -map__load (al.map,NULL ); +map__load (al.map); x86_64 = al.map->dso->is_64_bit;
tools/perf/util/intel-pt.c +2 -2
@@ -477,7 +477,7 @@ static int intel_pt_walk_next_insn(struct intel_pt_insn *intel_pt_insn, start_ip = *ip;/* Load maps to ensure dso->is_64_bit has been updated */ -map__load (al.map,NULL ); +map__load (al.map); x86_64 = al.map->dso->is_64_bit;
@@ -1294,7 +1294,7 @@ static u64 intel_pt_switch_ip(struct intel_pt *pt, u64 *ptss_ip)if (!map)return 0 ; -if (map__load (map,NULL )) +if (map__load (map))return 0 ; start =dso__first_symbol (map->dso,MAP__FUNCTION );
tools/perf/util/machine.c +9 -10
@@ -897,10 +897,10 @@ int machines__create_kernel_maps(struct machines *machines, pid_t pid) }int __machine__load_kallsyms (struct machine *machine,const char *filename, -enum map_type type,bool no_kcore,symbol_filter_t filter) +enum map_type type,bool no_kcore) {struct map *map =machine__kernel_map (machine); -int ret =__dso__load_kallsyms (map->dso, filename, map, no_kcore, filter); +int ret =__dso__load_kallsyms (map->dso, filename, map, no_kcore);if (ret >0 ) {dso__set_loaded (map->dso, type);
@@ -916,16 +916,15 @@ int __machine__load_kallsyms(struct machine *machine, const char *filename, }int machine__load_kallsyms (struct machine *machine,const char *filename, -enum map_type type,symbol_filter_t filter) +enum map_type type) { -return __machine__load_kallsyms (machine, filename, type, false, filter); +return __machine__load_kallsyms (machine, filename, type, false); } -int machine__load_vmlinux_path (struct machine *machine,enum map_type type, -symbol_filter_t filter) +int machine__load_vmlinux_path (struct machine *machine,enum map_type type) {struct map *map =machine__kernel_map (machine); -int ret =dso__load_vmlinux_path (map->dso, map, filter); +int ret =dso__load_vmlinux_path (map->dso, map);if (ret >0 )dso__set_loaded (map->dso, type);
@@ -1294,7 +1293,7 @@ static int machine__process_kernel_mmap_event(struct machine *machine,/* * preload dso of guest kernel and modules */ -dso__load (kernel,machine__kernel_map (machine),NULL ); +dso__load (kernel,machine__kernel_map (machine)); } }return 0 ;
@@ -2096,7 +2095,7 @@ int machine__get_kernel_start(struct machine *machine)*/ machine->kernel_start =1ULL <<63 ;if (map) { - err =map__load (map,NULL ); + err =map__load (map);if (map->start) machine->kernel_start = map->start; }
@@ -2112,7 +2111,7 @@ char *machine__resolve_kernel_addr(void *vmachine, unsigned long long *addrp, ch {struct machine *machine = vmachine;struct map *map; -struct symbol *sym =map_groups__find_symbol (&machine->kmaps,MAP__FUNCTION , *addrp, &map,NULL ); +struct symbol *sym =map_groups__find_symbol (&machine->kmaps,MAP__FUNCTION , *addrp, &map);if (sym ==NULL )return NULL ;
tools/perf/util/machine.h +11 -19
@@ -174,40 +174,33 @@ size_t machine__fprintf(struct machine *machine, FILE *fp);static inline struct symbol *machine__find_kernel_symbol (struct machine *machine,enum map_type type,u64 addr, -struct map **mapp, -symbol_filter_t filter) +struct map **mapp) { -return map_groups__find_symbol (&machine->kmaps, type, addr, - mapp, filter); +return map_groups__find_symbol (&machine->kmaps, type, addr, mapp); }static inline struct symbol *machine__find_kernel_symbol_by_name (struct machine *machine,enum map_type type,const char *name, -struct map **mapp, -symbol_filter_t filter) +struct map **mapp) { -return map_groups__find_symbol_by_name (&machine->kmaps, type, name, - mapp, filter); +return map_groups__find_symbol_by_name (&machine->kmaps, type, name, mapp); }static inline struct symbol *machine__find_kernel_function (struct machine *machine,u64 addr, -struct map **mapp, -symbol_filter_t filter) +struct map **mapp) {return machine__find_kernel_symbol (machine,MAP__FUNCTION , addr, - mapp, filter); + mapp); }static inline struct symbol *machine__find_kernel_function_by_name (struct machine *machine,const char *name, -struct map **mapp, -symbol_filter_t filter) +struct map **mapp) { -return map_groups__find_function_by_name (&machine->kmaps, name, mapp, - filter); +return map_groups__find_function_by_name (&machine->kmaps, name, mapp); } struct map *machine__findnew_module_map(struct machine *machine, u64 start,
@@ -215,11 +208,10 @@ struct map *machine__findnew_module_map(struct machine *machine, u64 start,int arch__fix_module_text_start (u64 *start,const char *name);int __machine__load_kallsyms (struct machine *machine,const char *filename, -enum map_type type,bool no_kcore,symbol_filter_t filter); +enum map_type type,bool no_kcore);int machine__load_kallsyms (struct machine *machine,const char *filename, -enum map_type type,symbol_filter_t filter); -int machine__load_vmlinux_path (struct machine *machine,enum map_type type, -symbol_filter_t filter); +enum map_type type); +int machine__load_vmlinux_path (struct machine *machine,enum map_type type);size_t machine__fprintf_dsos_buildid (struct machine *machine,FILE *fp,bool (skip )(struct dso *dso,int parm),int parm);
tools/perf/util/map.c +15 -22
@@ -279,7 +279,7 @@ void map__fixup_end(struct map *map)#define DSO__DELETED "(deleted)" -int map__load (struct map *map,symbol_filter_t filter) +int map__load (struct map *map) {const char *name = map->dso->long_name;int nr;
@@ -287,7 +287,7 @@ int map__load(struct map *map, symbol_filter_t filter)if (dso__loaded (map->dso, map->type))return 0 ; - nr =dso__load (map->dso, map, filter); + nr =dso__load (map->dso, map);if (nr <0 ) {if (map->dso->has_build_id) {char sbuild_id[SBUILD_ID_SIZE ];
@@ -312,9 +312,6 @@ int map__load(struct map *map, symbol_filter_t filter)pr_warning ("%.*s was updated (is prelink enabled?). " "Restart the long running apps that use it!\n" , (int )real_len, name); - }else if (filter) { -pr_warning ("no symbols passed the given filter.\n" ); -return -2 ;/* Empty but maybe by the filter */ }else {pr_warning ("no symbols found in %s, maybe install " "a debug package?\n" , name);
@@ -331,19 +328,17 @@ int __weak arch__compare_symbol_names(const char *namea, const char *nameb)return strcmp (namea, nameb); } -struct symbol *map__find_symbol (struct map *map,u64 addr, -symbol_filter_t filter) +struct symbol *map__find_symbol (struct map *map,u64 addr) { -if (map__load (map, filter) <0 ) +if (map__load (map) <0 )return NULL ;return dso__find_symbol (map->dso, map->type, addr); } -struct symbol *map__find_symbol_by_name (struct map *map,const char *name, -symbol_filter_t filter) +struct symbol *map__find_symbol_by_name (struct map *map,const char *name) { -if (map__load (map, filter) <0 ) +if (map__load (map) <0 )return NULL ;if (!dso__sorted_by_name (map->dso, map->type))
@@ -556,23 +551,22 @@ void map_groups__put(struct map_groups *mg)struct symbol *map_groups__find_symbol (struct map_groups *mg,enum map_type type,u64 addr, -struct map **mapp, -symbol_filter_t filter) +struct map **mapp) {struct map *map =map_groups__find (mg, type, addr);/* Ensure map is loaded before using map->map_ip */ -if (map !=NULL &&map__load (map, filter) >=0 ) { +if (map !=NULL &&map__load (map) >=0 ) {if (mapp !=NULL ) *mapp = map; -return map__find_symbol (map, map->map_ip (map, addr), filter); +return map__find_symbol (map, map->map_ip (map, addr)); }return NULL ; }struct symbol *maps__find_symbol_by_name (struct maps *maps,const char *name, -struct map **mapp,symbol_filter_t filter) +struct map **mapp) {struct symbol *sym;struct rb_node *nd;
@@ -582,7 +576,7 @@ struct symbol *maps__find_symbol_by_name(struct maps *maps, const char *name,for (nd =rb_first (&maps->entries); nd; nd =rb_next (nd)) { struct map *pos = rb_entry(nd, struct map, rb_node); - sym =map__find_symbol_by_name (pos, name, filter); + sym =map__find_symbol_by_name (pos, name);if (sym ==NULL )continue ;
@@ -600,15 +594,14 @@ out:struct symbol *map_groups__find_symbol_by_name (struct map_groups *mg,enum map_type type,const char *name, -struct map **mapp, -symbol_filter_t filter) +struct map **mapp) { -struct symbol *sym =maps__find_symbol_by_name (&mg->maps[type], name, mapp, filter); +struct symbol *sym =maps__find_symbol_by_name (&mg->maps[type], name, mapp);return sym; } -int map_groups__find_ams (struct addr_map_symbol *ams,symbol_filter_t filter) +int map_groups__find_ams (struct addr_map_symbol *ams) {if (ams->addr < ams->map->start || ams->addr >= ams->map->end) {if (ams->map->groups ==NULL )
@@ -620,7 +613,7 @@ int map_groups__find_ams(struct addr_map_symbol *ams, symbol_filter_t filter) } ams->al_addr = ams->map->map_ip (ams->map, ams->addr); - ams->sym =map__find_symbol (ams->map, ams->al_addr, filter); + ams->sym =map__find_symbol (ams->map, ams->al_addr);return ams->sym ?0 :-1 ; }
tools/perf/util/map.h +12 -20
@@ -127,17 +127,14 @@ struct thread;* @map: the 'struct map *' in which symbols itereated * @sym_name: the symbol name * @pos: the 'struct symbol *' to use as a loop cursor -* @filter: to use when loading the DSO */ -#define __map__for_each_symbol_by_name (map, sym_name, pos, filter) \ - for (pos = map__find_symbol_by_name(map, sym_name, filter); \ +#define __map__for_each_symbol_by_name (map, sym_name, pos) \ + for (pos = map__find_symbol_by_name(map, sym_name); \ pos && arch__compare_symbol_names(pos->name, sym_name) == 0; \ pos = symbol__next_by_name(pos))#define map__for_each_symbol_by_name (map, sym_name, pos) \ - __map__for_each_symbol_by_name(map, sym_name, (pos), NULL) - -typedef int (*symbol_filter_t )(struct map *map,struct symbol *sym); + __map__for_each_symbol_by_name(map, sym_name, (pos))int arch__compare_symbol_names (const char *namea,const char *nameb); void map__init(struct map *map, enum map_type type,
@@ -173,11 +170,9 @@ size_t map__fprintf_dsoname(struct map *map, FILE *fp);int map__fprintf_srcline (struct map *map,u64 addr,const char *prefix,FILE *fp); -int map__load (struct map *map,symbol_filter_t filter); -struct symbol *map__find_symbol (struct map *map, -u64 addr,symbol_filter_t filter); -struct symbol *map__find_symbol_by_name (struct map *map,const char *name, -symbol_filter_t filter); +int map__load (struct map *map); +struct symbol *map__find_symbol (struct map *map,u64 addr); +struct symbol *map__find_symbol_by_name (struct map *map,const char *name);void map__fixup_start (struct map *map);void map__fixup_end (struct map *map);
@@ -191,7 +186,7 @@ struct map *maps__find(struct maps *maps, u64 addr);struct map *maps__first (struct maps *maps);struct map *map__next (struct map *map);struct symbol *maps__find_symbol_by_name (struct maps *maps,const char *name, -struct map **mapp,symbol_filter_t filter); +struct map **mapp);void map_groups__init (struct map_groups *mg,struct machine *machine);void map_groups__exit (struct map_groups *mg); int map_groups__clone(struct thread *thread,
@@ -231,25 +226,22 @@ static inline struct map *map_groups__next(struct map *map)struct symbol *map_groups__find_symbol (struct map_groups *mg,enum map_type type,u64 addr, -struct map **mapp, -symbol_filter_t filter); +struct map **mapp);struct symbol *map_groups__find_symbol_by_name (struct map_groups *mg,enum map_type type,const char *name, -struct map **mapp, -symbol_filter_t filter); +struct map **mapp);struct addr_map_symbol ; -int map_groups__find_ams (struct addr_map_symbol *ams,symbol_filter_t filter); +int map_groups__find_ams (struct addr_map_symbol *ams);static inline struct symbol *map_groups__find_function_by_name (struct map_groups *mg, -const char *name,struct map **mapp, -symbol_filter_t filter) +const char *name,struct map **mapp) { -return map_groups__find_symbol_by_name (mg,MAP__FUNCTION , name, mapp, filter); +return map_groups__find_symbol_by_name (mg,MAP__FUNCTION , name, mapp); } int map_groups__fixup_overlappings(struct map_groups *mg, struct map *map,
tools/perf/util/probe-event.c +8 -9
@@ -110,13 +110,12 @@ void exit_probe_symbol_maps(void)static struct symbol *__find_kernel_function_by_name (const char *name,struct map **mapp) { -return machine__find_kernel_function_by_name (host_machine, name, mapp, -NULL ); +return machine__find_kernel_function_by_name (host_machine, name, mapp); }static struct symbol *__find_kernel_function (u64 addr,struct map **mapp) { -return machine__find_kernel_function (host_machine, addr, mapp,NULL ); +return machine__find_kernel_function (host_machine, addr, mapp); }static struct ref_reloc_sym *kernel_get_ref_reloc_sym (void )
@@ -125,7 +124,7 @@ static struct ref_reloc_sym *kernel_get_ref_reloc_sym(void)struct kmap *kmap;struct map *map =machine__kernel_map (host_machine); -if (map__load (map,NULL ) <0 ) +if (map__load (map) <0 )return NULL ; kmap =map__kmap (map);
@@ -351,9 +350,9 @@ static int kernel_get_module_dso(const char *module, struct dso **pdso) vmlinux_name = symbol_conf.vmlinux_name; dso->load_errno =0 ;if (vmlinux_name) - ret =dso__load_vmlinux (dso, map, vmlinux_name, false,NULL ); + ret =dso__load_vmlinux (dso, map, vmlinux_name, false);else - ret =dso__load_vmlinux_path (dso, map,NULL ); + ret =dso__load_vmlinux_path (dso, map); found: *pdso = dso;return ret;
@@ -1999,7 +1998,7 @@ static int find_perf_probe_point_from_map(struct probe_trace_point *tp, map =dso__new_map (tp->module);if (!map) goto out; - sym =map__find_symbol (map, addr,NULL ); + sym =map__find_symbol (map, addr); }else {if (tp->symbol && !addr) { if (kernel_get_symbol_address_by_name(tp->symbol,
@@ -2704,7 +2703,7 @@ static int find_probe_functions(struct map *map, char *name,struct symbol *sym;struct rb_node *tmp; -if (map__load (map,NULL ) <0 ) +if (map__load (map) <0 )return 0 ;map__for_each_symbol (map, sym, tmp) {
@@ -3368,7 +3367,7 @@ int show_available_funcs(const char *target, struct strfilter *_filter,return -EINVAL ; } - ret =map__load (map,NULL ); + ret =map__load (map);if (ret) {if (ret ==-2 ) {char *str =strfilter__string (_filter);
tools/perf/util/symbol-elf.c +9 -23
@@ -254,8 +254,7 @@ static char *demangle_sym(struct dso *dso, int kmodule, const char *elf_name)* And always look at the original dso, not at debuginfo packages, that * have the PLT data stripped out (shdr_rel_plt.sh_type == SHT_NOBITS). */ -int dso__synthesize_plt_symbols (struct dso *dso,struct symsrc *ss,struct map *map, -symbol_filter_t filter) +int dso__synthesize_plt_symbols (struct dso *dso,struct symsrc *ss,struct map *map) {uint32_t nr_rel_entries, idx;GElf_Sym sym;
@@ -351,12 +350,8 @@ int dso__synthesize_plt_symbols(struct dso *dso, struct symsrc *ss, struct map *if (!f) goto out_elf_end; -if (filter &&filter (map, f)) -symbol__delete (f); -else { -symbols__insert (&dso->symbols[map->type], f); - ++nr; - } +symbols__insert (&dso->symbols[map->type], f); + ++nr; } }else if (shdr_rel_plt.sh_type ==SHT_REL ) {GElf_Rel pos_mem, *pos;
@@ -381,12 +376,8 @@ int dso__synthesize_plt_symbols(struct dso *dso, struct symsrc *ss, struct map *if (!f) goto out_elf_end; -if (filter &&filter (map, f)) -symbol__delete (f); -else { -symbols__insert (&dso->symbols[map->type], f); - ++nr; - } +symbols__insert (&dso->symbols[map->type], f); + ++nr; } }
@@ -825,9 +816,8 @@ static u64 ref_reloc(struct kmap *kmap)void __weak arch__sym_update (struct symbol *s__maybe_unused ,GElf_Sym *sym__maybe_unused ) { } -int dso__load_sym (struct dso *dso,struct map *map, -struct symsrc *syms_ss,struct symsrc *runtime_ss, -symbol_filter_t filter,int kmodule) +int dso__load_sym (struct dso *dso,struct map *map,struct symsrc *syms_ss, +struct symsrc *runtime_ss,int kmodule) {struct kmap *kmap = dso->kernel ?map__kmap (map) :NULL ;struct map_groups *kmaps = kmap ?map__kmaps (map) :NULL ;
@@ -1124,12 +1114,8 @@ new_symbol:arch__sym_update (f, &sym); -if (filter &&filter (curr_map, f)) -symbol__delete (f); -else { -__symbols__insert (&curr_dso->symbols[curr_map->type], f, dso->kernel); - nr++; - } +__symbols__insert (&curr_dso->symbols[curr_map->type], f, dso->kernel); + nr++; }/*
tools/perf/util/symbol-minimal.c +1 -3
@@ -287,8 +287,7 @@ void symsrc__destroy(struct symsrc *ss)int dso__synthesize_plt_symbols (struct dso *dso__maybe_unused ,struct symsrc *ss__maybe_unused , -struct map *map__maybe_unused , -symbol_filter_t filter__maybe_unused ) +struct map *map__maybe_unused ) {return 0 ; }
@@ -334,7 +333,6 @@ enum dso_type dso__type_fd(int fd)int dso__load_sym (struct dso *dso,struct map *map__maybe_unused ,struct symsrc *ss,struct symsrc *runtime_ss__maybe_unused , -symbol_filter_t filter__maybe_unused ,int kmodule__maybe_unused ) {unsigned char build_id[BUILD_ID_SIZE ];
tools/perf/util/symbol.c +44 -58
263 lines not on this page · raw message
tools/perf/util/symbol.h +7 -11
@@ -241,16 +241,13 @@ int symsrc__init(struct symsrc *ss, struct dso *dso, const char *name,bool symsrc__has_symtab (struct symsrc *ss);bool symsrc__possibly_runtime (struct symsrc *ss); -int dso__load (struct dso *dso,struct map *map,symbol_filter_t filter); +int dso__load (struct dso *dso,struct map *map);int dso__load_vmlinux (struct dso *dso,struct map *map, -const char *vmlinux,bool vmlinux_allocated, -symbol_filter_t filter); -int dso__load_vmlinux_path (struct dso *dso,struct map *map, -symbol_filter_t filter); +const char *vmlinux,bool vmlinux_allocated); +int dso__load_vmlinux_path (struct dso *dso,struct map *map);int __dso__load_kallsyms (struct dso *dso,const char *filename,struct map *map, -bool no_kcore,symbol_filter_t filter); -int dso__load_kallsyms (struct dso *dso,const char *filename,struct map *map, -symbol_filter_t filter); +bool no_kcore); +int dso__load_kallsyms (struct dso *dso,const char *filename,struct map *map);void dso__insert_symbol (struct dso *dso,enum map_type type,struct symbol *sym);
@@ -298,10 +295,9 @@ int symbol__config_symfs(const struct option *opt __maybe_unused, const char *dir, int unset __maybe_unused);int dso__load_sym (struct dso *dso,struct map *map,struct symsrc *syms_ss, -struct symsrc *runtime_ss,symbol_filter_t filter, -int kmodule); +struct symsrc *runtime_ss,int kmodule);int dso__synthesize_plt_symbols (struct dso *dso,struct symsrc *ss, -struct map *map,symbol_filter_t filter); +struct map *map);void __symbols__insert (struct rb_root *symbols,struct symbol *sym,bool kernel);void symbols__insert (struct rb_root *symbols,struct symbol *sym);
Signature · 1 line
2.7.4
Arnaldo Carvalho de Melo
maintainerPATCH 6/12 perf tools: Recognize hugetlb mapping as anon mapping
In reply to Arnaldo Carvalho de MeloFrom: Wang Nan <[email protected]>
Hugetlbfs mapping should be recognized as anon mapping so user has a chance to create /tmp/perf-<pid>.map file for symbol resolving. This patch utilizes MAP_HUGETLB to identify hugetlb mapping.
After this patch, if perf is started before a program starts using huge pages (so perf gets MMAP2 events from kernel), perf is able to recognize hugetlb mapping as anon mapping.
---
 tools/perf/util/map.c | 13 ++++++++++---
 1 file changed, 10 insertions(+), 3 deletions(-)
tools/perf/util/map.c +10 -3
@@ -6,6 +6,7 @@#include <string.h> #include <stdio.h> #include <unistd.h> +#include <sys/mman.h> #include "map.h" #include "thread.h" #include "strlist.h"
@@ -24,9 +25,15 @@ const char *map_type__name[MAP__NR_TYPES] = { [MAP__VARIABLE] = "Variables", }; -static inline int is_anon_memory (const char *filename) +static inline int is_anon_memory (const char *filename,u32 flags) { -return !strcmp (filename,"//anon" ) || +u32 anon_flags =0 ; + +#ifdef MAP_HUGETLB + anon_flags |=MAP_HUGETLB ; +#endif +return flags & anon_flags || + !strcmp (filename,"//anon" ) || !strncmp (filename,"/dev/zero" ,sizeof ("/dev/zero" ) -1 ) || !strncmp (filename,"/anon_hugepage" ,sizeof ("/anon_hugepage" ) -1 ); }
@@ -155,7 +162,7 @@ struct map *map__new(struct machine *machine, u64 start, u64 len,int anon, no_dso, vdso, android; android =is_android_lib (filename); - anon =is_anon_memory (filename); + anon =is_anon_memory (filename, flags); vdso =is_vdso_map (filename); no_dso =is_no_dso_memory (filename);
Signature · 1 line
2.7.4
Arnaldo Carvalho de Melo
maintainerPATCH 7/12 tools lib api fs: Add hugetlbfs filesystem detector
In reply to Arnaldo Carvalho de MeloFrom: Wang Nan <[email protected]>
Detect hugetlbfs. hugetlbfs__mountpoint() will be used during recording to help identifying hugetlb mmaps: which should be recognized as anon mapping.
---
 tools/lib/api/fs/fs.c | 15 +++++++++++++++
 tools/lib/api/fs/fs.h |  1 +
 2 files changed, 16 insertions(+)
tools/lib/api/fs/fs.c +15 -0
@@ -34,6 +34,10 @@#define TRACEFS_MAGIC 0x74726163#endif +#ifndef HUGETLBFS_MAGIC +#define HUGETLBFS_MAGIC 0x958458f6 +#endif +static const char *const sysfs__fs_known_mountpoints[] = {"/sys" ,0 ,
@@ -67,6 +71,10 @@ static const char * const tracefs__known_mountpoints[] = { 0, }; +static const char *const hugetlbfs__known_mountpoints[] = { +0 , +}; +struct fs {const char *name;const char *const *mounts;
@@ -80,6 +88,7 @@ enum {FS__PROCFS =1 ,FS__DEBUGFS =2 ,FS__TRACEFS =3 , + FS__HUGETLBFS = 4, };#ifndef TRACEFS_MAGIC
@@ -107,6 +116,11 @@ static struct fs fs__entries[] = { .mounts = tracefs__known_mountpoints, .magic = TRACEFS_MAGIC, }, + [FS__HUGETLBFS] = { + .name = "hugetlbfs", + .mounts = hugetlbfs__known_mountpoints, + .magic = HUGETLBFS_MAGIC, + }, };static bool fs__read_mounts (struct fs *fs)
@@ -265,6 +279,7 @@ FS(sysfs, FS__SYSFS);FS (procfs,FS__PROCFS );FS (debugfs,FS__DEBUGFS );FS (tracefs,FS__TRACEFS ); +FS (hugetlbfs,FS__HUGETLBFS );int filename__read_int (const char *filename,int *value) {
tools/lib/api/fs/fs.h +1 -0
@@ -21,6 +21,7 @@ FS(sysfs) FS(procfs) FS(debugfs) FS(tracefs) +FS(hugetlbfs)#undef FS
Signature · 1 line
2.7.4
Arnaldo Carvalho de Melo
maintainerPATCH 8/12 perf record: Mark MAP_HUGETLB when synthesizing mmap events
In reply to Arnaldo Carvalho de MeloFrom: Wang Nan <[email protected]>
When synthesizing mmap events, add MAP_HUGETLB map flag if the source of mapping is file in hugetlbfs.
After this patch, perf can identify hugetlb mapping even if perf is started after the mapping of huge pages (like with 'perf top').
---
 tools/perf/util/event.c | 11 +++++++++++
 1 file changed, 11 insertions(+)
tools/perf/util/event.c +11 -0
@@ -1,5 +1,6 @@#include <linux/types.h> #include <sys/mman.h> +#include <api/fs/fs.h> #include "event.h" #include "debug.h" #include "hist.h"
@@ -248,6 +249,10 @@ int perf_event__synthesize_mmap_events(struct perf_tool *tool,bool truncation = false;unsigned long long timeout = proc_map_timeout *1000000ULL ;int rc =0 ; +#ifdef MAP_HUGETLB +const char *hugetlbfs_mnt =hugetlbfs__mountpoint (); +int hugetlbfs_mnt_len = hugetlbfs_mnt ?strlen (hugetlbfs_mnt) :0 ; +#endif if (machine__is_default_guest (machine))return 0 ;
@@ -342,6 +347,12 @@ out:if (!strcmp (execname,"" ))strcpy (execname, anonstr); +#ifdef MAP_HUGETLB +if (!strncmp (execname, hugetlbfs_mnt, hugetlbfs_mnt_len)) { +strcpy (execname, anonstr); + event->mmap2.flags |=MAP_HUGETLB ; + } +#endif size =strlen (execname) +1 ;memcpy (event->mmap2.filename, execname, size);
Signature · 1 line
2.7.4
Arnaldo Carvalho de Melo
maintainerPATCH 9/12 perf annotate: Add branch stack / basic block
In reply to Arnaldo Carvalho de MeloFrom: Peter Zijlstra <[email protected]>
I wanted to know the hottest path through a function and figured the branch-stack (LBR) information should be able to help out with that.
The below uses the branch-stack to create basic blocks and generate statistics from them.
from to branch_i
* ----> *
|
| block
v
* ----> *
from to branch_i+1
The blocks are broken down into non-overlapping ranges, while tracking if the start of each range is an entry point and/or the end of a range is a branch.
Each block iterates all ranges it covers (while splitting where required to exactly match the block) and increments the 'coverage' count.
For the range including the branch we increment the taken counter, as well as the pred counter if flags.predicted.
Using these number we can find if an instruction:
- had coverage; given by:
br->coverage / br->sym->max_coverage
This metric ensures each symbol has a 100% spot, which reflects the observation that each symbol must have a most covered/hottest block.
- is a branch target: br->is_target && br->start == add
- for targets, how much of a branch's coverages comes from it:
target->entry / branch->coverage
- is a branch: br->is_branch && br->end == addr
- for branches, how often it was taken:
br->taken / br->coverage
after all, all execution that didn't take the branch would have incremented the coverage and continued onward to a later branch.
- for branches, how often it was predicted:
br->pred / br->taken
The coverage percentage is used to color the address and asm sections; for low (<1%) coverage we use NORMAL (uncolored), indicating that these instructions are not 'important'. For high coverage (>75%) we color the address RED.
For each branch, we add an asm comment after the instruction with information on how often it was taken and predicted.
Output looks like (sans color, which does loose a lot of the information :/)
$ perf record --branch-filter u,any -e cycles:p ./branches 27
$ perf annotate branches
Percent | Source code & Disassembly of branches for cycles:pu (217 samples)
---------------------------------------------------------------------------------
         :	branches():
    0.00 :	  40057a:       push   %rbp
    0.00 :	  40057b:       mov    %rsp,%rbp
    0.00 :	  40057e:       sub    $0x20,%rsp
    0.00 :	  400582:       mov    %rdi,-0x18(%rbp)
    0.00 :	  400586:       mov    %rsi,-0x20(%rbp)
    0.00 :	  40058a:       mov    -0x18(%rbp),%rax
    0.00 :	  40058e:       mov    %rax,-0x10(%rbp)
    0.00 :	  400592:       movq   $0x0,-0x8(%rbp)
    0.00 :	  40059a:       jmpq   400656 <branches+0xdc>
    1.84 :	  40059f:       mov    -0x10(%rbp),%rax	# +100.00%
    3.23 :	  4005a3:       and    $0x1,%eax
    1.84 :	  4005a6:       test   %rax,%rax
    0.00 :	  4005a9:       je     4005bf <branches+0x45>	# -54.50% (p:42.00%)
    0.46 :	  4005ab:       mov    0x200bbe(%rip),%rax        # 601170 <acc>
   12.90 :	  4005b2:       add    $0x1,%rax
    2.30 :	  4005b6:       mov    %rax,0x200bb3(%rip)        # 601170 <acc>
    0.46 :	  4005bd:       jmp    4005d1 <branches+0x57>	# -100.00% (p:100.00%)
    0.92 :	  4005bf:       mov    0x200baa(%rip),%rax        # 601170 <acc>	# +49.54%
   13.82 :	  4005c6:       sub    $0x1,%rax
    0.46 :	  4005ca:       mov    %rax,0x200b9f(%rip)        # 601170 <acc>
    2.30 :	  4005d1:       mov    -0x10(%rbp),%rax	# +50.46%
    0.46 :	  4005d5:       mov    %rax,%rdi
    0.46 :	  4005d8:       callq  400526 <lfsr>	# -100.00% (p:100.00%)
    0.00 :	  4005dd:       mov    %rax,-0x10(%rbp)	# +100.00%
    0.92 :	  4005e1:       mov    -0x18(%rbp),%rax
    0.00 :	  4005e5:       and    $0x1,%eax
    0.00 :	  4005e8:       test   %rax,%rax
    0.00 :	  4005eb:       je     4005ff <branches+0x85>	# -100.00% (p:100.00%)
    0.00 :	  4005ed:       mov    0x200b7c(%rip),%rax        # 601170 <acc>
    0.00 :	  4005f4:       shr    $0x2,%rax
    0.00 :	  4005f8:       mov    %rax,0x200b71(%rip)        # 601170 <acc>
    0.00 :	  4005ff:       mov    -0x10(%rbp),%rax	# +100.00%
    7.37 :	  400603:       and    $0x1,%eax
    3.69 :	  400606:       test   %rax,%rax
    0.00 :	  400609:       jne    400612 <branches+0x98>	# -59.25% (p:42.99%)
    1.84 :	  40060b:       mov    $0x1,%eax
   14.29 :	  400610:       jmp    400617 <branches+0x9d>	# -100.00% (p:100.00%)
    1.38 :	  400612:       mov    $0x0,%eax	# +57.65%
   10.14 :	  400617:       test   %al,%al	# +42.35%
    0.00 :	  400619:       je     40062f <branches+0xb5>	# -57.65% (p:100.00%)
    0.46 :	  40061b:       mov    0x200b4e(%rip),%rax        # 601170 <acc>
    2.76 :	  400622:       sub    $0x1,%rax
    0.00 :	  400626:       mov    %rax,0x200b43(%rip)        # 601170 <acc>
    0.46 :	  40062d:       jmp    400641 <branches+0xc7>	# -100.00% (p:100.00%)
    0.92 :	  40062f:       mov    0x200b3a(%rip),%rax        # 601170 <acc>	# +56.13%
    2.30 :	  400636:       add    $0x1,%rax
    0.92 :	  40063a:       mov    %rax,0x200b2f(%rip)        # 601170 <acc>
    0.92 :	  400641:       mov    -0x10(%rbp),%rax	# +43.87%
    2.30 :	  400645:       mov    %rax,%rdi
    0.00 :	  400648:       callq  400526 <lfsr>	# -100.00% (p:100.00%)
    0.00 :	  40064d:       mov    %rax,-0x10(%rbp)	# +100.00%
    1.84 :	  400651:       addq   $0x1,-0x8(%rbp)
    0.92 :	  400656:       mov    -0x8(%rbp),%rax
    5.07 :	  40065a:       cmp    -0x20(%rbp),%rax
    0.00 :	  40065e:       jb     40059f <branches+0x25>	# -100.00% (p:100.00%)
    0.00 :	  400664:       nop
    0.00 :	  400665:       leaveq
    0.00 :	  400666:       retq
(Note: the --branch-filter u,any was used to avoid spurious target and branch points due to interrupts/faults, they show up as very small -/+ annotations on 'weird' locations)
Committer note:
Please take a look at:
http://vger.kernel.org/~acme/perf/annotate_basic_blocks.png
To see the colors.
---
 tools/perf/builtin-annotate.c | 104 ++++++++++++++
 tools/perf/util/Build         |   1 +
 tools/perf/util/annotate.c    |  93 +++++++++++-
 tools/perf/util/annotate.h    |   1 +
 tools/perf/util/block-range.c | 328 ++++++++++++++++++++++++++++++++++++++++++
 tools/perf/util/block-range.h |  71 +++++++++
 6 files changed, 596 insertions(+), 2 deletions(-)
 create mode 100644 tools/perf/util/block-range.c
 create mode 100644 tools/perf/util/block-range.h
tools/perf/builtin-annotate.c +104 -0
@@ -30,6 +30,7 @@#include "util/tool.h" #include "util/data.h" #include "arch/common.h" +#include "util/block-range.h" #include <dlfcn.h> #include <linux/bitmap.h>
@@ -46,6 +47,103 @@ struct perf_annotate {DECLARE_BITMAP (cpu_bitmap,MAX_NR_CPUS ); }; +/* +* Given one basic block: +* +* from to branch_i +* * ----> * +* | +* | block +* v +* * ----> * +* from to branch_i+1 +* +* where the horizontal are the branches and the vertical is the executed +* block of instructions. +* +* We count, for each 'instruction', the number of blocks that covered it as +* well as count the ratio each branch is taken. +* +* We can do this without knowing the actual instruction stream by keeping +* track of the address ranges. We break down ranges such that there is no +* overlap and iterate from the start until the end. +* +* @acme: once we parse the objdump output _before_ processing the samples, +* we can easily fold the branch.cycles IPC bits in. +*/ +static void process_basic_block (struct addr_map_symbol *start, +struct addr_map_symbol *end, +struct branch_flags *flags) +{ +struct symbol *sym = start->sym; +struct annotation *notes = sym ?symbol__annotation (sym) :NULL ; +struct block_range_iter iter; +struct block_range *entry; + +/* +* Sanity; NULL isn't executable and the CPU cannot execute backwards +*/ +if (!start->addr || start->addr > end->addr) +return ; + + iter =block_range__create (start->addr, end->addr); +if (!block_range_iter__valid (&iter)) +return ; + +/* +* First block in range is a branch target. +*/ + entry =block_range_iter (&iter); +assert (entry->is_target); + entry->entry++; + +do { + entry =block_range_iter (&iter); + + entry->coverage++; + entry->sym = sym; + +if (notes) + notes->max_coverage =max (notes->max_coverage, entry->coverage); + + }while (block_range_iter__next (&iter)); + +/* +* Last block in rage is a branch. +*/ + entry =block_range_iter (&iter); +assert (entry->is_branch); + entry->taken++; +if (flags->predicted) + entry->pred++; +} + +static void process_branch_stack (struct branch_stack *bs,struct addr_location *al, +struct perf_sample *sample) +{ +struct addr_map_symbol *prev =NULL ; +struct branch_info *bi; +int i; + +if (!bs || !bs->nr) +return ; + + bi =sample__resolve_bstack (sample, al); +if (!bi) +return ; + +for (i = bs->nr -1 ; i >=0 ; i--) { +/* +* XXX filter against symbol +*/ +if (prev) +process_basic_block (prev, &bi[i].from, &bi[i].flags); + prev = &bi[i].to; + } + +free (bi); +} + static int perf_evsel__add_sample(struct perf_evsel *evsel, struct perf_sample *sample, struct addr_location *al,
@@ -72,6 +170,12 @@ static int perf_evsel__add_sample(struct perf_evsel *evsel,return 0 ; } +/* +* XXX filtered samples can still have branch entires pointing into our +* symbol and are missed. +*/ +process_branch_stack (sample->branch_stack, al, sample); + sample->period =1 ; sample->weight =1 ;
tools/perf/util/Build +1 -0
@@ -1,5 +1,6 @@ libperf-y += alias.o libperf-y += annotate.o +libperf-y += block-range.o libperf-y += build-id.o libperf-y += config.o libperf-y += ctype.o
tools/perf/util/annotate.c +91 -2
117 lines not on this page · raw message
tools/perf/util/annotate.h +1 -0
@@ -130,6 +130,7 @@ struct annotated_source {struct annotation {pthread_mutex_t lock; +u64 max_coverage;struct annotated_source *src; };
tools/perf/util/block-range.c new file +328 -0
328 lines not on this page · raw message
tools/perf/util/block-range.h new file +71 -0
71 lines not on this page · raw message
Signature · 1 line
2.7.4
Arnaldo Carvalho de Melo
maintainerPATCH 10/12 perf evlist: Only open events on CPUs an evsel permits
In reply to Arnaldo Carvalho de MeloFrom: Mark Rutland <[email protected]>
In systems with heterogeneous CPU PMUs, it's possible for each evsel to cover a distinct set of CPUs, and hence the cpu_map associated with each evsel may have a distinct idx<->id mapping. Any of these may be distinct from the evlist's cpu map.
Events can be tied to the same fd so long as they use the same per-cpu ringbuffer (i.e. so long as they are on the same CPU). To acquire the correct FDs, we must compare the Linux logical IDs rather than the evsel or evlist indices.
This path adds logic to perf_evlist__mmap_per_evsel to handle this, translating IDs as required. As PMUs may cover a subset of CPUs from the evlist, we skip the CPUs a PMU cannot handle.
Without this patch, perf record may try to mmap erroneous FDs on heterogeneous systems, and will bail out early rather than running the workload.
---
 tools/perf/util/evlist.c | 8 +++++++-
 1 file changed, 7 insertions(+), 1 deletion(-)
tools/perf/util/evlist.c +7 -1
@@ -1032,16 +1032,18 @@ perf_evlist__should_poll(struct perf_evlist *evlist __maybe_unused, }static int perf_evlist__mmap_per_evsel (struct perf_evlist *evlist,int idx, -struct mmap_params *mp,int cpu, +struct mmap_params *mp,int cpu_idx,int thread,int *_output,int *_output_backward) {struct perf_evsel *evsel;int revent; +int evlist_cpu =cpu_map__cpu (evlist->cpus, cpu_idx);evlist__for_each_entry (evlist, evsel) {struct perf_mmap *maps = evlist->mmap;int *output = _output;int fd; +int cpu;if (evsel->attr.write_backward) { output = _output_backward;
@@ -1060,6 +1062,10 @@ static int perf_evlist__mmap_per_evsel(struct perf_evlist *evlist, int idx,if (evsel->system_wide && thread)continue ; + cpu =cpu_map__idx (evsel->cpus, evlist_cpu); +if (cpu ==-1 ) +continue ; + fd =FD (evsel, cpu, thread);if (*output ==-1 ) {
Signature · 1 line
2.7.4
Arnaldo Carvalho de Melo
maintainerPATCH 11/12 perf pmu: Support alternative sysfs cpumask
In reply to Arnaldo Carvalho de MeloFrom: Mark Rutland <[email protected]>
The perf tools can read a cpumask file for a PMU, describing a subset of CPUs which that PMU covers. So far this has only been used to cater for uncore PMUs, which in practice happen to only have a single CPU described in the mask.
Until recently, the perf tools only correctly handled cpumask containing a single CPU, and only when monitoring in system-wide mode. For example, prior to commit 00e727bb389359c8 ("perf stat: Balance opening and reading events"), a mask with more than a single CPU could cause perf stat to hang. When a CPU PMU covers a subset of CPUs, but lacks a cpumask, perf record will fail to open events (on the cores the PMU does not support), and gives up.
For systems with heterogeneous CPUs such as ARM big.LITTLE systems, this presents a problem. We have a PMU for each microarchitecture (e.g. a big PMU and a little PMU), and would like to expose a cpumask for each (so as to allow perf record and other tools to do the right thing). However, doing so kernel-side will cause old perf binaries to not function (e.g. hitting the issue solved by 00e727bb389359c8), and thus commits the cardinal sin of breaking (existing) userspace.
To address this chicken-and-egg problem, this patch adds support got a new file, cpus, which is largely identical to the existing cpumask file. A kernel can expose this file, knowing that new perf binaries will correctly support it, while old perf binaries will not look for it (and thus will not be broken).
---
 tools/perf/util/pmu.c | 15 ++++++++++++---
 1 file changed, 12 insertions(+), 3 deletions(-)
tools/perf/util/pmu.c +12 -3
@@ -445,14 +445,23 @@ static struct cpu_map *pmu_cpumask(const char *name)FILE *file;struct cpu_map *cpus;const char *sysfs =sysfs__mountpoint (); +const char *templates[] = { +"%s/bus/event_source/devices/%s/cpumask" , +"%s/bus/event_source/devices/%s/cpus" , +NULL + }; +const char **template;if (!sysfs)return NULL ; -snprintf (path,PATH_MAX , -"%s/bus/event_source/devices/%s/cpumask" , sysfs, name); +for (template = templates; *template; template++) { +snprintf (path,PATH_MAX , *template, sysfs, name); +if (stat (path, &st) ==0 ) +break ; + } -if (stat (path, &st) <0 ) +if (!*template)return NULL ; file =fopen (path,"r" );
Signature · 1 line
2.7.4
Arnaldo Carvalho de Melo
maintainerPATCH 12/12 perf powerpc: Fix build-test failure
In reply to Arnaldo Carvalho de MeloFrom: Ravi Bangoria <[email protected]>
'make -C tools/perf build-test' is failing with below log for poewrpc.
In file included from /tmp/tmp.3eEwmGlYaF/perf-4.8.0-rc4/tools/perf/perf.h:15:0,
                   from util/cpumap.h:8,
from util/env.c:1: /tmp/tmp.3eEwmGlYaF/perf-4.8.0-rc4/tools/perf/perf-sys.h:23:56:
fatal error: ../../arch/powerpc/include/uapi/asm/unistd.h: No such file or directory compilation terminated.
I bisected it and found it's failing from commit ad430729ae00 ("Remove:
kernel unistd*h files from perf's MANIFEST, not used").
Header file '../../arch/powerpc/include/uapi/asm/unistd.h' is included only for powerpc in tools/perf/perf-sys.h.
By looking closly at commit history, I found little weird thing:
Commit f2d9cae9ea9e ("perf powerpc: Use uapi/unistd.h to fix build error") replaced 'asm/unistd.h' with 'uapi/asm/unistd.h'
Commit d2709c7ce4c5 ("perf: Make perf build for x86 with UAPI disintegration applied") removes all arch specific 'uapi/asm/unistd.h' for all archs and adds generic <asm/unistd.h>.
Commit f0b9abfb0446 ("Merge branch 'linus' into perf/core") again includes 'uapi/asm/unistd.h' for powerpc. Don't know how exactly this happened as this change is not part of commit also.
---
 tools/perf/perf-sys.h | 1 -
 1 file changed, 1 deletion(-)
tools/perf/perf-sys.h +0 -1
@@ -20,7 +20,6 @@#endif #ifdef __powerpc__ -#include "../../arch/powerpc/include/uapi/asm/unistd.h" #define CPUINFO_PROC {"cpu"}#endif
Signature · 1 line
2.7.4
Quoted 144 lines · Arnaldo Carvalho de Melo
Hi Ingo,
Please consider pulling,
- Arnaldo
The following changes since commit
c0b172e5b6770048751b2c0a4fe44346c2080c5d:Merge tag 'perf-core-for-mingo-20160901' of
git://git.kernel.org/pub/scm/linux/kernel/git/acme/linuxinto perf/core (2016-09-05 15:15:49 +0200)are available in the git repository at:
git://git.kernel.org/pub/scm/linux/kernel/git/acme/linux.gittags/perf-core-for-mingo-20160908for you to fetch changes up to
25b8592e912f085ce2ff736a2927584ddeab238c:perf powerpc: Fix build-test failure (2016-09-08 13:44:07 -0300)
----------------------------------------------------------------
perf/core improvements and fixes:User visible:
- Add branch stack / basic block info to 'perf annotate --stdio', where for each branch, we add an asm comment after the instruction with information on how often it was taken and predicted. See example with color output at:
http://vger.kernel.org/~acme/perf/annotate_basic_blocks.png
(Peter Zijlstra)
- Only open an evsel in CPUs in its cpu map, fixing some use cases in systems with multiple PMUs with different CPU maps (Mark Rutland)
- Fix handling of huge TLB maps, recognizing it as anonymous (Wang Nan)
Infrastructure:
- Remove the symbol filtering code, i.e. the callbacks passed to all functions that could end up loading a DSO symtab, simplifying the code, eventually allowing what we should have had since day one: removing the 'map' parameter from
dso__load()functions (Arnaldo Carvalho de Melo)Arch specific build fixes:
- Fix detached tarball build on powerpc, where we were still accessing a file outside
tools/(Ravi Bangoria)Signed-off-by Arnaldo Carvalho de Melo <[email protected]>----------------------------------------------------------------
Arnaldo Carvalho de Melo (5):
perf symbols: Mark if a symbol is idle in the library perf top: Remove old kernel-only symbol filter perf machine: Removemachine->symbol_filterand friends perf test vmlinux: Remove deadsymbol_filter_tcode perf symbols: Removesymbol_filter_tmachineryMark Rutland (2):
perf evlist: Only open events on CPUs an evsel permits perf pmu: Support alternative sysfs cpumaskPeter Zijlstra (1):
perf annotate: Add branch stack / basic blockRavi Bangoria (1):
perf powerpc: Fix build-test failureWang Nan (3):
perf tools: Recognize hugetlb mapping as anon mapping tools lib api fs: Add hugetlbfs filesystem detector perf record: MarkMAP_HUGETLBwhen synthesizing mmap eventstools/lib/api/fs/fs.c | 15 ++ tools/lib/api/fs/fs.h | 1 + tools/perf/arch/powerpc/util/sym-handling.c | 2 +- tools/perf/builtin-annotate.c | 104 +++++++++ tools/perf/builtin-inject.c | 2 +- tools/perf/builtin-kmem.c | 10 +- tools/perf/builtin-script.c | 4 +- tools/perf/builtin-top.c | 30 --- tools/perf/perf-sys.h | 1 - tools/perf/tests/code-reading.c | 4 +- tools/perf/tests/vmlinux-kallsyms.c | 17 +- tools/perf/ui/browsers/annotate.c | 2 +- tools/perf/ui/browsers/map.c | 4 +- tools/perf/util/Build | 1 + tools/perf/util/annotate.c | 95 +++++++- tools/perf/util/annotate.h | 1 + tools/perf/util/block-range.c | 328 ++++++++++++++++++++++++++++ tools/perf/util/block-range.h | 71 ++++++ tools/perf/util/event.c | 21 +- tools/perf/util/evlist.c | 8 +- tools/perf/util/intel-bts.c | 2 +- tools/perf/util/intel-pt.c | 4 +- tools/perf/util/machine.c | 38 +--- tools/perf/util/machine.h | 34 +-- tools/perf/util/map.c | 50 ++--- tools/perf/util/map.h | 32 +-- tools/perf/util/pmu.c | 15 +- tools/perf/util/probe-event.c | 17 +- tools/perf/util/symbol-elf.c | 32 +-- tools/perf/util/symbol-minimal.c | 4 +- tools/perf/util/symbol.c | 134 ++++++------ tools/perf/util/symbol.h | 20 +- 32 files changed, 817 insertions(+), 286 deletions(-) create mode 100644 tools/perf/util/block-range.c create mode 100644 tools/perf/util/block-range.hBuild stats:
[root@jouet ~]# time dm
1 69.078 alpine:3.4: Ok
2 24.055 android-ndk:r12b-arm: Ok
3 71.911 archlinux:latest: Ok
4 41.209 centos:5: Ok
5 58.240 centos:6: Ok
6 67.238 centos:7: Ok
7 62.040 debian:7: Ok
8 69.061 debian:8: Ok
9 38.124 debian:experimental: Ok
10 67.623 fedora:20: Ok
11 71.458 fedora:21: Ok
12 70.807 fedora:22: Ok
13 71.013 fedora:23: Ok
14 73.330 fedora:24: Ok
15 30.062 fedora:24-x-ARC-uClibc: Ok
16 77.616 fedora:rawhide: Ok
17 73.663 mageia:5: Ok
18 69.264 opensuse:13.2: Ok
19 71.532 opensuse:42.1: Ok
20 76.282 opensuse:tumbleweed: Ok
21 54.666 ubuntu:12.04.5: Ok
22 37.170 ubuntu:14.04: Ok
23 66.101 ubuntu:14.04.4: Ok
24 68.881 ubuntu:15.10: Ok
25 62.698 ubuntu:16.04: Ok
26 53.046 ubuntu:16.04-x-arm: Ok
27 51.609 ubuntu:16.04-x-arm64: Ok
28 51.842 ubuntu:16.04-x-powerpc64: Ok
29 53.347 ubuntu:16.04-x-powerpc64el: Ok
30 72.280 ubuntu:16.10: Ok
31 54.078 ubuntu:16.10-x-s390: Ok
Quoted 4 lines
real 31m19.919s
user 0m1.890s
sys 0m2.201s
[root@jouet ~]#
Pulled, thanks a lot Arnaldo!
Ingo