perf tui: Annotate entries in callchains
Arnaldo Carvalho de Melo
maintainerRFC PATCH 1/1 perf tui: Annotate entries in callchains
Hi Stephane,
This patch, together with what is in my perf/core branch, should
implement that feature we talked about recently, i.e. to allow annotating entries in callchains, please take a look at see if you think it is ok,
- Arnaldo
From: Arnaldo Carvalho de Melo <[email protected]>
Subject: [PATCH 1/1] perf hists browser: Indicate which callchain entries are annotated
Now that we can annotate entries in a callchain, show which ones have an associated symbol and samples, by adding a right arrow just before the symbol name when in verbose mode.
To toggle verbose mode press 'V'.
---
 tools/perf/ui/browsers/hists.c | 4 +++-
 1 file changed, 3 insertions(+), 1 deletion(-)
tools/perf/ui/browsers/hists.c +3 -1
@@ -511,6 +511,7 @@ static void hist_browser__show_callchain_entry(struct hist_browser *browser, {int color, width;char folded_sign =callchain_list__folded (chain); +bool show_annotated = browser->show_dso && chain->ms.sym &&symbol__annotation (chain->ms.sym)->src; color =HE_COLORSET_NORMAL ; width = browser->b.width - (offset +2 );
@@ -523,7 +524,8 @@ static void hist_browser__show_callchain_entry(struct hist_browser *browser,ui_browser__set_color (&browser->b, color);hist_browser__gotorc (browser, row,0 );slsmg_write_nstring (" " , offset); -slsmg_printf ("%c " , folded_sign); +slsmg_printf ("%c" , folded_sign); +ui_browser__write_graph (&browser->b, show_annotated ?SLSMG_RARROW_CHAR :' ' );slsmg_write_nstring (str, width); }
Signature · 1 line
1.9.3
Hi Arnaldo,
Quoted 8 lines · Arnaldo Carvalho de Melo
Hi Stephane,
This patch, together with what is in my perf/core branch, should
implement that feature we talked about recently, i.e. to allow annotating entries in callchains, please take a look at see if you think it is ok,
I tried on tip.git and a simple example. It does what I wanted. I will try on more complex test cases.
Thanks for implementing this quickly.
Quoted 54 lines
- Arnaldo
From: Arnaldo Carvalho de Melo <[email protected]>
Subject: [PATCH 1/1] perf hists browser: Indicate which callchain entries are annotatedNow that we can annotate entries in a callchain, show which ones have an associated symbol and samples, by adding a right arrow just before the symbol name when in verbose mode.
To toggle verbose mode press 'V'.
Cc Adrian Hunter <[email protected]>Cc Borislav Petkov <[email protected]>Cc David Ahern <[email protected]>Cc Don Zickus <[email protected]>Cc Frederic Weisbecker <[email protected]>Cc Jiri Olsa <[email protected]>Cc Mike Galbraith <[email protected]>Cc Namhyung Kim <[email protected]>Cc Peter Zijlstra <[email protected]>Cc Stephane Eranian <[email protected]>Signed-off-by Arnaldo Carvalho de Melo <[email protected]>--- tools/perf/ui/browsers/hists.c | 4 +++- 1 file changed, 3 insertions(+), 1 deletion(-)tools/perf/ui/browsers/hists.c +3
-2@@ -511,6 +511,7 @@ static void hist_browser__show_callchain_entry(struct hist_browser *browser, {int color, width;char folded_sign =callchain_list__folded (chain); +bool show_annotated = browser->show_dso && chain->ms.sym &&symbol__annotation (chain->ms.sym)->src; color =HE_COLORSET_NORMAL ; width = browser->b.width - (offset +2 );@@ -523,7 +524,8 @@ static void hist_browser__show_callchain_entry(struct hist_browser *browser,ui_browser__set_color (&browser->b, color);hist_browser__gotorc (browser, row,0 );slsmg_write_nstring (" " , offset); -slsmg_printf ("%c " , folded_sign); +slsmg_printf ("%c" , folded_sign); +ui_browser__write_graph (&browser->b, show_annotated ?SLSMG_RARROW_CHAR :' ' );slsmg_write_nstring (str, width); } --1.9.3
A message that is not in the archive (sent off-list or not yet received): CA+JHD93s2VkkdJMKZOGa6fPwEd43C8Ow80CU0b=bwTV=_8zjhw@mail.gmail.com
Hi,
Quoted 14 lines · Arnaldo Carvalho de Melo
Quoted 13 lines · Stephane Eranian
Hi Arnaldo,
Quoted 8 lines · Arnaldo Carvalho de Melo
Hi Stephane,
This patch, together with what is in my perf/core branch, should
implement that feature we talked about recently, i.e. to allow annotating entries in callchains, please take a look at see if you think it is ok,
Quoted 6 lines
Quoted 3 lines
I tried on tip.git and a simple example. It does what I wanted. I will try on more complex test cases.
Thanks for implementing this quickly.Thanks for testing, please let us know if you have further suggestions,
Ok, it does not work.
I think it works as long as the caller you want to annotate is in the same module.
But suppose, I am on malloc() (libc) and I want to see a caller of malloc(), it will
propose 'annotate bar()', but will still show me the code of libc:malloc.
In my earlier test, everything worked because the callee and caller were in the same module.
Could you fix this?
Quoted 67 lines
- Arnaldo
Sent from smartphone
Quoted 62 lines
Quoted 62 lines
- Arnaldo
From: Arnaldo Carvalho de Melo <[email protected]>
Subject: [PATCH 1/1] perf hists browser: Indicate which callchain entries are annotatedNow that we can annotate entries in a callchain, show which ones have an associated symbol and samples, by adding a right arrow just before the symbol name when in verbose mode.
To toggle verbose mode press 'V'.
Cc: Adrian Hunter <[email protected]>
Cc: Borislav Petkov <[email protected]>
Cc: David Ahern <[email protected]>
Cc: Don Zickus <[email protected]>
Cc: Frederic Weisbecker <[email protected]>
Cc: Jiri Olsa <[email protected]>
Cc: Mike Galbraith <[email protected]>
Cc: Namhyung Kim <[email protected]>
Cc: Peter Zijlstra <[email protected]>
Cc: Stephane Eranian <[email protected]>
Link:
http://lkml.kernel.org/n/[email protected]Signed-off-by Arnaldo Carvalho de Melo <[email protected]>--- tools/perf/ui/browsers/hists.c | 4 +++- 1 file changed, 3 insertions(+), 1 deletion(-)tools/perf/ui/browsers/hists.c +1
-0@@ -511,6 +511,7 @@ static void hist_browser__show_callchain_entry(struct hist_browser *browser, { int color, width;char folded_sign =callchain_list__folded (chain); +bool show_annotated = browser->show_dso && chain->ms.sym &&symbol__annotation (chain->ms.sym)->src;color = HE_COLORSET_NORMAL; width = browser->b.width - (offset + 2);tools/perf/ui/browsers/hists.c +2
-1@@ -523,7 +524,8 @@ static void hist_browser__show_callchain_entry(struct hist_browser *browser, ui_browser__set_color(&browser->b, color);hist_browser__gotorc (browser, row,0 );slsmg_write_nstring (" " , offset); -slsmg_printf ("%c " , folded_sign); +slsmg_printf ("%c" , folded_sign); +ui_browser__write_graph (&browser->b, show_annotated ?SLSMG_RARROW_CHAR :' ' );slsmg_write_nstring (str, width);}
--
1.9.3
Quoted 11 lines · Stephane Eranian
Quoted 1 line
Thanks for testing, please let us know if you have further
suggestions,
Quoted 1 line
Ok, it does not work.
I think it works as long as the caller you want to annotate is in the same module.
But suppose, I am onmalloc()(libc) and I want to see a caller ofmalloc(), it will
propose 'annotatebar()', but will still show me the code of libc:malloc.
Quoted 5 lines
In my earlier test, everything worked because the callee and caller were in the
same module.Could you fix this?
I'll try.
Quoted 70 lines
Quoted 17 lines
- Arnaldo
Sent from smartphone
Quoted 10 lines
Quoted 10 lines
- Arnaldo
From: Arnaldo Carvalho de Melo <[email protected]>
Subject: [PATCH 1/1] perf hists browser: Indicate which callchain entries are annotatedNow that we can annotate entries in a callchain, show which ones
have an
Quoted 1 line
Quoted 1 line
Quoted 1 line
associated symbol and samples, by adding a right arrow just before
the
Quoted 4 lines
Quoted 4 lines
Quoted 4 lines
symbol name when in verbose mode.
To toggle verbose mode press 'V'.
Quoted 12 lines
Quoted 4 lines
Quoted 4 lines
Cc Adrian Hunter <[email protected]>Cc Borislav Petkov <[email protected]>Cc David Ahern <[email protected]>Cc Don Zickus <[email protected]>Quoted 8 lines
Quoted 8 lines
Cc: Frederic Weisbecker <[email protected]>
Cc: Jiri Olsa <[email protected]>
Cc: Mike Galbraith <[email protected]>
Cc: Namhyung Kim <[email protected]>
Cc: Peter Zijlstra <[email protected]>
Cc: Stephane Eranian <[email protected]> Link:http://lkml.kernel.org/n/[email protected]
Quoted 5 lines
Quoted 5 lines
Quoted 5 lines
Signed-off-by Arnaldo Carvalho de Melo <[email protected]>--- tools/perf/ui/browsers/hists.c | 4 +++- 1 file changed, 3 insertions(+), 1 deletion(-)Quoted 11 lines
Quoted 11 lines
tools/perf/ui/browsers/hists.c static void · line 515
Quoted 11 lines
tools/perf/ui/browsers/hists.c +1
-0@@ -511,6 +511,7 @@ static void hist_browser__show_callchain_entry(struct hist_browser *browser, { int color, width;char folded_sign =callchain_list__folded (chain); +bool show_annotated = browser->show_dso && chain->ms.sym&&
Quoted 16 lines
Quoted 16 lines
Quoted 16 lines
tools/perf/ui/browsers/hists.c +0
-0symbol__annotation (chain->ms.sym)->src;color = HE_COLORSET_NORMAL; width = browser->b.width - (offset + 2);tools/perf/ui/browsers/hists.c +2
-1@@ -523,7 +524,8 @@ static void hist_browser__show_callchain_entry(struct hist_browser *browser, ui_browser__set_color(&browser->b, color);hist_browser__gotorc (browser, row,0 );slsmg_write_nstring (" " , offset); -slsmg_printf ("%c " , folded_sign); +slsmg_printf ("%c" , folded_sign); +ui_browser__write_graph (&browser->b, show_annotated ?SLSMG_RARROW_CHAR :' ' );slsmg_write_nstring (str, width);}
Quoted 3 lines
Quoted 3 lines
Quoted 3 lines
Quoted 3 lines
--
1.9.3
-- Arnaldo
Sent from smartphone.
Em Fri, Mar 20, 2015 at 10:15:53AM -0700, Stephane Eranian escreveu:
Quoted 31 lines
Hi,
Quoted 14 lines · Arnaldo Carvalho de Melo
Quoted 13 lines · Stephane Eranian
Hi Arnaldo,
Quoted 8 lines · Arnaldo Carvalho de Melo
Hi Stephane,
This patch, together with what is in my perf/core branch, should
implement that feature we talked about recently, i.e. to allow annotating entries in callchains, please take a look at see if you think it is ok,Quoted 6 lines
Quoted 3 lines
I tried on tip.git and a simple example. It does what I wanted. I will try on more complex test cases.
Thanks for implementing this quickly.Thanks for testing, please let us know if you have further suggestions,
Ok, it does not work.
I think it works as long as the caller you want to annotate is in the same module.
But suppose, I am onmalloc()(libc) and I want to see a caller ofmalloc(), it will
propose 'annotatebar()', but will still show me the code of libc:malloc.
Quoted 4 lines
In my earlier test, everything worked because the callee and caller were in the same module.
Could you fix this?
I thought that was covered because it deals with a "map_symbol" struct, where it finds both the symbol and the DSO where it came from, etc.
Checking that now...
- Arnaldo
Em Fri, Mar 20, 2015 at 05:39:22PM -0300, Arnaldo Carvalho de Melo escreveu:
Quoted 17 lines
Em Fri, Mar 20, 2015 at 10:15:53AM -0700, Stephane Eranian escreveu:
Quoted 16 lines · Arnaldo Carvalho de Melo
Quoted 8 lines · Stephane Eranian
Quoted 6 lines
Quoted 4 lines · Arnaldo Carvalho de Melo
This patch, together with what is in my perf/core branch, should
implement that feature we talked about recently, i.e. to allow annotating entries in callchains, please take a look at see if you think it is ok,Quoted 5 lines
Quoted 3 lines
I tried on tip.git and a simple example. It does what I wanted. I will try on more complex test cases.
Thanks for implementing this quickly.Thanks for testing, please let us know if you have further suggestions,
Ok, it does not work.
Are you sure? I just tried, take a look at:
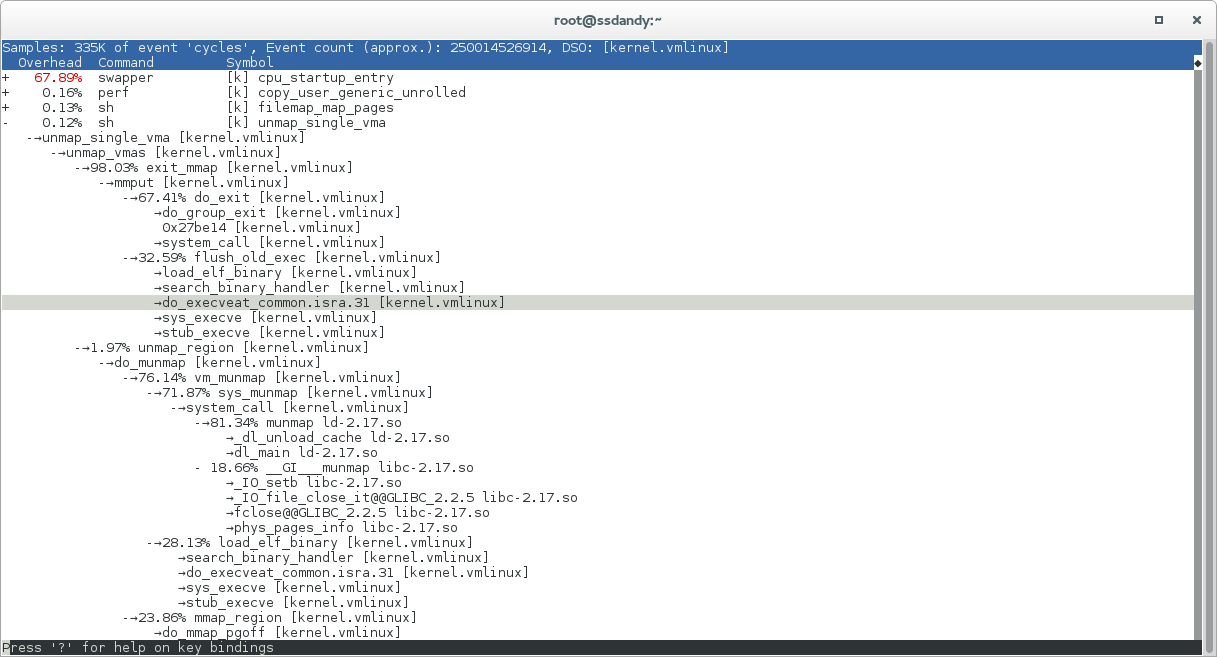
In there you will see that in the unmap_single_vma case there are callchains that pass thru multiple DSOs in userspace (I used --call dwarf in 'perf record') and those are marked as having samples/annotation and when I go to those, pressing 'a' after moving the cursor to it and it works as expected...
Do you have some specific example I could try?
- Arnaldo
Quoted 18 lines
Quoted 10 lines
I think it works as long as the caller you want to annotate is in the same module.
But suppose, I am onmalloc()(libc) and I want to see a caller ofmalloc(), it will
propose 'annotatebar()', but will still show me the code of libc:malloc.In my earlier test, everything worked because the callee and caller were in the same module.
Could you fix this?
I thought that was covered because it deals with a "
map_symbol" struct, where it finds both the symbol and the DSO where it came from, etc.Checking that now...
- Arnaldo
Quoted 23 lines · Arnaldo Carvalho de Melo
Em Fri, Mar 20, 2015 at 05:39:22PM -0300, Arnaldo Carvalho de Melo escreveu:
Quoted 17 lines
Em Fri, Mar 20, 2015 at 10:15:53AM -0700, Stephane Eranian escreveu:
Quoted 16 lines · Arnaldo Carvalho de Melo
Quoted 8 lines · Stephane Eranian
Quoted 6 lines
Quoted 4 lines · Arnaldo Carvalho de Melo
This patch, together with what is in my perf/core branch, should
implement that feature we talked about recently, i.e. to allow annotating entries in callchains, please take a look at see if you think it is ok,Quoted 5 lines
Quoted 3 lines
I tried on tip.git and a simple example. It does what I wanted. I will try on more complex test cases.
Thanks for implementing this quickly.Thanks for testing, please let us know if you have further suggestions,
Ok, it does not work.
Are you sure? I just tried, take a look at:
Quoted 8 lines
In there you will see that in the
unmap_single_vmacase there are callchains that pass thru multiple DSOs in userspace (I used --call dwarf in 'perf record') and those are marked as havingsamples/annotationand when I go to those, pressing 'a' after moving the cursor to it and it works as expected...Do you have some specific example I could try?
I tried on an example I cannot share.
But I am guessing you could reproduce with a test which calls a libc or libm function
heavily form multiple callers in the main program. Example:
       -  pow()
           50% foo() [main.c]
           50% bar() [main.c]
If I move the cursor line to foo() and annotate foo() is shows me the code of pow().
Quoted 18 lines
Quoted 18 lines
Quoted 10 lines
I think it works as long as the caller you want to annotate is in the same module.
But suppose, I am onmalloc()(libc) and I want to see a caller ofmalloc(), it will
propose 'annotatebar()', but will still show me the code of libc:malloc.In my earlier test, everything worked because the callee and caller were in the same module.
Could you fix this?
I thought that was covered because it deals with a "
map_symbol" struct, where it finds both the symbol and the DSO where it came from, etc.Checking that now...
- Arnaldo
Em Fri, Mar 20, 2015 at 02:12:30PM -0700, Stephane Eranian escreveu:
Quoted 38 lines
Quoted 23 lines · Arnaldo Carvalho de Melo
Em Fri, Mar 20, 2015 at 05:39:22PM -0300, Arnaldo Carvalho de Melo escreveu:
Quoted 17 lines
Em Fri, Mar 20, 2015 at 10:15:53AM -0700, Stephane Eranian escreveu:
Quoted 16 lines · Arnaldo Carvalho de Melo
Quoted 8 lines · Stephane Eranian
Quoted 6 lines
Quoted 4 lines · Arnaldo Carvalho de Melo
This patch, together with what is in my perf/core branch, should
implement that feature we talked about recently, i.e. to allow annotating entries in callchains, please take a look at see if you think it is ok,Quoted 5 lines
Quoted 3 lines
I tried on tip.git and a simple example. It does what I wanted. I will try on more complex test cases.
Thanks for implementing this quickly.Thanks for testing, please let us know if you have further suggestions,
Ok, it does not work.
Are you sure? I just tried, take a look at:
Quoted 7 lines
In there you will see that in the
unmap_single_vmacase there are callchains that pass thru multiple DSOs in userspace (I used --call dwarf in 'perf record') and those are marked as havingsamples/annotationand when I go to those, pressing 'a' after moving the cursor to it and it works as expected...Do you have some specific example I could try?
I tried on an example I cannot share.
But I am guessing you could reproduce with a test which calls a libc or libm function
heavily form multiple callers in the main program. Example:
Quoted 6 lines
       -  pow()
           50% foo() [main.c]
           50% bar() [main.c]
If I move the cursor line to
foo()and annotatefoo()is shows me the code ofpow().
+   49.83%  pow-me-harder  pow-me-harder     [.] main
+   27.16%  pow-me-harder  libm-2.17.so      [.] __ieee754_pow_sse2
-   17.76%  pow-me-harder  libm-2.17.so      [.] __pow
   -→__pow libm-2.17.so
      -→80.70% main pow-me-harder
           __libc_start_main libc-2.17.so
           _start pow-me-harder
        16.82% 0x4000000000000000 unknown
        2.44% 0x1 unknown
+    2.57%  pow-me-harder  pow-me-harder     [.] pow@plt
+    2.36%  pow-me-harder  libm-2.17.so      [.] @plt
+    0.04%  pow-me-harder  [kernel.vmlinux]  [k] intel_thermal_interrupt
And if I go to the line:
-→80.70% main pow-me-harder
And press 'a' I get:
main /home/acme/pow-me-harder
 10.25 │ 3e:   mov    -0x10(%rbp),%rax
  1.03 │       test   %rax,%rax
  4.39 │     ↓ js     53
  3.87 │       cvtsi2 %rax,%xmm3
  1.63 │       movsd  %xmm3,-0x38(%rbp)
       │     ↓ jmp    71
  0.03 │ 53:   mov    %rax,%rdx
  0.91 │       shr    %rdx
  0.29 │       and    $0x1,%eax
  1.85 │       or     %rax,%rdx
  7.38 │       cvtsi2 %rdx,%xmm0
  0.55 │       movapd %xmm0,%xmm2
  6.54 │       addsd  %xmm0,%xmm2
  0.68 │       movsd  %xmm2,-0x38(%rbp)
  1.44 │ 71:   cvtsi2 -0x4(%rbp),%xmm0
  2.82 │       movabs $0x4000000000000000,%rax
  0.62 │       mov    %rax,-0x40(%rbp)
  0.07 │       movsd  -0x40(%rbp),%xmm1
  4.30 │     → callq  pow@plt
  1.53 │       addsd  -0x38(%rbp),%xmm0
  4.13 │       ucomis 0xfd(%rip),%xmm0        # 400818 <__dso_handle+0x10>
  4.06 │     ↓ jae    a8
  1.49 │       cvttsd %xmm0,%rax
  1.49 │       mov    %rax,-0x10(%rbp)
  0.35 │     ↓ jmp    cb
       │ a8:   movsd  0xe8(%rip),%xmm1        # 400818 <__dso_handle+0x10>
  0.14 │       subsd  %xmm1,%xmm0
  2.57 │       cvttsd %xmm0,%rax
  0.66 │       mov    %rax,-0x10(%rbp)
       │       movabs $0x8000000000000000,%rax
  7.84 │       xor    %rax,-0x10(%rbp)
 16.80 │ cb:   mov    -0x10(%rbp),%rax
  2.15 │       mov    %rax,-0x10(%rbp)
       │     int main(int argc, char *argv[])
       │     {
       │             int n = atoi(argv[1]), i;
       │             unsigned long long total = 0;
While if I go to the line:
-→__pow libm-2.17.so
And press 'a', I get:
__pow /usr/lib64/libm-2.17.so
       │     Disassembly of section .text:
       │
       │     0000000000026290 <pow>:
       │     __pow():
       │       movapd %xmm0,%xmm2
       │       sub    $0x18,%rsp
  1.70 │       movapd %xmm1,%xmm3
 12.86 │       movsd  %xmm2,(%rsp)
       │       movsd  %xmm3,0x8(%rsp)
  2.43 │     → callq  *ABS*+0x1b110@plt
  0.49 │       movabs $0x7fffffffffffffff,%rcx
  0.28 │       movabs $0x7fefffffffffffff,%rdx
  1.01 │       movq   %xmm0,%rax
 12.58 │       and    %rcx,%rax
  2.18 │       movsd  (%rsp),%xmm2
  1.29 │       cmp    %rdx,%rax
 19.70 │       movsd  0x8(%rsp),%xmm3
  1.50 │     ↓ ja     57
  1.58 │       xorpd  %xmm1,%xmm1
 13.35 │       ucomis %xmm1,%xmm0
  0.89 │     ↓ jnp    a0
       │ 52:   add    $0x18,%rsp
 16.83 │     ← retq
       │ 57:   mov    _DYNAMIC+0x230,%rsi
       │       cmpl   $0xffffffff,(%rsi)
       │     ↑ je     52
Since I don't have glibc-debuginfo installed, I get just assembly.
[acme@ssdandy linux]$ readelf -sw /usr/lib64/libm-2.17.so | grep -w __pow
1737: 0000000000026290 429 FUNC LOCAL DEFAULT 13 __pow
[acme@ssdandy linux]$
Strange, are you pressing 'V' on the main 'perf record' view, i.e. before getting to the annotation browser, to see the DSO just after the symbol?
Trying with a deeper callchain in pow-me-harder.c...
- Arnaldo
Em Fri, Mar 20, 2015 at 06:34:29PM -0300, Arnaldo Carvalho de Melo escreveu:
Quoted 4 lines
Strange, are you pressing 'V' on the main 'perf record' view, i.e. before getting to the annotation browser, to see the DSO just after the symbol?
Trying with a deeper callchain in
pow-me-harder.c...
I'm not being able to reproduce this, out of ideas, back to processing some other patches, please let me know about any news on your side :-\
- Arnaldo
Namhyung Kim
maintainerHi Stephane,
Quoted 38 lines · Stephane Eranian
Quoted 23 lines · Arnaldo Carvalho de Melo
Em Fri, Mar 20, 2015 at 05:39:22PM -0300, Arnaldo Carvalho de Melo escreveu:
Quoted 17 lines
Em Fri, Mar 20, 2015 at 10:15:53AM -0700, Stephane Eranian escreveu:
Quoted 16 lines · Arnaldo Carvalho de Melo
Quoted 8 lines · Stephane Eranian
Quoted 6 lines
Quoted 4 lines · Arnaldo Carvalho de Melo
This patch, together with what is in my perf/core branch, should
implement that feature we talked about recently, i.e. to allow annotating entries in callchains, please take a look at see if you think it is ok,Quoted 5 lines
Quoted 3 lines
I tried on tip.git and a simple example. It does what I wanted. I will try on more complex test cases.
Thanks for implementing this quickly.Thanks for testing, please let us know if you have further suggestions,
Ok, it does not work.
Are you sure? I just tried, take a look at:
Quoted 8 lines
In there you will see that in the
unmap_single_vmacase there are callchains that pass thru multiple DSOs in userspace (I used --call dwarf in 'perf record') and those are marked as havingsamples/annotationand when I go to those, pressing 'a' after moving the cursor to it and it works as expected...Do you have some specific example I could try?
I tried on an example I cannot share.
But I am guessing you could reproduce with a test which calls a libc or libm function
heavily form multiple callers in the main program. Example:
Quoted 6 lines
       -  pow()
           50% foo() [main.c]
           50% bar() [main.c]
If I move the cursor line to
foo()and annotatefoo()is shows me the code ofpow().
Did you play with acme/perf/core not tip/perf/core? I got same problem but then I realize it's not the Arnaldo's tree. When I changed to acme/perf/core the problem disappeared. :)
But unfortunately I got this segfault instead..
  namhyung@sejong:perf$ perf report
  perf: Segmentation fault
  -------- backtrace --------
  perf[0x506e5b]
  /usr/lib/libc.so.6(+0x33540)[0x7fa3eb90a540]
  perf[0x47b39c]
  perf(disasm_line__free+0x58)[0x47c178]
  perf(symbol__tui_annotate+0x2f3)[0x4fe683]
  perf[0x503773]
  perf(perf_evlist__tui_browse_hists+0x94)[0x505b44]
  perf(cmd_report+0x18f0)[0x436890]
  perf[0x47a793]
  perf(main+0x60a)[0x427c7a]
  /usr/lib/libc.so.6(__libc_start_main+0xf0)[0x7fa3eb8f7800]
  perf(_start+0x29)[0x427d99]
  [0x0]
  namhyung@sejong:perf$ addr2line -e `which perf` 0x506e5b
  /home/namhyung/project/linux/tools/perf/ui/tui/setup.c:106
  namhyung@sejong:perf$ addr2line -e `which perf` 0x47b39c
  /home/namhyung/project/linux/tools/perf/util/annotate.c:33
Thanks,
Namhyung
Quoted 45 lines · Namhyung Kim
Hi Stephane,
Quoted 42 lines · Stephane Eranian
Quoted 23 lines · Arnaldo Carvalho de Melo
Em Fri, Mar 20, 2015 at 05:39:22PM -0300, Arnaldo Carvalho de Melo escreveu:
Quoted 17 lines
Em Fri, Mar 20, 2015 at 10:15:53AM -0700, Stephane Eranian escreveu:
Quoted 16 lines · Arnaldo Carvalho de Melo
Quoted 8 lines · Stephane Eranian
Quoted 6 lines
Quoted 4 lines · Arnaldo Carvalho de Melo
This patch, together with what is in my perf/core branch, should
implement that feature we talked about recently, i.e. to allow annotating entries in callchains, please take a look at see if you think it is ok,Quoted 5 lines
Quoted 3 lines
I tried on tip.git and a simple example. It does what I wanted. I will try on more complex test cases.
Thanks for implementing this quickly.Thanks for testing, please let us know if you have further suggestions,
Ok, it does not work.
Are you sure? I just tried, take a look at:
Quoted 8 lines
In there you will see that in the
unmap_single_vmacase there are callchains that pass thru multiple DSOs in userspace (I used --call dwarf in 'perf record') and those are marked as havingsamples/annotationand when I go to those, pressing 'a' after moving the cursor to it and it works as expected...Do you have some specific example I could try?
I tried on an example I cannot share.
But I am guessing you could reproduce with a test which calls a libc or libm function
heavily form multiple callers in the main program. Example:- pow() 50% foo() [main.c] 50% bar() [main.c]
Quoted 7 lines
Quoted 2 lines
If I move the cursor line to
foo()and annotatefoo()is shows me the code ofpow().Did you play with acme/perf/core not tip/perf/core? I got same problem but then I realize it's not the Arnaldo's tree. When I changed to acme/perf/core the problem disappeared. :)
I was only trying it with tip.git. The patch looke simple enough to apply to tip.git but clearly it relies on some other infrastructure changes which I don't know about. In my case =, I care about getting this feature in tip.git or older versions of perf.
Quoted 26 lines
But unfortunately I got this segfault instead..
  namhyung@sejong:perf$ perf report
  perf: Segmentation fault
  -------- backtrace --------
  perf[0x506e5b]
  /usr/lib/libc.so.6(+0x33540)[0x7fa3eb90a540]
  perf[0x47b39c]
  perf(disasm_line__free+0x58)[0x47c178]
  perf(symbol__tui_annotate+0x2f3)[0x4fe683]
  perf[0x503773]
  perf(perf_evlist__tui_browse_hists+0x94)[0x505b44]
  perf(cmd_report+0x18f0)[0x436890]
  perf[0x47a793]
  perf(main+0x60a)[0x427c7a]
  /usr/lib/libc.so.6(__libc_start_main+0xf0)[0x7fa3eb8f7800]
  perf(_start+0x29)[0x427d99]
  [0x0]
namhyung@sejong:perf$ addr2line -e `which perf` 0x506e5b /home/namhyung/project/linux/tools/perf/ui/tui/setup.c:106 namhyung@sejong:perf$ addr2line -e `which perf` 0x47b39c /home/namhyung/project/linux/tools/perf/util/annotate.c:33Thanks,
Namhyung
Quoted 7 lines · Stephane Eranian
On Sun, Mar 22, 2015 at 5:27 PM, Namhyung Kim <[email protected]> wrote:().
Quoted 5 lines
Did you play with acme/perf/core not tip/perf/core? I got same problem but then I realize it's not the Arnaldo's tree. When I changed to acme/perf/core the problem disappeared. :)
Quoted 7 lines
I was only trying it with tip.git. The patch looke simple enough to apply
to tip.git but clearly it relies on some other infrastructure changes which
I don't know about. In my case =, I care about getting this feature in tip.git
or older versions of perf.
It is all in tip.git by now.
Quoted 1 line
Quoted 1 line
But unfortunately I got this segfault instead..
Needs a patch that is in perf/urgent
-- Arnaldo
Sent from smartphone.
Quoted 18 lines · Arnaldo Carvalho de Melo
Quoted 7 lines · Stephane Eranian
On Sun, Mar 22, 2015 at 5:27 PM, Namhyung Kim <[email protected]> wrote:().
Quoted 5 lines
Did you play with acme/perf/core not tip/perf/core? I got same problem but then I realize it's not the Arnaldo's tree. When I changed to acme/perf/core the problem disappeared. :)
Quoted 7 lines
I was only trying it with tip.git. The patch looke simple enough to apply
to tip.git but clearly it relies on some other infrastructure changes which
I don't know about. In my case =, I care about getting this feature in tip.git
or older versions of perf.
Quoted 6 lines
It is all in tip.git by now.
Quoted 1 line
Quoted 1 line
But unfortunately I got this segfault instead..
Needs a patch that is in perf/urgent
If I pull tip.git now. Does it have what is needed to work?
Arnaldo Carvalho de Melo
maintainerEm Fri, Mar 27, 2015 at 04:05:03PM -0700, Stephane Eranian escreveu:
Quoted 12 lines · Arnaldo Carvalho de Melo
Quoted 10 lines · Stephane Eranian
Quoted 9 lines
On Sun, Mar 22, 2015 at 5:27 PM, Namhyung Kim <[email protected]>
Quoted 3 lines
Did you play with acme/perf/core not tip/perf/core? I got same problem but then I realize it's not the Arnaldo's tree. When I changed to acme/perf/core the problem disappeared. :)
I was only trying it with tip.git. The patch looke simple enough to apply to tip.git but clearly it relies on some other infrastructure changes which I don't know about. In my case =, I care about getting this feature in tip.git or older versions of perf.
Quoted 7 lines
Quoted 5 lines
It is all in tip.git by now.
Quoted 1 line
Quoted 1 line
But unfortunately I got this segfault instead..
Needs a patch that is in perf/urgent
If I pull tip.git now. Does it have what is needed to work?
Yes, it should, but you may hit the bug Namhyumg reported, fixed in:
perf annotate: Fix fallback to unparsed disassembler line
----
Humm, by tip.git you mean tip.git/master? /me checks...
[acme@ssdandy linux]$ git log --oneline tip/master tools/perf/util/annotate.c | head -5571564babaa3 Merge branch 'perf/core'2c7da8c590ad perf annotate: Allow annotation for decompressed kernel modules <------------------3995614d9b03 perf annotate: Fix fallback to unparsed disassembler line 48000a1aed74 perf tools: Remove EOL whitespaces 0fb9f2aab738 perf annotate: Fix memory leaks in LOCK handling [acme@ssdandy linux]$
Yeah, it is there, should have everything you need.
- Arnaldo