perf: Branch stack annotation and fixes
Subsystems (2)
Peter Zijlstra
maintainercover perf: Branch stack annotation and fixes
Hi,
These here patches improve the perf branch-stack support and add branch-stack support to perf-annotate.
They appear to work for me; but some of it is fairly hairy code so please have a hard look.
The last patch includes the userspace changes; and includes samples output of 'perf annotate branches', but since email doesn't do color, lots of information is lost. A screenshot of the same data can be found here:
http://programming.kicks-ass.net/sekrit/peterz1.png

And the actual program can be found below.
--- branches.c ---
#include <stdlib.h>
#include <stdio.h>
#define B(x) (1 << x)
long lfsr_taps[] =
{
	[2] = B(0) | B(1),
	[3] = B(0) | B(2),
	[4] = B(0) | B(3),
	[5] = B(1) | B(4),
	[6] = B(0) | B(5),
	[7] = B(0) | B(6),
	[8] = B(1) | B(2) | B(3) | B(7),
	[9] = B(3) | B(8),
	[10] = B(2) | B(9),
	[11] = B(1) | B(10),
	[12] = B(0) | B(3) | B(5) | B(11),
	[13] = B(0) | B(2) | B(3) | B(12),
	[14] = B(0) | B(2) | B(4) | B(13),
	[15] = B(0) | B(14),
	[16] = B(1) | B(2) | B(4) | B(15),
	[17] = B(2) | B(16),
	[18] = B(6) | B(17),
	[19] = B(0) | B(1) | B(4) | B(18),
	[20] = B(2) | B(19),
	[21] = B(1) | B(20),
	[22] = B(0) | B(21),
	[23] = B(4) | B(22),
	[24] = B(0) | B(2) | B(3) | B(23),
	[25] = B(2) | B(24),
	[26] = B(0) | B(1) | B(5) | B(25),
	[27] = B(0) | B(1) | B(4) | B(26),
	[28] = B(2) | B(27),
	[29] = B(1) | B(28),
	[30] = B(0) | B(3) | B(5) | B(29),
	[31] = B(2) | B(30),
	[32] = B(1) | B(5) | B(6) | B(31),
};
unsigned long taps;
static unsigned long lfsr(unsigned long lfsr)
{
	lfsr = (lfsr>>1) ^ ((0x0u - (lfsr & 0x1u)) & taps);
	return lfsr;
}
void lfsr_init(long bits)
{
	taps = lfsr_taps[bits];
}
unsigned volatile long acc = 0;
void branches(unsigned long seed, unsigned long iterations)
{
	long i, reg = seed;

	for (i = 0; i < iterations; i++) {
		if (reg & 0x1)
			acc++;
		else
			acc--;

		reg = lfsr(reg);

		if (seed & 1)
			acc >>= 2;

		if (~reg & 0x1)
			acc--;
		else
			acc++;

		reg = lfsr(reg);
	}
}
int main(int argc, char **argv)
{
	long bits = 22;
	long seed = 2;

	if (argc > 1)
		bits = atoi(argv[1]);

	if (argc > 2)
		seed = atoi(argv[2]);

	lfsr_init(bits);
	branches(seed, 1 << bits);

	return 0;
}
Peter Zijlstra
maintainerRFC PATCH 1/7 perf/x86/intel: Rework the large PEBS setup code
In order to allow optimizing perf_pmu_sched_task() we must ensure perf_sched_cb_{inc,dec} are no longer called from NMI context; this means that pmu::{start,stop}() can no longer use them.
Prepare for this by reworking the whole large PEBS setup code.
The current code relied on the cpuc->pebs_enabled state, however since that reflects the current active state as per pmu::{start,stop}() we can no longer rely on this.
Introduce two counters: cpuc->n_pebs and cpuc->n_large_pebs which count the total number of PEBS events and the number of PEBS events that have FREERUNNING set, resp.. With this we can tell if the current setup requires a single record interrupt threshold or can use a larger buffer.
This also improves the code in that it re-enables the large threshold once the PEBS event that required single record gets removed.
---
 arch/x86/events/intel/ds.c   |   96 +++++++++++++++++++++++++++----------------
 arch/x86/events/perf_event.h |    2
 kernel/events/core.c         |    4 +
 3 files changed, 67 insertions(+), 35 deletions(-)
arch/x86/events/intel/ds.c +61 -35
@@ -806,9 +806,45 @@ struct event_constraint *intel_pebs_consreturn &emptyconstraint; } -static inline bool pebs_is_enabled (struct cpu_hw_events *cpuc) +/* +* We need the sched_task callback even for per-cpu events when we use +* the large interrupt threshold, such that we can provide PID and TID +* to PEBS samples. +*/ +static inline bool pebs_needs_sched_cb (struct cpu_hw_events *cpuc) { -return (cpuc->pebs_enabled & ((1ULL <<MAX_PEBS_EVENTS ) -1 )); +return cpuc->n_pebs && (cpuc->n_pebs == cpuc->n_large_pebs); +} + +static inline void pebs_update_threshold (struct cpu_hw_events *cpuc) +{ +struct debug_store *ds = cpuc->ds; +u64 threshold; + +if (cpuc->n_pebs == cpuc->n_large_pebs) { + threshold = ds->pebs_absolute_maximum - + x86_pmu.max_pebs_events * x86_pmu.pebs_record_size; + }else { + threshold = ds->pebs_buffer_base + x86_pmu.pebs_record_size; + } + + ds->pebs_interrupt_threshold = threshold; +} + +static void intel_pmu_pebs_add (struct perf_event *event) +{ +struct cpu_hw_events *cpuc =this_cpu_ptr (&cpu_hw_events); +struct hw_perf_event *hwc = &event->hw; +bool needs_cb =pebs_needs_sched_cb (cpuc); + + cpuc->n_pebs++; +if (hwc->flags &PERF_X86_EVENT_FREERUNNING ) + cpuc->n_large_pebs++; + +if (!needs_cb &&pebs_needs_sched_cb (cpuc)) +perf_sched_cb_inc (event->ctx->pmu); + +pebs_update_threshold (cpuc); }void intel_pmu_pebs_enable (struct perf_event *event)
@@ -816,12 +852,11 @@ void intel_pmu_pebs_enable(struct perf_estruct cpu_hw_events *cpuc =this_cpu_ptr (&cpu_hw_events);struct hw_perf_event *hwc = &event->hw;struct debug_store *ds = cpuc->ds; -bool first_pebs; -u64 threshold; + +intel_pmu_pebs_add (event); hwc->config &= ~ARCH_PERFMON_EVENTSEL_INT ; - first_pebs = !pebs_is_enabled (cpuc); cpuc->pebs_enabled |=1ULL << hwc->idx;if (event->hw.flags &PERF_X86_EVENT_PEBS_LDLAT )
@@ -830,46 +865,38 @@ void intel_pmu_pebs_enable(struct perf_e cpuc->pebs_enabled |=1ULL <<63 ;/* -* When the event is constrained enough we can use a larger -* threshold and run the event with less frequent PMI. +* Use auto-reload if possible to save a MSR write in the PMI. +* This must be done in pmu::start(), because PERF_EVENT_IOC_PERIOD. */ -if (hwc->flags &PERF_X86_EVENT_FREERUNNING ) { - threshold = ds->pebs_absolute_maximum - - x86_pmu.max_pebs_events * x86_pmu.pebs_record_size; - -if (first_pebs) -perf_sched_cb_inc (event->ctx->pmu); - }else { - threshold = ds->pebs_buffer_base + x86_pmu.pebs_record_size; - -/* -* If not all events can use larger buffer, -* roll back to threshold = 1 -*/ -if (!first_pebs && - (ds->pebs_interrupt_threshold > threshold)) -perf_sched_cb_dec (event->ctx->pmu); - } - -/* Use auto-reload if possible to save a MSR write in the PMI */ if (hwc->flags &PERF_X86_EVENT_AUTO_RELOAD ) { ds->pebs_event_reset[hwc->idx] = (u64)(-hwc->sample_period) & x86_pmu.cntval_mask; } +} -if (first_pebs || ds->pebs_interrupt_threshold > threshold) - ds->pebs_interrupt_threshold = threshold; +static void intel_pmu_pebs_del (struct perf_event *event) +{ +struct cpu_hw_events *cpuc =this_cpu_ptr (&cpu_hw_events); +struct hw_perf_event *hwc = &event->hw; +bool needs_cb =pebs_needs_sched_cb (cpuc); + + cpuc->n_pebs--; +if (hwc->flags &PERF_X86_EVENT_FREERUNNING ) + cpuc->n_large_pebs--; + +if (needs_cb && !pebs_needs_sched_cb (cpuc)) +perf_sched_cb_dec (event->ctx->pmu); + +if (cpuc->n_pebs) +pebs_update_threshold (cpuc); }void intel_pmu_pebs_disable (struct perf_event *event) {struct cpu_hw_events *cpuc =this_cpu_ptr (&cpu_hw_events);struct hw_perf_event *hwc = &event->hw; -struct debug_store *ds = cpuc->ds; -bool large_pebs = ds->pebs_interrupt_threshold > - ds->pebs_buffer_base + x86_pmu.pebs_record_size; -if (large_pebs) +if (cpuc->n_pebs == cpuc->n_large_pebs)intel_pmu_drain_pebs_buffer (); cpuc->pebs_enabled &= ~(1ULL << hwc->idx);
@@ -879,13 +906,12 @@ void intel_pmu_pebs_disable(struct perf_else if (event->hw.flags &PERF_X86_EVENT_PEBS_ST ) cpuc->pebs_enabled &= ~(1ULL <<63 ); -if (large_pebs && !pebs_is_enabled (cpuc)) -perf_sched_cb_dec (event->ctx->pmu); -if (cpuc->enabled)wrmsrl (MSR_IA32_PEBS_ENABLE , cpuc->pebs_enabled); hwc->config |=ARCH_PERFMON_EVENTSEL_INT ; + +intel_pmu_pebs_del (event); }void intel_pmu_pebs_enable_all (void )
arch/x86/events/perf_event.h +2 -0
@@ -194,6 +194,8 @@ struct cpu_hw_events {*/ struct debug_store *ds;u64 pebs_enabled; +int n_pebs; +int n_large_pebs;/* * Intel LBR bits
kernel/events/core.c +4 -0
@@ -2791,6 +2791,10 @@ void perf_sched_cb_inc(struct pmu *pmu)/* * This function provides the context switch callback to the lower code * layer. It is invoked ONLY when the context switch callback is enabled. +* +* This callback is relevant even to per-cpu events; for example multi event +* PEBS requires this to provide PID/TID information. This requires we flush +* all queued PEBS records before we context switch to a new task. */ static void perf_pmu_sched_task(struct task_struct *prev, struct task_struct *next,
Re: [RFC][PATCH 1/7] perf/x86/intel: Rework the large PEBS setup code
On Fri, Jul 08, 2016 at 03:31:00PM +0200, Peter Zijlstra wrote:
SNIP
Quoted 13 lines
arch/x86/events/intel/ds.c +2
-9/* -* When the event is constrained enough we can use a larger -* threshold and run the event with less frequent PMI. +* Use auto-reload if possible to save a MSR write in the PMI. +* This must be done in pmu::start(), because PERF_EVENT_IOC_PERIOD. */ -if (hwc->flags &PERF_X86_EVENT_FREERUNNING ) { - threshold = ds->pebs_absolute_maximum - - x86_pmu.max_pebs_events * x86_pmu.pebs_record_size; - -if (first_pebs) -perf_sched_cb_inc (event->ctx->pmu); - }else {
arch/x86/events/intel/ds.c void intel_pmu_pebs_enable(struct perf_e · line 852
Quoted 10 lines
arch/x86/events/intel/ds.c +0
-10- threshold = ds->pebs_buffer_base + x86_pmu.pebs_record_size; - -/* -* If not all events can use larger buffer, -* roll back to threshold = 1 -*/ -if (!first_pebs && - (ds->pebs_interrupt_threshold > threshold)) -perf_sched_cb_dec (event->ctx->pmu); - }
hum, the original code switched back the perf_sched_cb, in case !feerunning event was detected.. I dont see it in the new code.. just the threshold update
jirka
Peter Zijlstra
maintainerRe: [RFC][PATCH 1/7] perf/x86/intel: Rework the large PEBS setup code
Quoted 39 lines · Jiri Olsa
On Fri, Jul 08, 2016 at 03:31:00PM +0200, Peter Zijlstra wrote:
SNIP
Quoted 13 lines
arch/x86/events/intel/ds.c +2
-9/* -* When the event is constrained enough we can use a larger -* threshold and run the event with less frequent PMI. +* Use auto-reload if possible to save a MSR write in the PMI. +* This must be done in pmu::start(), because PERF_EVENT_IOC_PERIOD. */ -if (hwc->flags &PERF_X86_EVENT_FREERUNNING ) { - threshold = ds->pebs_absolute_maximum - - x86_pmu.max_pebs_events * x86_pmu.pebs_record_size; - -if (first_pebs) -perf_sched_cb_inc (event->ctx->pmu); - }else {arch/x86/events/intel/ds.c void intel_pmu_pebs_enable(struct perf_e · line 852
Quoted 10 lines
arch/x86/events/intel/ds.c +0
-10- threshold = ds->pebs_buffer_base + x86_pmu.pebs_record_size; - -/* -* If not all events can use larger buffer, -* roll back to threshold = 1 -*/ -if (!first_pebs && - (ds->pebs_interrupt_threshold > threshold)) -perf_sched_cb_dec (event->ctx->pmu); - }hum, the original code switched back the
perf_sched_cb, in case !feerunning event was detected.. I dont see it in the new code.. just the threshold updatearch/x86/events/intel/ds.c +5
-0+static inline bool pebs_needs_sched_cb (struct cpu_hw_events *cpuc) { +return cpuc->n_pebs && (cpuc->n_pebs == cpuc->n_large_pebs); +} +static void intel_pmu_pebs_add (struct perf_event *event) +{
arch/x86/events/intel/ds.c struct event_constraint *intel_pebs_cons · line 845
Quoted 10 lines
arch/x86/events/intel/ds.c +10
-0+struct cpu_hw_events *cpuc =this_cpu_ptr (&cpu_hw_events); +struct hw_perf_event *hwc = &event->hw; +bool needs_cb =pebs_needs_sched_cb (cpuc); + + cpuc->n_pebs++; +if (hwc->flags &PERF_X86_EVENT_FREERUNNING ) + cpuc->n_large_pebs++; + +if (!needs_cb &&pebs_needs_sched_cb (cpuc)) +perf_sched_cb_inc (event->ctx->pmu);
Ah, you're saying this,
Quoted 5 lines
arch/x86/events/intel/ds.c +3
-0+pebs_update_threshold (cpuc); } +static void intel_pmu_pebs_del (struct perf_event *event) +{
arch/x86/events/intel/ds.c void intel_pmu_pebs_enable(struct perf_e · line 888
Quoted 10 lines
arch/x86/events/intel/ds.c +10
-0+struct cpu_hw_events *cpuc =this_cpu_ptr (&cpu_hw_events); +struct hw_perf_event *hwc = &event->hw; +bool needs_cb =pebs_needs_sched_cb (cpuc); + + cpuc->n_pebs--; +if (hwc->flags &PERF_X86_EVENT_FREERUNNING ) + cpuc->n_large_pebs--; + +if (needs_cb && !pebs_needs_sched_cb (cpuc)) +perf_sched_cb_dec (event->ctx->pmu);
and this, should also have something like
	if (!needs_cb && pebs_needs_sched_cb(cpuc))
		perf_sched_cb_inc(event->ctx->pmu)
Because the event we just removed was the one inhibiting FREERUNNING and we can now let it rip again.
Yes, you're right. Let me try and see if I can make that better.
Thanks!
Quoted 4 lines
arch/x86/events/intel/ds.c +3
-0+ +if (cpuc->n_pebs) +pebs_update_threshold (cpuc); }
Peter Zijlstra
maintainerRe: [RFC][PATCH 1/7] perf/x86/intel: Rework the large PEBS setup code
Quoted 1 line · Peter Zijlstra
Yes, you're right. Let me try and see if I can make that better.
Something like so?
---
arch/x86/events/intel/ds.c +14 -9
@@ -831,6 +831,18 @@ static inline void pebs_update_threshold ds->pebs_interrupt_threshold = threshold; } +static void pebs_update_state (bool needs_cb,struct cpu_hw_events *cpuc,struct pmu *pmu) +{ +if (needs_cb !=pebs_needs_sched_cb (cpuc)) { +if (!needs_cb) +perf_sched_cb_inc (pmu); +else +perf_sched_cb_dec (pmu); + +pebs_update_threshold (cpuc); + } +} +static void intel_pmu_pebs_add (struct perf_event *event) {struct cpu_hw_events *cpuc =this_cpu_ptr (&cpu_hw_events);
@@ -841,10 +853,7 @@ static void intel_pmu_pebs_add(struct peif (hwc->flags &PERF_X86_EVENT_FREERUNNING ) cpuc->n_large_pebs++; -if (!needs_cb &&pebs_needs_sched_cb (cpuc)) -perf_sched_cb_inc (event->ctx->pmu); - -pebs_update_threshold (cpuc); +pebs_update_state (needs_cb, cpuc, event->ctx->pmu); }void intel_pmu_pebs_enable (struct perf_event *event)
@@ -884,11 +893,7 @@ static void intel_pmu_pebs_del(struct peif (hwc->flags &PERF_X86_EVENT_FREERUNNING ) cpuc->n_large_pebs--; -if (needs_cb && !pebs_needs_sched_cb (cpuc)) -perf_sched_cb_dec (event->ctx->pmu); - -if (cpuc->n_pebs) -pebs_update_threshold (cpuc); +pebs_update_state (needs_cb, cpuc, event->ctx->pmu); }void intel_pmu_pebs_disable (struct perf_event *event)
Re: [RFC][PATCH 1/7] perf/x86/intel: Rework the large PEBS setup code
Quoted 4 lines · Peter Zijlstra
Quoted 1 line · Peter Zijlstra
Yes, you're right. Let me try and see if I can make that better.
Something like so?
yep, seems good ;-)
jirka
Quoted 48 lines
---
arch/x86/events/intel/ds.c +14
-9@@ -831,6 +831,18 @@ static inline void pebs_update_threshold ds->pebs_interrupt_threshold = threshold; } +static void pebs_update_state (bool needs_cb,struct cpu_hw_events *cpuc,struct pmu *pmu) +{ +if (needs_cb !=pebs_needs_sched_cb (cpuc)) { +if (!needs_cb) +perf_sched_cb_inc (pmu); +else +perf_sched_cb_dec (pmu); + +pebs_update_threshold (cpuc); + } +} +static void intel_pmu_pebs_add (struct perf_event *event) {struct cpu_hw_events *cpuc =this_cpu_ptr (&cpu_hw_events);@@ -841,10 +853,7 @@ static void intel_pmu_pebs_add(struct peif (hwc->flags &PERF_X86_EVENT_FREERUNNING ) cpuc->n_large_pebs++; -if (!needs_cb &&pebs_needs_sched_cb (cpuc)) -perf_sched_cb_inc (event->ctx->pmu); - -pebs_update_threshold (cpuc); +pebs_update_state (needs_cb, cpuc, event->ctx->pmu); }void intel_pmu_pebs_enable (struct perf_event *event)@@ -884,11 +893,7 @@ static void intel_pmu_pebs_del(struct peif (hwc->flags &PERF_X86_EVENT_FREERUNNING ) cpuc->n_large_pebs--; -if (needs_cb && !pebs_needs_sched_cb (cpuc)) -perf_sched_cb_dec (event->ctx->pmu); - -if (cpuc->n_pebs) -pebs_update_threshold (cpuc); +pebs_update_state (needs_cb, cpuc, event->ctx->pmu); }void intel_pmu_pebs_disable (struct perf_event *event)
Peter Zijlstra
maintainerRFC PATCH 2/7 perf,x86: Ensure perf_sched_cb_{inc,dec}() is only called from pmu::{add,del}()
In reply to Peter ZijlstraCurrently perf_sched_cb_{inc,dec}() are called from pmu::{start,stop}(), which has the problem that this can happen from NMI context, this is making it hard to optimize perf_pmu_sched_task().
Furthermore, we really only need this accounting on pmu::{add,del}(), so doing it from pmu::{start,stop}() is doing more work than we really need.
Introduce x86_pmu::{add,del}() and wire up the LBR and PEBS.
---
 arch/x86/events/core.c       |   24 ++++++++++++++++++++++--
 arch/x86/events/intel/core.c |   31 ++++++++++++++++++-------------
 arch/x86/events/intel/ds.c   |    8 ++------
 arch/x86/events/intel/lbr.c  |    4 ++--
 arch/x86/events/perf_event.h |   10 ++++++++--
 5 files changed, 52 insertions(+), 25 deletions(-)
arch/x86/events/core.c +22 -2
@@ -1197,6 +1197,9 @@ static int x86_pmu_add(struct perf_event* If group events scheduling transaction was started, * skip the schedulability test here, it will be performed * at commit time (->commit_txn) as a whole. +* +* If commit fails, we'll call ->del() on all events +* for which ->add() was called. */ if (cpuc->txn_flags &PERF_PMU_TXN_ADD ) goto done_collect;
@@ -1219,6 +1222,14 @@ static int x86_pmu_add(struct perf_event cpuc->n_added += n - n0; cpuc->n_txn += n - n0; +if (x86_pmu.add) { +/* +* This is before x86_pmu_enable() will call x86_pmu_start(), +* so we enable LBRs before an event needs them etc.. +*/ + x86_pmu.add (event); + } + ret =0 ; out:return ret;
@@ -1342,7 +1353,7 @@ static void x86_pmu_del(struct perf_even event->hw.flags &= ~PERF_X86_EVENT_COMMITTED ;/* -* If we're called during a txn, we don't need to do anything. +* If we're called during a txn, we only need to undo x86_pmu.add. * The events never got scheduled and ->cancel_txn will truncate * the event_list. *
@@ -1350,7 +1361,7 @@ static void x86_pmu_del(struct perf_even* an event added during that same TXN. */ if (cpuc->txn_flags &PERF_PMU_TXN_ADD ) -return ; + goto do_del;/* * Not a TXN, therefore cleanup properly.
@@ -1380,6 +1391,15 @@ static void x86_pmu_del(struct perf_even --cpuc->n_events;perf_event_update_userpage (event); + +do_del: +if (x86_pmu.del) { +/* +* This is after x86_pmu_stop(); so we disable LBRs after any +* event can need them etc.. +*/ + x86_pmu.del (event); + } }int x86_pmu_handle_irq (struct pt_regs *regs)
arch/x86/events/intel/core.c +18 -13
@@ -1907,13 +1907,6 @@ static void intel_pmu_disable_event(stru cpuc->intel_ctrl_host_mask &= ~(1ull << hwc->idx); cpuc->intel_cp_status &= ~(1ull << hwc->idx); -/* -* must disable before any actual event -* because any event may be combined with LBR -*/ -if (needs_branch_stack (event)) -intel_pmu_lbr_disable (event); -if (unlikely (hwc->config_base ==MSR_ARCH_PERFMON_FIXED_CTR_CTRL )) {intel_pmu_disable_fixed (hwc);return ;
@@ -1925,6 +1918,14 @@ static void intel_pmu_disable_event(struintel_pmu_pebs_disable (event); } +static void intel_pmu_del_event (struct perf_event *event) +{ +if (needs_branch_stack (event)) +intel_pmu_lbr_del (event); +if (event->attr.precise_ip) +intel_pmu_pebs_del (event); +} +static void intel_pmu_enable_fixed (struct hw_perf_event *hwc) {int idx = hwc->idx -INTEL_PMC_IDX_FIXED ;
@@ -1968,12 +1969,6 @@ static void intel_pmu_enable_event(strucintel_pmu_enable_bts (hwc->config);return ; } -/* -* must enabled before any actual event -* because any event may be combined with LBR -*/ -if (needs_branch_stack (event)) -intel_pmu_lbr_enable (event);if (event->attr.exclude_host) cpuc->intel_ctrl_guest_mask |= (1ull << hwc->idx);
@@ -1994,6 +1989,14 @@ static void intel_pmu_enable_event(struc__x86_pmu_enable_event (hwc,ARCH_PERFMON_EVENTSEL_ENABLE ); } +static void intel_pmu_add_event (struct perf_event *event) +{ +if (event->attr.precise_ip) +intel_pmu_pebs_add (event); +if (needs_branch_stack (event)) +intel_pmu_lbr_add (event); +} +/* * Save and restart an expired event. Called by NMI contexts, * so it has to be careful about preempting normal event ops:
@@ -3290,6 +3293,8 @@ static __initconst const struct x86_pmu
 	.enable_all		= intel_pmu_enable_all,
 	.enable			= intel_pmu_enable_event,
 	.disable		= intel_pmu_disable_event,
+	.add			= intel_pmu_add_event,
+	.del			= intel_pmu_del_event,
 	.hw_config		= intel_pmu_hw_config,
 	.schedule_events	= x86_schedule_events,
 	.eventsel		= MSR_ARCH_PERFMON_EVENTSEL0,
arch/x86/events/intel/ds.c +2 -6
@@ -831,7 +831,7 @@ static inline void pebs_update_threshold ds->pebs_interrupt_threshold = threshold; } -static void intel_pmu_pebs_add (struct perf_event *event) +void intel_pmu_pebs_add (struct perf_event *event) {struct cpu_hw_events *cpuc =this_cpu_ptr (&cpu_hw_events);struct hw_perf_event *hwc = &event->hw;
@@ -853,8 +853,6 @@ void intel_pmu_pebs_enable(struct perf_estruct hw_perf_event *hwc = &event->hw;struct debug_store *ds = cpuc->ds; -intel_pmu_pebs_add (event); - hwc->config &= ~ARCH_PERFMON_EVENTSEL_INT ; cpuc->pebs_enabled |=1ULL << hwc->idx;
@@ -874,7 +872,7 @@ void intel_pmu_pebs_enable(struct perf_e } } -static void intel_pmu_pebs_del (struct perf_event *event) +void intel_pmu_pebs_del (struct perf_event *event) {struct cpu_hw_events *cpuc =this_cpu_ptr (&cpu_hw_events);struct hw_perf_event *hwc = &event->hw;
@@ -910,8 +908,6 @@ void intel_pmu_pebs_disable(struct perf_wrmsrl (MSR_IA32_PEBS_ENABLE , cpuc->pebs_enabled); hwc->config |=ARCH_PERFMON_EVENTSEL_INT ; - -intel_pmu_pebs_del (event); }void intel_pmu_pebs_enable_all (void )
arch/x86/events/intel/lbr.c +2 -2
@@ -422,7 +422,7 @@ static inline bool branch_user_callstackreturn (br_sel &X86_BR_USER ) && (br_sel &X86_BR_CALL_STACK ); } -void intel_pmu_lbr_enable (struct perf_event *event) +void intel_pmu_lbr_add (struct perf_event *event) {struct cpu_hw_events *cpuc =this_cpu_ptr (&cpu_hw_events);struct x86_perf_task_context *task_ctx;
@@ -450,7 +450,7 @@ void intel_pmu_lbr_enable(struct perf_evperf_sched_cb_inc (event->ctx->pmu); } -void intel_pmu_lbr_disable (struct perf_event *event) +void intel_pmu_lbr_del (struct perf_event *event) {struct cpu_hw_events *cpuc =this_cpu_ptr (&cpu_hw_events);struct x86_perf_task_context *task_ctx;
arch/x86/events/perf_event.h +8 -2
@@ -510,6 +510,8 @@ struct x86_pmu {void (*enable_all)(int added);void (*enable)(struct perf_event *);void (*disable)(struct perf_event *); +void (*add)(struct perf_event *); +void (*del)(struct perf_event *);int (*hw_config)(struct perf_event *event);int (*schedule_events)(struct cpu_hw_events *cpuc,int n,int *assign);unsigned eventsel;
@@ -890,6 +892,10 @@ extern struct event_constraint intel_sklstruct event_constraint *intel_pebs_constraints (struct perf_event *event); +void intel_pmu_pebs_add (struct perf_event *event); + +void intel_pmu_pebs_del (struct perf_event *event); +void intel_pmu_pebs_enable (struct perf_event *event);void intel_pmu_pebs_disable (struct perf_event *event);
@@ -908,9 +914,9 @@ u64 lbr_from_signext_quirk_wr(u64 val);void intel_pmu_lbr_reset (void ); -void intel_pmu_lbr_enable (struct perf_event *event); +void intel_pmu_lbr_add (struct perf_event *event); -void intel_pmu_lbr_disable (struct perf_event *event); +void intel_pmu_lbr_del (struct perf_event *event);void intel_pmu_lbr_enable_all (bool pmi);
Peter Zijlstra
maintainerRFC PATCH 3/7 perf/x86/intel: DCE intel_pmu_lbr_del()
In reply to Peter ZijlstraSince pmu::del() is always called under perf_pmu_disable(), the block conditional on cpuc->enabled is dead.
---
 arch/x86/events/intel/lbr.c |    6 ------
 1 file changed, 6 deletions(-)
arch/x86/events/intel/lbr.c +0 -6
@@ -467,12 +467,6 @@ void intel_pmu_lbr_del(struct perf_event cpuc->lbr_users--;WARN_ON_ONCE (cpuc->lbr_users <0 );perf_sched_cb_dec (event->ctx->pmu); - -if (cpuc->enabled && !cpuc->lbr_users) { -__intel_pmu_lbr_disable (); -/* avoid stale pointer */ - cpuc->lbr_context =NULL ; - } }void intel_pmu_lbr_enable_all (bool pmi)
Peter Zijlstra
maintainerRFC PATCH 4/7 perf/x86/intel: Remove redundant test from intel_pmu_lbr_add()
In reply to Peter ZijlstraBy the time we call pmu::add(), event->ctx must be set, and we even already rely on this, so remove that test from intel_pmu_lbr_add().
---
 arch/x86/events/intel/lbr.c |    3 +--
 1 file changed, 1 insertion(+), 2 deletions(-)
arch/x86/events/intel/lbr.c +1 -2
@@ -440,8 +440,7 @@ void intel_pmu_lbr_add(struct perf_event } cpuc->br_sel = event->hw.branch_reg.reg; -if (branch_user_callstack (cpuc->br_sel) && event->ctx && - event->ctx->task_ctx_data) { +if (branch_user_callstack (cpuc->br_sel) && event->ctx->task_ctx_data) { task_ctx = event->ctx->task_ctx_data; task_ctx->lbr_callstack_users++; }
Peter Zijlstra
maintainerRFC PATCH 5/7 perf/x86/intel: Clean up LBR state tracking
In reply to Peter ZijlstraThe lbr_context logic confused me; it appears to me to try and do the same thing the pmu::sched_task() callback does now, but limited to per-task events.
So rip it out. Afaict this should also improve performance, because I think the current code can end up doing lbr_reset() twice, once from the pmu::add() and then again from pmu::sched_task(), and MSR writes (all 3*16 of them) are expensive!!
While thinking through the cases that need the reset it occured to me the first install of an event in an active context needs to reset the LBR (who knows what crap is in there), but detecting this case is somewhat hard.
---
 arch/x86/events/intel/lbr.c  |   54 ++++++++++++++++++++++---------------------
 arch/x86/events/perf_event.h |    1
 2 files changed, 28 insertions(+), 27 deletions(-)
arch/x86/events/intel/lbr.c +28 -26
@@ -390,31 +390,21 @@ void intel_pmu_lbr_sched_task(struct per*/ task_ctx = ctx ? ctx->task_ctx_data :NULL ;if (task_ctx) { -if (sched_in) { +if (sched_in)__intel_pmu_lbr_restore (task_ctx); - cpuc->lbr_context = ctx; - }else { +else __intel_pmu_lbr_save (task_ctx); - }return ; }/* -* When sampling the branck stack in system-wide, it may be -* necessary to flush the stack on context switch. This happens -* when the branch stack does not tag its entries with the pid -* of the current task. Otherwise it becomes impossible to -* associate a branch entry with a task. This ambiguity is more -* likely to appear when the branch stack supports priv level -* filtering and the user sets it to monitor only at the user -* level (which could be a useful measurement in system-wide -* mode). In that case, the risk is high of having a branch -* stack with branch from multiple tasks. +* Since a context switch can flip the address space and LBR entries +* are not tagged with an identifier, we need to wipe the LBR, even for +* per-cpu events. You simply cannot resolve the branches from the old +* address space. */ -if (sched_in) { +if (sched_in)intel_pmu_lbr_reset (); - cpuc->lbr_context = ctx; - } }static inline bool branch_user_callstack (unsigned br_sel)
@@ -430,14 +420,6 @@ void intel_pmu_lbr_add(struct perf_eventif (!x86_pmu.lbr_nr)return ; -/* -* Reset the LBR stack if we changed task context to -* avoid data leaks. -*/ -if (event->ctx->task && cpuc->lbr_context != event->ctx) { -intel_pmu_lbr_reset (); - cpuc->lbr_context = event->ctx; - } cpuc->br_sel = event->hw.branch_reg.reg;if (branch_user_callstack (cpuc->br_sel) && event->ctx->task_ctx_data) {
@@ -445,8 +427,28 @@ void intel_pmu_lbr_add(struct perf_event task_ctx->lbr_callstack_users++; } - cpuc->lbr_users++; +/* +* Request pmu::sched_task() callback, which will fire inside the +* regular perf event scheduling, so that call will: +* +* - restore or wipe; when LBR-callstack, +* - wipe; otherwise, +* +* when this is from __perf_event_task_sched_in(). +* +* However, if this is from perf_install_in_context(), no such callback +* will follow and we'll need to reset the LBR here if this is the +* first LBR event. +* +* The problem is, we cannot tell these cases apart... but we can +* exclude the biggest chunk of cases by looking at +* event->total_time_running. An event that has accrued runtime cannot +* be 'new'. Conversely, a new event can get installed through the +* context switch path for the first time. +*/ perf_sched_cb_inc (event->ctx->pmu); +if (!cpuc->lbr_users++ && !event->total_time_running) +intel_pmu_lbr_reset (); }void intel_pmu_lbr_del (struct perf_event *event)
arch/x86/events/perf_event.h +0 -1
@@ -201,7 +201,6 @@ struct cpu_hw_events {* Intel LBR bits */ int lbr_users; -void *lbr_context;struct perf_branch_stack lbr_stack;struct perf_branch_entry lbr_entries[MAX_LBR_ENTRIES ];struct er_account *lbr_sel;
Peter Zijlstra
maintainerRFC PATCH 6/7 perf: Optimize perF_pmu_sched_task()
In reply to Peter ZijlstraFor perf record -b, which requires the pmu::sched_task callback the current code is rather expensive:
     7.68%  sched-pipe  [kernel.vmlinux]    [k] perf_pmu_sched_task
     5.95%  sched-pipe  [kernel.vmlinux]    [k] __switch_to
     5.20%  sched-pipe  [kernel.vmlinux]    [k] __intel_pmu_disable_all
     3.95%  sched-pipe  perf                [.] worker_thread
The problem is that it will iterate all registered PMUs, most of which will not have anything to do. Avoid this by keeping an explicit list of PMUs that have requested the callback.
The perf_sched_cb_{inc,dec}() functions already take the required pmu argument, and now that these functions are no longer called from NMI context we can use them to manage a list.
With this patch applied the function doesn't show up in the top 4 anymore (it dropped to 18th place).
     6.67%  sched-pipe  [kernel.vmlinux]    [k] __switch_to
     6.18%  sched-pipe  [kernel.vmlinux]    [k] __intel_pmu_disable_all
     3.92%  sched-pipe  [kernel.vmlinux]    [k] switch_mm_irqs_off
3.71% sched-pipe perf [.] worker_thread--- include/linux/perf_event.h | 3 +++ kernel/events/core.c | 43 ++++++++++++++++++++++++------------------- 2 files changed, 27 insertions(+), 19 deletions(-)
include/linux/perf_event.h +3 -0
@@ -757,6 +757,9 @@ struct perf_cpu_context {struct pmu *unique_pmu;struct perf_cgroup *cgrp; + +struct list_head sched_cb_entry; +int sched_cb_usage; };struct perf_output_handle {
kernel/events/core.c +24 -19
77 lines not on this page · raw message
Peter Zijlstra
maintainerRFC PATCH 7/7 perf/annotate: Add branch stack / basic block information
In reply to Peter ZijlstraI wanted to know the hottest path through a function and figured the branch-stack (LBR) information should be able to help out with that.
The below uses the branch-stack to create basic blocks and generate statistics from them.
from to branch_i
* ----> *
|
| block
v
* ----> *
from to branch_i+1
The blocks are broken down into non-overlapping ranges, while tracking if the start of each range is an entry point and/or the end of a range is a branch.
Each block iterates all ranges it covers (while splitting where required to exactly match the block) and increments the 'coverage' count.
For the range including the branch we increment the taken counter, as well as the pred counter if flags.predicted.
Using these number we can find if an instruction:
- had coverage; given by:
br->coverage / br->sym->max_coverage
This metric ensures each symbol has a 100% spot, which reflects the observation that each symbol must have a most covered/hottest block.
- is a branch target: br->is_target && br->start == add
- for targets, how much of a branch's coverages comes from it:
target->entry / branch->coverage
- is a branch: br->is_branch && br->end == addr
- for branches, how often it was taken:
br->taken / br->coverage
after all, all execution that didn't take the branch would have incremented the coverage and continued onward to a later branch.
- for branches, how often it was predicted:
br->pred / br->taken
The coverage percentage is used to color the address and asm sections; for low (<1%) coverage we use NORMAL (uncolored), indicating that these instructions are not 'important'. For high coverage (>75%) we color the address RED.
For each branch, we add an asm comment after the instruction with information on how often it was taken and predicted.
Output looks like (sans color, which does loose a lot of the information :/):
$ perf record --branch-filter u,any -e cycles:p ./branches 27
$ perf annotate branches
         :      000000000040053a <branches>:
         :      branches():
    0.00 :        40053a:       push   %rbp
    0.00 :        40053b:       mov    %rsp,%rbp
    0.00 :        40053e:       sub    $0x20,%rsp
    0.00 :        400542:       mov    %rdi,-0x18(%rbp)
    0.00 :        400546:       mov    %rsi,-0x20(%rbp)
    0.00 :        40054a:       mov    -0x18(%rbp),%rax
    0.00 :        40054e:       mov    %rax,-0x10(%rbp)
    0.00 :        400552:       movq   $0x0,-0x8(%rbp)
    0.00 :        40055a:       jmpq   400616 <branches+0xdc>
    2.59 :        40055f:       mov    -0x10(%rbp),%rax # +100.00%
    8.93 :        400563:       and    $0x1,%eax
    2.42 :        400566:       test   %rax,%rax
    0.00 :        400569:       je     40057f <branches+0x45>   # -54.64% (p:42.72%)
    1.09 :        40056b:       mov    0x2006be(%rip),%rax        # 600c30 <acc>
   11.22 :        400572:       add    $0x1,%rax
    0.58 :        400576:       mov    %rax,0x2006b3(%rip)        # 600c30 <acc>
    0.75 :        40057d:       jmp    400591 <branches+0x57>   # -100.00% (p:100.00%)
    1.28 :        40057f:       mov    0x2006aa(%rip),%rax        # 600c30 <acc>        # +50.11%
   11.21 :        400586:       sub    $0x1,%rax
    0.62 :        40058a:       mov    %rax,0x20069f(%rip)        # 600c30 <acc>
    2.54 :        400591:       mov    -0x10(%rbp),%rax # +49.89%
    0.71 :        400595:       mov    %rax,%rdi
    0.11 :        400598:       callq  4004e6 <lfsr>    # -100.00% (p:100.00%)
    0.00 :        40059d:       mov    %rax,-0x10(%rbp) # +100.00%
    4.69 :        4005a1:       mov    -0x18(%rbp),%rax
    0.00 :        4005a5:       and    $0x1,%eax
    0.00 :        4005a8:       test   %rax,%rax
    0.00 :        4005ab:       je     4005bf <branches+0x85>   # -100.00% (p:100.00%)
    0.00 :        4005ad:       mov    0x20067c(%rip),%rax        # 600c30 <acc>
    0.00 :        4005b4:       shr    $0x2,%rax
    0.00 :        4005b8:       mov    %rax,0x200671(%rip)        # 600c30 <acc>
    0.00 :        4005bf:       mov    -0x10(%rbp),%rax # +100.00%
   10.92 :        4005c3:       and    $0x1,%eax
    2.48 :        4005c6:       test   %rax,%rax
    0.00 :        4005c9:       jne    4005d2 <branches+0x98>   # -52.84% (p:41.95%)
    1.25 :        4005cb:       mov    $0x1,%eax
    8.93 :        4005d0:       jmp    4005d7 <branches+0x9d>   # -100.00% (p:100.00%)
    1.10 :        4005d2:       mov    $0x0,%eax        # +51.75%
    9.13 :        4005d7:       test   %al,%al  # +48.25%
    0.00 :        4005d9:       je     4005ef <branches+0xb5>   # -51.75% (p:100.00%)
    1.23 :        4005db:       mov    0x20064e(%rip),%rax        # 600c30 <acc>
    2.67 :        4005e2:       sub    $0x1,%rax
    0.68 :        4005e6:       mov    %rax,0x200643(%rip)        # 600c30 <acc>
    1.34 :        4005ed:       jmp    400601 <branches+0xc7>   # -100.00% (p:100.00%)
    1.79 :        4005ef:       mov    0x20063a(%rip),%rax        # 600c30 <acc>        # +49.95%
    2.18 :        4005f6:       add    $0x1,%rax
    0.61 :        4005fa:       mov    %rax,0x20062f(%rip)        # 600c30 <acc>
    0.66 :        400601:       mov    -0x10(%rbp),%rax # +50.05%
    1.11 :        400605:       mov    %rax,%rdi
    0.14 :        400608:       callq  4004e6 <lfsr>    # -100.00% (p:100.00%)
    0.00 :        40060d:       mov    %rax,-0x10(%rbp) # +100.00%
    5.03 :        400611:       addq   $0x1,-0x8(%rbp)
    0.00 :        400616:       mov    -0x8(%rbp),%rax
    0.00 :        40061a:       cmp    -0x20(%rbp),%rax
    0.00 :        40061e:       jb     40055f <branches+0x25>   # -100.00% (p:100.00%)
    0.00 :        400624:       nop
    0.00 :        400625:       leaveq
    0.00 :        400626:       retq
(Note: the --branch-filter u,any was used to avoid spurious target and branch points due to interrupts/faults, they show up as very small -/+ annotations on 'weird' locations)
---
 tools/perf/builtin-annotate.c |  103 +++++++++++++
 tools/perf/util/Build         |    1
 tools/perf/util/annotate.c    |   86 ++++++++++-
 tools/perf/util/block-range.c |  328 ++++++++++++++++++++++++++++++++++++++++++
 tools/perf/util/block-range.h |   71 +++++++++
 tools/perf/util/symbol.h      |    1
 6 files changed, 588 insertions(+), 2 deletions(-)
tools/perf/builtin-annotate.c +103 -0
@@ -30,6 +30,7 @@#include "util/tool.h" #include "util/data.h" #include "arch/common.h" +#include "util/block-range.h" #include <dlfcn.h> #include <linux/bitmap.h>
@@ -46,6 +47,102 @@ struct perf_annotate {DECLARE_BITMAP (cpu_bitmap,MAX_NR_CPUS ); }; +/* +* Given one basic block: +* +* from to branch_i +* * ----> * +* | +* | block +* v +* * ----> * +* from to branch_i+1 +* +* where the horizontal are the branches and the vertical is the executed +* block of instructions. +* +* We count, for each 'instruction', the number of blocks that covered it as +* well as count the ratio each branch is taken. +* +* We can do this without knowing the actual instruction stream by keeping +* track of the address ranges. We break down ranges such that there is no +* overlap and iterate from the start until the end. +* +* @acme: once we parse the objdump output _before_ processing the samples, +* we can easily fold the branch.cycles IPC bits in. +*/ +static void process_basic_block (struct addr_map_symbol *start, +struct addr_map_symbol *end, +struct branch_flags *flags) +{ +struct symbol *sym = start->sym; +struct block_range_iter iter; +struct block_range *entry; + +/* +* Sanity; NULL isn't executable and the CPU cannot execute backwards +*/ +if (!start->addr || start->addr > end->addr) +return ; + + iter =block_range__create (start->addr, end->addr); +if (!block_range_iter__valid (&iter)) +return ; + +/* +* First block in range is a branch target. +*/ + entry =block_range_iter (&iter); +assert (entry->is_target); + entry->entry++; + +do { + entry =block_range_iter (&iter); + + entry->coverage++; + entry->sym = sym; + +if (sym) + sym->max_coverage =max (sym->max_coverage, entry->coverage); + + }while (block_range_iter__next (&iter)); + +/* +* Last block in rage is a branch. +*/ + entry =block_range_iter (&iter); +assert (entry->is_branch); + entry->taken++; +if (flags->predicted) + entry->pred++; +} + +static void process_branch_stack (struct branch_stack *bs,struct addr_location *al, +struct perf_sample *sample) +{ +struct addr_map_symbol *prev =NULL ; +struct branch_info *bi; +int i; + +if (!bs || !bs->nr) +return ; + + bi =sample__resolve_bstack (sample, al); +if (!bi) +return ; + +for (i = bs->nr -1 ; i >=0 ; i--) { +/* +* XXX filter against symbol +*/ +if (prev) +process_basic_block (prev, &bi[i].from, &bi[i].flags); + prev = &bi[i].to; + } + +free (bi); +} + static int perf_evsel__add_sample(struct perf_evsel *evsel, struct perf_sample *sample, struct addr_location *al,
@@ -72,6 +169,12 @@ static int perf_evsel__add_sample(structreturn 0 ; } +/* +* XXX filtered samples can still have branch entires pointing into our +* symbol and are missed. +*/ +process_branch_stack (sample->branch_stack, al, sample); + sample->period =1 ; sample->weight =1 ;
tools/perf/util/Build +1 -0
@@ -1,5 +1,6 @@
 libperf-y += alias.o
 libperf-y += annotate.o
+libperf-y += block-range.o
 libperf-y += build-id.o
 libperf-y += config.o
 libperf-y += ctype.o
tools/perf/util/annotate.c +84 -2
110 lines not on this page · raw message
tools/perf/util/block-range.c new file +328 -0
328 lines not on this page · raw message
tools/perf/util/block-range.h new file +71 -0
71 lines not on this page · raw message
tools/perf/util/symbol.h +1 -0
@@ -55,6 +55,7 @@ struct symbol {struct rb_node rb_node;u64 start;u64 end; +u64 max_coverage;u16 namelen;u8 binding;bool ignore;
Re: [RFC][PATCH 7/7] perf/annotate: Add branch stack / basic block information
Quoted 2 lines · Peter Zijlstra
$ perf record --branch-filter u,any -e cycles:p ./branches 27
$ perf annotate branches
Btw., I'd really like to use this feature all the time, so could we please simplify this somewhat via a subcommand, via something like:
perf record branches ./branches 27
or if 'record' subcommands are not possible anymore:
perf record --branches ./branches 27
and in this case 'perf annotate' should automatically pick up the fact that the perf.data was done with --branches - i.e. the highlighting should be automagic.
I.e. the only thing a user has to remember to use all this is a single '--branches' option to perf record - instead of a complex sequence for perf record and another sequence for perf annotate.
It would also be nice to have 'perf top --branches', with the built-in annotation showing the highlighted branch heat map information and highlighting.
Thanks,
Ingo
Peter Zijlstra
maintainerRe: [RFC][PATCH 7/7] perf/annotate: Add branch stack / basic block information
Quoted 6 lines · Ingo Molnar
Quoted 2 lines · Peter Zijlstra
$ perf record --branch-filter u,any -e cycles:p ./branches 27
$ perf annotate branches
Quoted 8 lines
Btw., I'd really like to use this feature all the time, so could we please simplify this somewhat via a subcommand, via something like:
perf record branches ./branches 27
or if 'record' subcommands are not possible anymore:
perf record --branches ./branches 27
So: perf record -b $workload, is basically enough and 'works'.
Quoted 3 lines
and in this case 'perf annotate' should automatically pick up the fact that the perf.data was done with --branches - i.e. the highlighting should be automagic.
It does, or rather if the samples contain PERF_SAMPLE_BRANCH_STACK this all gets automagically done.
The reason I did '--branch-filter u,any' is because this example is a very tight loop that runs for many seconds and you get a fair number of interrupts in it.
These interrupts result in branch targets and branches that don't exist, and with such small code that really shows up.
For bigger code its not really an issue.
I've been thinking of filtering all targets and branches that are smaller than 0.1% in order to avoid this, but so far I've just been ignoring these things.
Peter Zijlstra
maintainerRe: [RFC][PATCH 7/7] perf/annotate: Add branch stack / basic block information
Quoted 3 lines · Peter Zijlstra
I've been thinking of filtering all targets and branches that are smaller than 0.1% in order to avoid this, but so far I've just been ignoring these things.
Like so... seems to 'work'.
---
 tools/perf/util/annotate.c | 45 ++++++++++++++++++++++++++-------------------
 1 file changed, 26 insertions(+), 19 deletions(-)
tools/perf/util/annotate.c +26 -19
@@ -907,6 +907,7 @@ static void annotate__branch_printf(struct block_range *br, u64 addr)#if 1 if (br->is_target && br->start == addr) {struct block_range *branch = br; +double p;/* * Find matching branch to our target.
@@ -914,31 +915,37 @@ static void annotate__branch_printf(struct block_range *br, u64 addr)while (!branch->is_branch) branch =block_range__next (branch); -if (emit_comment) { - emit_comment = false; -printf ("\t#" ); - } + p =100 *(double )br->entry / branch->coverage; -/* -* The percentage of coverage joined at this target in relation -* to the next branch. -*/ - printf(" +%.2f%%", 100*(double)br->entry / branch->coverage); +if (p >0.1 ) { +if (emit_comment) { + emit_comment = false; +printf ("\t#" ); + } + +/* +* The percentage of coverage joined at this target in relation +* to the next branch. +*/ +printf (" +%.2f%%" , p); + } }#endif if (br->is_branch && br->end == addr) { +double p =100 *(double )br->taken / br->coverage; -if (emit_comment) { - emit_comment = false; -printf ("\t#" ); - } +if (p >0.1 ) { +if (emit_comment) { + emit_comment = false; +printf ("\t#" ); + } -/* -* The percentage of coverage leaving at this branch, and -* its prediction ratio. -*/ -printf (" -%.2f%% / %.2f%%" ,100 *(double )br->taken / br->coverage, -100 *(double )br->pred / br->taken); +/* +* The percentage of coverage leaving at this branch, and +* its prediction ratio. +*/ +printf (" -%.2f%% (p:%.2f%%)" , p,100 *(double )br->pred / br->taken); + } } }
Arnaldo Carvalho de Melo
maintainerRe: [RFC][PATCH 7/7] perf/annotate: Add branch stack / basic block information
Em Fri, Jul 08, 2016 at 06:36:32PM +0200, Peter Zijlstra escreveu:
Quoted 7 lines · Peter Zijlstra
Quoted 4 lines
I've been thinking of filtering all targets and branches that are smaller than 0.1% in order to avoid this, but so far I've just been ignoring these things.
Like so... seems to 'work'.
So I merged this one with 7/7 and this is the result, screenshot to capture the colors:
http://vger.kernel.org/~acme/perf/annotate_basic_blocks.png
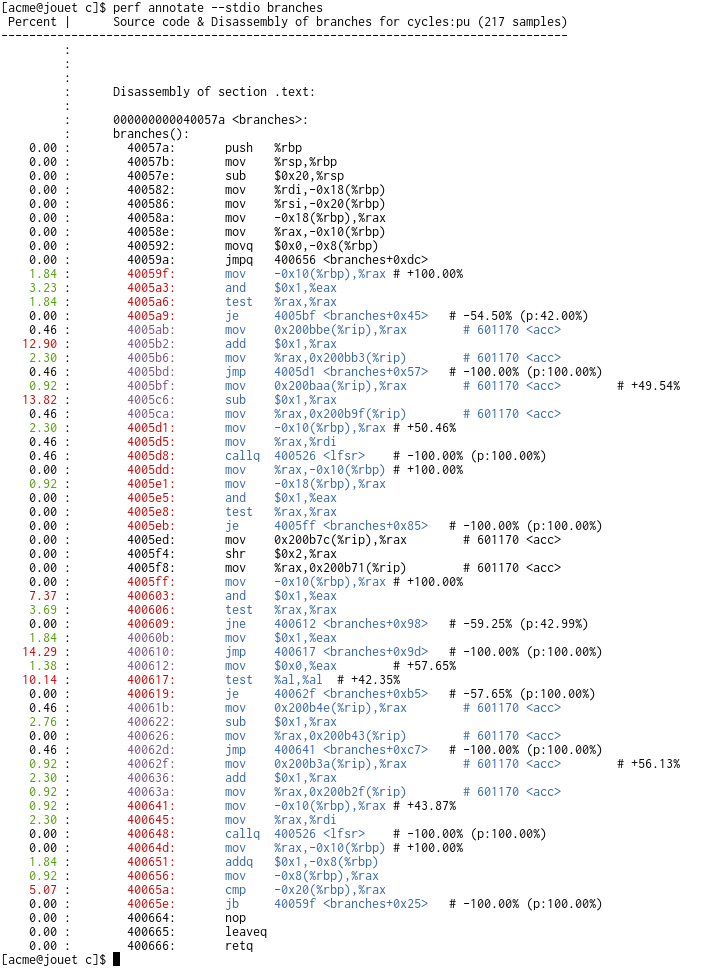
Please let me know if I should go ahead and push with the combined patch, that is now at:
git://git.kernel.org/pub/scm/linux/kernel/git/acme/linux.git perf/annotate_basic_blocks
Is that ok?
The problem with it is that it is done only for --stdio, I'll check how to properly make it UI agnostic...
- Arnaldo
Quoted 73 lines
---
 tools/perf/util/annotate.c | 45 ++++++++++++++++++++++++++-------------------
 1 file changed, 26 insertions(+), 19 deletions(-)
tools/perf/util/annotate.c +26
-19@@ -907,6 +907,7 @@ static void annotate__branch_printf(struct block_range *br, u64 addr)#if 1 if (br->is_target && br->start == addr) {struct block_range *branch = br; +double p;/* * Find matching branch to our target. @@ -914,31 +915,37 @@ static void annotate__branch_printf(struct block_range *br, u64 addr)while (!branch->is_branch) branch =block_range__next (branch); -if (emit_comment) { - emit_comment = false; -printf ("\t#" ); - } + p =100 *(double )br->entry / branch->coverage; -/* -* The percentage of coverage joined at this target in relation -* to the next branch. -*/ - printf(" +%.2f%%", 100*(double)br->entry / branch->coverage); +if (p >0.1 ) { +if (emit_comment) { + emit_comment = false; +printf ("\t#" ); + } + +/* +* The percentage of coverage joined at this target in relation +* to the next branch. +*/ +printf (" +%.2f%%" , p); + } }#endif if (br->is_branch && br->end == addr) { +double p =100 *(double )br->taken / br->coverage; -if (emit_comment) { - emit_comment = false; -printf ("\t#" ); - } +if (p >0.1 ) { +if (emit_comment) { + emit_comment = false; +printf ("\t#" ); + } -/* -* The percentage of coverage leaving at this branch, and -* its prediction ratio. -*/ -printf (" -%.2f%% / %.2f%%" ,100 *(double )br->taken / br->coverage, -100 *(double )br->pred / br->taken); +/* +* The percentage of coverage leaving at this branch, and +* its prediction ratio. +*/ +printf (" -%.2f%% (p:%.2f%%)" , p,100 *(double )br->pred / br->taken); + } } }
Peter Zijlstra
maintainerRe: [RFC][PATCH 7/7] perf/annotate: Add branch stack / basic block information
Quoted 17 lines · Arnaldo Carvalho de Melo
Em Fri, Jul 08, 2016 at 06:36:32PM +0200, Peter Zijlstra escreveu:
Quoted 7 lines · Peter Zijlstra
Quoted 4 lines
I've been thinking of filtering all targets and branches that are smaller than 0.1% in order to avoid this, but so far I've just been ignoring these things.
Like so... seems to 'work'.
So I merged this one with 7/7 and this is the result, screenshot to capture the colors:
http://vger.kernel.org/~acme/perf/annotate_basic_blocks.png
Please let me know if I should go ahead and push with the combined patch, that is now at:
Quoted 8 lines
git://git.kernel.org/pub/scm/linux/kernel/git/acme/linux.gitperf/annotate_basic_blocksIs that ok?
The problem with it is that it is done only for --stdio, I'll check how to properly make it UI agnostic...
Yep, much thanks!
Peter Zijlstra
maintainerRe: [RFC][PATCH 7/7] perf/annotate: Add branch stack / basic block information
Quoted 4 lines · Peter Zijlstra
Quoted 4 lines
Please let me know if I should go ahead and push with the combined patch, that is now at:
Uh, you seem to have lost block-range.h.
Arnaldo Carvalho de Melo
maintainerRe: [RFC][PATCH 7/7] perf/annotate: Add branch stack / basic block information
Em Thu, Sep 08, 2016 at 06:51:41PM +0200, Peter Zijlstra escreveu:
Quoted 7 lines · Peter Zijlstra
Quoted 4 lines
Quoted 4 lines
Please let me know if I should go ahead and push with the combined patch, that is now at:
Uh, you seem to have lost
block-range.h.
Yeah, 'make -C tools/perf build-test' also told me that, I fixed it already:
- Arnaldo
Re: [RFC][PATCH 7/7] perf/annotate: Add branch stack / basic block information
In reply to Arnaldo Carvalho de MeloHi,
Quoted 15 lines · Arnaldo Carvalho de Melo
Em Fri, Jul 08, 2016 at 06:36:32PM +0200, Peter Zijlstra escreveu:
Quoted 7 lines · Peter Zijlstra
Quoted 4 lines
I've been thinking of filtering all targets and branches that are smaller than 0.1% in order to avoid this, but so far I've just been ignoring these things.
Like so... seems to 'work'.
So I merged this one with 7/7 and this is the result, screenshot to capture the colors:
Quoted 9 lines
Please let me know if I should go ahead and push with the combined patch, that is now at:
git://git.kernel.org/pub/scm/linux/kernel/git/acme/linux.gitperf/annotate_basic_blocksIs that ok?
I like the idea and yes, branch stack can be used for this, but I have a hard time understanding the colored output.
What is the explanation for the color changes?
How do I interpret the percentages in the comments of the assembly:
-54.50% (p: 42%)
Why not have dedicated columns before the assembly with proper column headers?
As for the command line:
$ perf record -b my_workload
Will do it right, for both kernel and user by default.
If you want user level only, you can simply do:
$ perf record -b -e cycles:up my_workload
The branch stack inherit the priv level of the event automatically.
Quoted 80 lines
The problem with it is that it is done only for --stdio, I'll check how to properly make it UI agnostic...
- Arnaldo
Quoted 73 lines
---
 tools/perf/util/annotate.c | 45 ++++++++++++++++++++++++++-------------------
 1 file changed, 26 insertions(+), 19 deletions(-)
tools/perf/util/annotate.c +26
-19@@ -907,6 +907,7 @@ static void annotate__branch_printf(struct block_range *br, u64 addr)#if 1 if (br->is_target && br->start == addr) {struct block_range *branch = br; +double p;/* * Find matching branch to our target. @@ -914,31 +915,37 @@ static void annotate__branch_printf(struct block_range *br, u64 addr)while (!branch->is_branch) branch =block_range__next (branch); -if (emit_comment) { - emit_comment = false; -printf ("\t#" ); - } + p =100 *(double )br->entry / branch->coverage; -/* -* The percentage of coverage joined at this target in relation -* to the next branch. -*/ - printf(" +%.2f%%", 100*(double)br->entry / branch->coverage); +if (p >0.1 ) { +if (emit_comment) { + emit_comment = false; +printf ("\t#" ); + } + +/* +* The percentage of coverage joined at this target in relation +* to the next branch. +*/ +printf (" +%.2f%%" , p); + } }#endif if (br->is_branch && br->end == addr) { +double p =100 *(double )br->taken / br->coverage; -if (emit_comment) { - emit_comment = false; -printf ("\t#" ); - } +if (p >0.1 ) { +if (emit_comment) { + emit_comment = false; +printf ("\t#" ); + } -/* -* The percentage of coverage leaving at this branch, and -* its prediction ratio. -*/ -printf (" -%.2f%% / %.2f%%" ,100 *(double )br->taken / br->coverage, -100 *(double )br->pred / br->taken); +/* +* The percentage of coverage leaving at this branch, and +* its prediction ratio. +*/ +printf (" -%.2f%% (p:%.2f%%)" , p,100 *(double )br->pred / br->taken); + } } }
Re: [RFC][PATCH 7/7] perf/annotate: Add branch stack / basic block information
Quoted 26 lines · Stephane Eranian
Hi,
Quoted 22 lines · Arnaldo Carvalho de Melo
Em Fri, Jul 08, 2016 at 06:36:32PM +0200, Peter Zijlstra escreveu:
Quoted 7 lines · Peter Zijlstra
Quoted 4 lines
I've been thinking of filtering all targets and branches that are smaller than 0.1% in order to avoid this, but so far I've just been ignoring these things.
Like so... seems to 'work'.
So I merged this one with 7/7 and this is the result, screenshot to capture the colors:
http://vger.kernel.org/~acme/perf/annotate_basic_blocks.png
Please let me know if I should go ahead and push with the combined patch, that is now at:
git://git.kernel.org/pub/scm/linux/kernel/git/acme/linux.gitperf/annotate_basic_blocks
Quoted 8 lines
Quoted 2 lines
Is that ok?
I like the idea and yes, branch stack can be used for this, but I have a hard time understanding the colored output.
What is the explanation for the color changes?
How do I interpret the percentages in the comments of the assembly:
-54.50% (p: 42%)
Why not have dedicated columns before the assembly with proper column headers?
Yes columns with headers are better. Jin Yao has been looking at this and already has some patches.
-Andi
Arnaldo Carvalho de Melo
maintainerRe: [RFC][PATCH 7/7] perf/annotate: Add branch stack / basic block information
Em Thu, Sep 08, 2016 at 09:59:15AM -0700, Andi Kleen escreveu:
Quoted 36 lines · Stephane Eranian
Quoted 26 lines
Hi,
Quoted 22 lines · Arnaldo Carvalho de Melo
Em Fri, Jul 08, 2016 at 06:36:32PM +0200, Peter Zijlstra escreveu:
Quoted 7 lines · Peter Zijlstra
Quoted 4 lines
I've been thinking of filtering all targets and branches that are smaller than 0.1% in order to avoid this, but so far I've just been ignoring these things.
Like so... seems to 'work'.
So I merged this one with 7/7 and this is the result, screenshot to capture the colors:
http://vger.kernel.org/~acme/perf/annotate_basic_blocks.png
Please let me know if I should go ahead and push with the combined patch, that is now at:
git://git.kernel.org/pub/scm/linux/kernel/git/acme/linux.gitperf/annotate_basic_blocksQuoted 8 lines
Quoted 2 lines
Is that ok?
I like the idea and yes, branch stack can be used for this, but I have a hard time understanding the colored output.
What is the explanation for the color changes?
How do I interpret the percentages in the comments of the assembly:
-54.50% (p: 42%)
Why not have dedicated columns before the assembly with proper column headers?
Quoted 2 lines
Yes columns with headers are better. Jin Yao has been looking at this and already has some patches.
For --tui as well?
- Arnaldo
RE: [RFC][PATCH 7/7] perf/annotate: Add branch stack / basic block information
Hi,
The idea of my patch is a little bit different. It targets to associate the branch coverage percentage and branch mispredict rate with the source code then user can see them directly in perf annotate source code / assembly view.
The screenshot to show the branch%.
https://github.com/yaoj/perf/blob/master/2.png

The screenshot to show the mispredict rate.
https://github.com/yaoj/perf/blob/master/3.png

The --stdio mode is tested working well now and will do for --tui mode in next.
The internal review comments require the patch to keep the existing "Percent" column unchanged and add new columns "Branch%" and "Mispred%" if LBRs are recorded in perf.data. For example, following 3 columns will be shown at default if LBRs are in perf.data when executing perf annotate --stdio.
Percent | Branch% | Mispred% |
With this comment, the patch needs to be changed.
Please let me know what do you think for this patch and if I should go ahead.
Thanks
Jin Yao
-----Original Message-----
From: Arnaldo Carvalho de Melo [mailto:[email protected]]
Sent: Friday, September 9, 2016 1:11 AM
To: Andi Kleen <[email protected]>
Cc: Stephane Eranian <[email protected]>; Peter Zijlstra <[email protected]>; Ingo Molnar <[email protected]>; LKML <[email protected]>; Jiri Olsa <[email protected]>; Linus Torvalds <[email protected]>; David Carrillo-Cisneros <[email protected]>; Alexander Shishkin <[email protected]>; Namhyung Kim <[email protected]>; Liang, Kan <[email protected]>; Anshuman Khandual <[email protected]>; Jin, Yao <[email protected]>
Subject: Re: [RFC][PATCH 7/7] perf/annotate: Add branch stack / basic block information
Em Thu, Sep 08, 2016 at 09:59:15AM -0700, Andi Kleen escreveu:
Quoted 39 lines · Stephane Eranian
Quoted 29 lines
Hi,
Quoted 25 lines · Arnaldo Carvalho de Melo
Em Fri, Jul 08, 2016 at 06:36:32PM +0200, Peter Zijlstra escreveu:
Quoted 7 lines · Peter Zijlstra
Quoted 4 lines
I've been thinking of filtering all targets and branches that are smaller than 0.1% in order to avoid this, but so far I've just been ignoring these things.
Like so... seems to 'work'.
So I merged this one with 7/7 and this is the result, screenshot to capture the colors:
http://vger.kernel.org/~acme/perf/annotate_basic_blocks.png
Please let me know if I should go ahead and push with the combined patch, that is now at:
https://git.kernel.org/cgit/linux/kernel/git/acme/linux.git/commit
/?h=perf/annotate_basic_blocks&id=baf41a43fa439ac534d21e41882a7858d5cee1e5
git://git.kernel.org/pub/scm/linux/kernel/git/acme/linux.git
perf/annotate_basic_blocksQuoted 8 lines
Quoted 2 lines
Is that ok?
I like the idea and yes, branch stack can be used for this, but I have a hard time understanding the colored output.
What is the explanation for the color changes?
How do I interpret the percentages in the comments of the assembly:
-54.50% (p: 42%)
Why not have dedicated columns before the assembly with proper column headers?
Quoted 2 lines
Yes columns with headers are better. Jin Yao has been looking at this and already has some patches.
For --tui as well?
- Arnaldo
Peter Zijlstra
maintainerRe: [RFC][PATCH 7/7] perf/annotate: Add branch stack / basic block information
In reply to Stephane EranianQuoted 4 lines · Stephane Eranian
I like the idea and yes, branch stack can be used for this, but I have a hard time understanding the colored output.
What is the explanation for the color changes?
In general, or the changes acme made? I can only answer the first.
For code: NORMAL <1%, BLUE otherwise, quickly shows you the code in a function that's not ran at all. This quickly eliminated a big chunk of the function I was looking at at the time, since the benchmark in question simply didn't touch most of it.
For address: NORMAL <1%, RED > 75%, MAGENTA otherwise. Quickly shows the hottest blocks in a function. The 75% is a random number otherwise. Not sure if we can do better.
Quoted 2 lines
How do I interpret the percentages in the comments of the assembly:
-54.50% (p: 42%)
-54.50% is 54.40% of the coverage is leaving here, aka 54.40% take this branch. p: 42% mean the branch is predicted 42% of the time.
Similarly, +50.46% is a branch target and means that of all the times this instruction gets executed, 50.46% of those joined at this instruction.
Quoted 1 line
Why not have dedicated columns before the assembly with proper column headers?
I found it too noisy, you only want to annotate branch instructions and branch targets. Adding columns just adds a whole heap of whitespace (wasted screen-estate) on the left.
Something I did want to look at was attempting to align the # comments, but I never did bother.
But to each their own I suppose.