Subject: Introduce Data Access MONitor (DAMON)
Subsystems (8)
v24 cover Subject: Introduce Data Access MONitor (DAMON)
From: SeongJae Park <[email protected]>
Changes from Previous Version (v23)
===================================
- Wordsmith commit messages (Shakeel Butt)
- Call missed mmu_notifier_test_young() (Shakeel Butt)
- Add one 'Reviewed-by' tag for PG_Idle reuse patch (Shakeel Butt)
- Rename core code to be region-neutral (Shakeel Butt)
- Add missed null check of 'damon_new_region()' return value (Coverity SAST)
- Put pids in dbgfs error cases (Shakeel Butt)
- Move arbitrary target type support out of DAMON patchset series (Shakeel Butt)
- Move user space tool patch out of DAMON patchset series
- Update evaluation result with DAMOOS-tuned prcl schemes
Introduction
============
DAMON is a data access monitoring framework for the Linux kernel. The core mechanisms of DAMON called 'region based sampling' and 'adaptive regions adjustment' (refer to 'mechanisms.rst' in the 11th patch of this patchset for the detail) make it
- accurate (The monitored information is useful for DRAM level memory management. It might not appropriate for Cache-level accuracy, though.),
- light-weight (The monitoring overhead is low enough to be applied online while making no impact on the performance of the target workloads.), and
- scalable (the upper-bound of the instrumentation overhead is controllable regardless of the size of target workloads.).
Using this framework, therefore, several memory management mechanisms such as reclamation and THP can be optimized to aware real data access patterns. Experimental access pattern aware memory management optimization works that incurring high instrumentation overhead will be able to have another try.
Though DAMON is for kernel subsystems, it can be easily exposed to the user space by writing a DAMON-wrapper kernel subsystem. Then, user space users who have some special workloads will be able to write personalized tools or applications for deeper understanding and specialized optimizations of their systems.
Long-term Plan
--------------
DAMON is a part of a project called Data Access-aware Operating System (DAOS). As the name implies, I want to improve the performance and efficiency of systems using fine-grained data access patterns. The optimizations are for both kernel and user spaces. I will therefore modify or create kernel subsystems, export some of those to user space and implement user space library / tools. Below shows the layers and components for the project.
---------------------------------------------------------------------------
Primitives: PTE Accessed bit, PG_idle, rmap, (Intel CMT), ...
Framework: DAMON
Features: DAMOS, virtual addr, physical addr, ...
Applications: DAMON-debugfs, (DARC), ...
^^^^^^^^^^^^^^^^^^^^^^^ KERNEL SPACE ^^^^^^^^^^^^^^^^^^^^^^^^^^^^^^^^
Raw Interface: debugfs, (sysfs), (damonfs), tracepoints, (sys_damon), ...
vvvvvvvvvvvvvvvvvvvvvvv USER SPACE vvvvvvvvvvvvvvvvvvvvvvvvvvvvvvvv
Library: (libdamon), ...
Tools: DAMO, (perf), ...
---------------------------------------------------------------------------
The components in parentheses or marked as '...' are not implemented yet but in the future plan. IOW, those are the TODO tasks of DAOS project. For more detail, please refer to the plans:
https://lore.kernel.org/linux-mm/[email protected]/
Evaluations
===========
We evaluated DAMON's overhead, monitoring quality and usefulness using 24 realistic workloads on my QEMU/KVM based virtual machine running a kernel that v24 DAMON patchset is applied.
DAMON is lightweight. It increases system memory usage by 0.39% and slows target workloads down by 1.16%.
DAMON is accurate and useful for memory management optimizations. An experimental DAMON-based operation scheme for THP, namely 'ethp', removes 76.15% of THP memory overheads while preserving 51.25% of THP speedup. Another experimental DAMON-based 'proactive reclamation' implementation, 'prcl', reduces 93.38% of residential sets and 23.63% of system memory footprint while incurring only 1.22% runtime overhead in the best case (parsec3/freqmine).
NOTE that the experimental THP optimization and proactive reclamation are not for production but only for proof of concepts.
Please refer to the official document[1] or "Documentation/admin-guide/mm: Add a document for DAMON" patch in this patchset for detailed evaluation setup and results.
[1] https://damonitor.github.io/doc/html/latest-damon/admin-guide/mm/damon/eval.html
Real-world User Story
=====================
In summary, DAMON has used on production systems and proved its usefulness.
DAMON as a profiler
-------------------
We analyzed characteristics of a large scale production systems of our customers using DAMON. The systems utilize 70GB DRAM and 36 CPUs. From this, we were able to find interesting things below.
There were obviously different access pattern under idle workload and active workload. Under the idle workload, it accessed large memory regions with low frequency, while the active workload accessed small memory regions with high freuqnecy.
DAMON found a 7GB memory region that showing obviously high access frequency under the active workload. We believe this is the performance-effective working set and need to be protected.
There was a 4KB memory region that showing highest access frequency under not only active but also idle workloads. We think this must be a hottest code section like thing that should never be paged out.
For this analysis, DAMON used only 0.3-1% of single CPU time. Because we used recording-based analysis, it consumed about 3-12 MB of disk space per 20 minutes. This is only small amount of disk space, but we can further reduce the disk usage by using non-recording-based DAMON features. I'd like to argue that only DAMON can do such detailed analysis (finding 4KB highest region in 70GB memory) with the light overhead.
DAMON as a system optimization tool
-----------------------------------
We also found below potential performance problems on the systems and made DAMON-based solutions.
The system doesn't want to make the workload suffer from the page reclamation and thus it utilizes enough DRAM but no swap device. However, we found the system is actively reclaiming file-backed pages, because the system has intensive file IO. The file IO turned out to be not performance critical for the workload, but the customer wanted to ensure performance critical file-backed pages like code section to not mistakenly be evicted.
Using direct IO should or mlock() would be a straightforward solution, but modifying the user space code is not easy for the customer. Alternatively, we could use DAMON-based operation scheme[1]. By using it, we can ask DAMON to track access frequency of each region and make 'process_madvise(MADV_WILLNEED)[2]' call for regions having specific size and access frequency for a time interval.
We also found the system is having high number of TLB misses. We tried 'always' THP enabled policy and it greatly reduced TLB misses, but the page reclamation also been more frequent due to the THP internal fragmentation caused memory bloat. We could try another DAMON-based operation scheme that applies 'MADV_HUGEPAGE' to memory regions having >=2MB size and high access frequency, while applying 'MADV_NOHUGEPAGE' to regions having <2MB size and low access frequency.
We do not own the systems so we only reported the analysis results and possible optimization solutions to the customers. The customers satisfied about the analysis results and promised to try the optimization guides.
[1] https://lore.kernel.org/linux-mm/[email protected]/
[2] https://lore.kernel.org/linux-api/[email protected]/
Comparison with Idle Page Tracking
==================================
Idle Page Tracking allows users to set and read idleness of pages using a bitmap file which represents each page with each bit of the file. One recommended usage of it is working set size detection. Users can do that by
1. find PFN of each page for workloads in interest,
2. set all the pages as idle by doing writes to the bitmap file,
3. wait until the workload accesses its working set, and
4. read the idleness of the pages again and count pages became not idle.
NOTE: While Idle Page Tracking is for user space users, DAMON is primarily designed for kernel subsystems though it can easily exposed to the user space. Hence, this section only assumes such user space use of DAMON.
For what use cases Idle Page Tracking would be better?
------------------------------------------------------
1. Flexible usecases other than hotness monitoring.
Because Idle Page Tracking allows users to control the primitive (Page idleness) by themselves, Idle Page Tracking users can do anything they want. Meanwhile, DAMON is primarily designed to monitor the hotness of each memory region. For this, DAMON asks users to provide sampling interval and aggregation interval. For the reason, there could be some use case that using Idle Page Tracking is simpler.
2. Physical memory monitoring.
Idle Page Tracking receives PFN range as input, so natively supports physical memory monitoring.
DAMON is designed to be extensible for multiple address spaces and use cases by implementing and using primitives for the given use case. Therefore, by theory, DAMON has no limitation in the type of target address space as long as primitives for the given address space exists. However, the default primitives introduced by this patchset supports only virtual address spaces.
Therefore, for physical memory monitoring, you should implement your own primitives and use it, or simply use Idle Page Tracking.
Nonetheless, RFC patchsets[1] for the physical memory address space primitives is already available. It also supports user memory same to Idle Page Tracking.
[1] https://lore.kernel.org/linux-mm/[email protected]/
For what use cases DAMON is better?
-----------------------------------
1. Hotness Monitoring.
Idle Page Tracking let users know only if a page frame is accessed or not. For hotness check, the user should write more code and use more memory. DAMON do that by itself.
2. Low Monitoring Overhead
DAMON receives user's monitoring request with one step and then provide the results. So, roughly speaking, DAMON require only O(1) user/kernel context switches.
In case of Idle Page Tracking, however, because the interface receives contiguous page frames, the number of user/kernel context switches increases as the monitoring target becomes complex and huge. As a result, the context switch overhead could be not negligible.
Moreover, DAMON is born to handle with the monitoring overhead. Because the core mechanism is pure logical, Idle Page Tracking users might be able to implement the mechanism on thier own, but it would be time consuming and the user/kernel context switching will still more frequent than that of DAMON. Also, the kernel subsystems cannot use the logic in this case.
3. Page granularity working set size detection.
Until v22 of this patchset, this was categorized as the thing Idle Page Tracking could do better, because DAMON basically maintains additional metadata for each of the monitoring target regions. So, in the page granularity working set size detection use case, DAMON would incur (number of monitoring target pages * size of metadata) memory overhead. Size of the single metadata item is about 54 bytes, so assuming 4KB pages, about 1.3% of monitoring target pages will be additionally used.
All essential metadata for Idle Page Tracking are embedded in 'struct page' and page table entries. Therefore, in this use case, only one counter variable for working set size accounting is required if Idle Page Tracking is used.
There are more details to consider, but roughly speaking, this is true in most cases.
However, the situation changed from v23. Now DAMON supports arbitrary types of monitoring targets, which don't use the metadata. Using that, DAMON can do the working set size detection with no additional space overhead but less user-kernel context switch. A first draft for the implementation of monitoring primitives for this usage is available in a DAMON development tree[1]. An RFC patchset for it based on this patchset will also be available soon.
From v24, the arbitrary type support is dropped from this patchset because this patchset doesn't introduce real use of the type. You can still get it from the DAMON development tree[2], though.
[1] https://github.com/sjp38/linux/tree/damon/pgidle_hack
[2] https://github.com/sjp38/linux/tree/damon/master
4. More future usecases
While Idle Page Tracking has tight coupling with base primitives (PG_Idle and page table Accessed bits), DAMON is designed to be extensible for many use cases and address spaces. If you need some special address type or want to use special h/w access check primitives, you can write your own primitives for that and configure DAMON to use those. Therefore, if your use case could be changed a lot in future, using DAMON could be better.
Can I use both Idle Page Tracking and DAMON?
--------------------------------------------
Yes, though using them concurrently for overlapping memory regions could result in interference to each other. Nevertheless, such use case would be rare or makes no sense at all. Even in the case, the noise would bot be really significant. So, you can choose whatever you want depending on the characteristics of your use cases.
More Information
================
We prepared a showcase web site[1] that you can get more information. There are
- the official documentations[2],
- the heatmap format dynamic access pattern of various realistic workloads for heap area[3], mmap()-ed area[4], and stack[5] area,
- the dynamic working set size distribution[6] and chronological working set size changes[7], and
- the latest performance test results[8].
[1] https://damonitor.github.io/_index
[2] https://damonitor.github.io/doc/html/latest-damon
[3] https://damonitor.github.io/test/result/visual/latest/rec.heatmap.0.png.html
[4] https://damonitor.github.io/test/result/visual/latest/rec.heatmap.1.png.html
[5] https://damonitor.github.io/test/result/visual/latest/rec.heatmap.2.png.html
[6] https://damonitor.github.io/test/result/visual/latest/rec.wss_sz.png.html
[7] https://damonitor.github.io/test/result/visual/latest/rec.wss_time.png.html
[8] https://damonitor.github.io/test/result/perf/latest/html/index.html


Baseline and Complete Git Trees
===============================
The patches are based on the v5.10. You can also clone the complete git tree:
$ git clone git://github.com/sjp38/linux -b damon/patches/v24
The web is also available:
https://github.com/sjp38/linux/releases/tag/damon/patches/v24
There are a couple of trees for entire DAMON patchset series. It includes future features. The first one[1] contains the changes for latest release, while the other one[2] contains the changes for next release.
[1] https://github.com/sjp38/linux/tree/damon/master
[2] https://github.com/sjp38/linux/tree/damon/next
Sequence Of Patches
===================
First three patches implement the core logics of DAMON. The 1st patch introduces basic sampling based hotness monitoring for arbitrary types of targets. Following two patches implement the core mechanisms for control of overhead and accuracy, namely regions based sampling (patch 2) and adaptive regions adjustment (patch 3).
Now the essential parts of DAMON is complete, but it cannot work unless someone provides monitoring primitives for a specific use case. The following two patches make it just work for virtual address spaces monitoring. The 4th patch makes 'PG_idle' can be used by DAMON and the 5th patch implements the virtual memory address space specific monitoring primitives using page table Accessed bits and the 'PG_idle' page flag.
Now DAMON just works for virtual address space monitoring via the kernel space api. To let the user space users can use DAMON, following five patches add interfaces for them. The 6th patch adds a tracepoint for monitoring results. The 7th patch implements a DAMON application kernel module, namely damon-dbgfs, that simply wraps DAMON and exposes DAMON interface to the user space via the debugfs interface. To let the user space get the monitoring results more easily, the 8th patch implements a simple recording feature in 'damon-dbgfs'. The 9th patch further exports pid of monitoring thread (kdamond) to user space for easier cpu usage accounting, and the 10th patch makes the debugfs interface to support multiple contexts.
Three patches for maintainability follows. The 11th patch adds documentations for both the user space and the kernel space. The 12th patch provides unit tests (based on the kunit) while the 13th patch adds user space tests (based on the kselftest).
Finally, the last patch (14th) updates the MAINTAINERS file.
Patch History
=============
Changes from v23
(https://lore.kernel.org/linux-mm/[email protected]/)
- Wordsmith commit messages (Shakeel Butt)
- Call missed mmu_notifier_test_young() (Shakeel Butt)
- Add one 'Reviewed-by' tag for PG_Idle reuse patch (Shakeel Butt)
- Rename core code to be region-neutral (Shakeel Butt)
- Add missed null check of 'damon_new_region()' return value (Coverity SAST)
- Put pids in dbgfs error cases (Shakeel Butt)
- Move arbitrary target type support out of DAMON patchset series (Shakeel Butt)
- Move user space tool patch out of DAMON patchset series
- Update evaluation result with DAMOOS-tuned prcl schemes
Changes from v22
(https://lore.kernel.org/linux-mm/[email protected]/)
- Support arbitrary targets; now DAMON incurs only zero space overhead for page granularity idleness monitoring
- Reorder patches for easier review (Shakeel Butt)
- Introduce arbitrary targets with sampling first, then the overhead-accuracy control logic
- Introduce data structure manipulation functions when it really used.
- Call callbacks explicitly, without macro (Shakeel Butt)
- Rename DAMON_PRIMITIVES to DAMON_VADDR (Shakeel Butt)
- Remove 'page_idle_lock' patch (Shakeel Butt)
- Drop pidfd support in debugfs (Shakeel Butt)
Changes from v21
(https://lore.kernel.org/linux-doc/[email protected]/)
- Fix build warnings and errors (kernel test robot)
- Fix a memory leak (kmemleak)
- Respect KUNIT_ALL_TESTS
- Rebase on v5.9
- Update the evaluation results
Changes from v20
(https://lore.kernel.org/linux-mm/[email protected]/)
- s/snprintf()/scnprintf() (Marco Elver)
- Support multiple contexts for user space users (Shakeel Butt)
- Export pid of monitoring thread to user space (Shakeel Butt)
- Let coexistable with Idle Page Tracking
- Place three parts of DAMON (core, primitives, and dbgfs) in different files
Changes from v19
(https://lore.kernel.org/linux-mm/[email protected]/)
- Place 'CREATE_TRACE_POINTS' after '#include' statements (Steven Rostedt)
- Support large record file (Alkaid)
- Place 'put_pid()' of virtual monitoring targets in 'cleanup' callback
- Avoid conflict between concurrent DAMON users
- Update evaluation result document
Changes from v18
(https://lore.kernel.org/linux-mm/[email protected]/)
- Drop loadable module support (Mike Rapoport)
- Select PAGE_EXTENSION if !64BIT for 'set_page_young()'
- Take care of the MMU notification subscribers (Shakeel Butt)
- Substitute 'struct damon_task' with 'struct damon_target' for better abstract
- Use 'struct pid' instead of 'pid_t' as the target (Shakeel Butt)
- Support pidfd from the debugfs interface (Shakeel Butt)
- Fix typos (Greg Thelen)
- Properly isolate DAMON from other pmd/pte Accessed bit users (Greg Thelen)
- Rebase on v5.8
Changes from v17
(https://lore.kernel.org/linux-mm/[email protected]/)
- Reorganize the doc and remove png blobs (Mike Rapoport)
- Wordsmith mechnisms doc and commit messages
- tools/wss: Set default working set access frequency threshold
- Avoid race in damon deamon start
Changes from v16
(https://lore.kernel.org/linux-mm/[email protected]/)
- Wordsmith/cleanup the documentations and the code
- user space tool: Simplify the code and add wss option for reuse histogram
- recording: Check disablement condition properly
- recording: Force minimal recording buffer size (1KB)
Changes from v15
(https://lore.kernel.org/linux-mm/[email protected]/)
- Refine commit messages (David Hildenbrand)
- Optimizes three vma regions search (Varad Gautam)
- Support static granularity monitoring (Shakeel Butt)
- Cleanup code and re-organize the sequence of patches
Please refer to the v15 patchset to get older history.
SeongJae Park (14):
mm: Introduce Data Access MONitor (DAMON)
mm/damon/core: Implement region-based sampling
mm/damon: Adaptively adjust regions mm/idle_page_tracking: Make PG_idle reusable
mm/damon: Implement primitives for the virtual memory address spaces mm/damon: Add a tracepoint
mm/damon: Implement a debugfs-based user space interface mm/damon/dbgfs: Implement recording feature mm/damon/dbgfs: Export kdamond pid to the user space mm/damon/dbgfs: Support multiple contexts
Documentation: Add documents for DAMON
mm/damon: Add kunit tests
mm/damon: Add user space selftests
MAINTAINERS: Update for DAMON
 Documentation/admin-guide/mm/damon/guide.rst  | 159 ++++
 Documentation/admin-guide/mm/damon/index.rst  |  15 +
 Documentation/admin-guide/mm/damon/plans.rst  |  29 +
 Documentation/admin-guide/mm/damon/start.rst  |  97 ++
 Documentation/admin-guide/mm/damon/usage.rst  | 304 ++++++
 Documentation/admin-guide/mm/index.rst        |   1 +
 Documentation/vm/damon/api.rst                |  20 +
 Documentation/vm/damon/design.rst             | 166 ++++
 Documentation/vm/damon/eval.rst               | 232 +++++
 Documentation/vm/damon/faq.rst                |  58 ++
 Documentation/vm/damon/index.rst              |  31 +
 Documentation/vm/index.rst                    |   1 +
 MAINTAINERS                                   |  12 +
 include/linux/damon.h                         | 265 ++++++
 include/linux/page-flags.h                    |   4 +-
 include/linux/page_ext.h                      |   2 +-
 include/linux/page_idle.h                     |   6 +-
 include/trace/events/damon.h                  |  43 +
 include/trace/events/mmflags.h                |   2 +-
 mm/Kconfig                                    |  10 +
 mm/Makefile                                   |   1 +
 mm/damon/Kconfig                              |  69 ++
 mm/damon/Makefile                             |   5 +
 mm/damon/core-test.h                          | 253 +++++
 mm/damon/core.c                               | 718 ++++++++++++++
 mm/damon/dbgfs-test.h                         | 214 +++++
 mm/damon/dbgfs.c                              | 888 ++++++++++++++++++
 mm/damon/vaddr-test.h                         | 328 +++++++
 mm/damon/vaddr.c                              | 586 ++++++++++++
 mm/page_ext.c                                 |  12 +-
 mm/page_idle.c                                |  10 -
 tools/testing/selftests/damon/Makefile        |   7 +
 .../selftests/damon/_chk_dependency.sh        |  28 +
 tools/testing/selftests/damon/_chk_record.py  | 109 +++
 .../testing/selftests/damon/debugfs_attrs.sh  | 161 ++++
 .../testing/selftests/damon/debugfs_record.sh |  50 +
 36 files changed, 4878 insertions(+), 18 deletions(-)
 create mode 100644 Documentation/admin-guide/mm/damon/guide.rst
 create mode 100644 Documentation/admin-guide/mm/damon/index.rst
 create mode 100644 Documentation/admin-guide/mm/damon/plans.rst
 create mode 100644 Documentation/admin-guide/mm/damon/start.rst
 create mode 100644 Documentation/admin-guide/mm/damon/usage.rst
 create mode 100644 Documentation/vm/damon/api.rst
 create mode 100644 Documentation/vm/damon/design.rst
 create mode 100644 Documentation/vm/damon/eval.rst
 create mode 100644 Documentation/vm/damon/faq.rst
 create mode 100644 Documentation/vm/damon/index.rst
 create mode 100644 include/linux/damon.h
 create mode 100644 include/trace/events/damon.h
 create mode 100644 mm/damon/Kconfig
 create mode 100644 mm/damon/Makefile
 create mode 100644 mm/damon/core-test.h
 create mode 100644 mm/damon/core.c
 create mode 100644 mm/damon/dbgfs-test.h
 create mode 100644 mm/damon/dbgfs.c
 create mode 100644 mm/damon/vaddr-test.h
 create mode 100644 mm/damon/vaddr.c
 create mode 100644 tools/testing/selftests/damon/Makefile
 create mode 100644 tools/testing/selftests/damon/_chk_dependency.sh
 create mode 100644 tools/testing/selftests/damon/_chk_record.py
 create mode 100755 tools/testing/selftests/damon/debugfs_attrs.sh
 create mode 100755 tools/testing/selftests/damon/debugfs_record.sh
Signature · 1 line
2.17.1
PATCH v24 1/14 mm: Introduce Data Access MONitor (DAMON)
From: SeongJae Park <[email protected]>
DAMON is a data access monitoring framework for the Linux kernel. The core mechanisms of DAMON make it
- accurate (the monitoring output is useful enough for DRAM level performance-centric memory management; It might be inappropriate for CPU cache levels, though),
- light-weight (the monitoring overhead is normally low enough to be applied online), and
- scalable (the upper-bound of the overhead is in constant range regardless of the size of target workloads).
Using this framework, hence, we can easily write efficient kernel space data access monitoring applications. For example, the kernel's memory management mechanisms can make advanced decisions using this. Experimental data access aware optimization works that incurring high access monitoring overhead could again be implemented on top of this.
Due to its simple and flexible interface, providing user space interface would be also easy. Then, user space users who have some special workloads can write personalized applications for better understanding and optimizations of their workloads and systems.
---
Nevertheless, this commit is defining and implementing only basic access check part without the overhead-accuracy handling core logic. The basic access check is as below.
The output of DAMON says what memory regions are how frequently accessed for a given duration. The resolution of the access frequency is controlled by setting ``sampling interval`` and ``aggregation interval``. In detail, DAMON checks access to each page per ``sampling interval`` and aggregates the results. In other words, counts the number of the accesses to each region. After each ``aggregation interval`` passes, DAMON calls callback functions that previously registered by users so that users can read the aggregated results and then clears the results. This can be described in below simple pseudo-code::
init()
while monitoring_on:
for page in monitoring_target:
if accessed(page):
nr_accesses[page] += 1
if time() % aggregation_interval == 0:
for callback in user_registered_callbacks:
callback(monitoring_target, nr_accesses)
for page in monitoring_target:
nr_accesses[page] = 0
if time() % update_interval == 0:
update()
sleep(sampling interval)
The target regions constructed at the beginning of the monitoring and updated after each ``regions_update_interval``, because the target regions could be dynamically changed (e.g., mmap() or memory hotplug). The monitoring overhead of this mechanism will arbitrarily increase as the size of the target workload grows.
The basic monitoring primitives for actual access check and dynamic target regions construction aren't in the core part of DAMON. Instead, it allows users to implement their own primitives that are optimized for their use case and configure DAMON to use those. In other words, users cannot use current version of DAMON without some additional works.
Following commits will implement the core mechanisms for the overhead-accuracy control and default primitives implementations.
---
 include/linux/damon.h | 167 ++++++++++++++++++++++
 mm/Kconfig            |   2 +
 mm/Makefile           |   1 +
 mm/damon/Kconfig      |  15 ++
 mm/damon/Makefile     |   3 +
 mm/damon/core.c       | 318 ++++++++++++++++++++++++++++++++++++++++++
 6 files changed, 506 insertions(+)
 create mode 100644 include/linux/damon.h
 create mode 100644 mm/damon/Kconfig
 create mode 100644 mm/damon/Makefile
 create mode 100644 mm/damon/core.c
include/linux/damon.h new file +167 -0
@@ -0,0 +1,167 @@ +/* SPDX-License-Identifier: GPL-2.0 */ +/* +* DAMON api +* +* Author: SeongJae Park <[email protected]> +*/ + +#ifndef _DAMON_H_ +#define _DAMON_H_ + +#include <linux/mutex.h> +#include <linux/time64.h> +#include <linux/types.h> + +struct damon_ctx ; + +/** +* struct damon_primitive Monitoring primitives for given use cases. +* +* @init: Initialize primitive-internal data structures. +* @update: Update primitive-internal data structures. +* @prepare_access_checks: Prepare next access check of target regions. +* @check_accesses: Check the accesses to target regions. +* @reset_aggregated: Reset aggregated accesses monitoring results. +* @target_valid: Determine if the target is valid. +* @cleanup: Clean up the context. +* +* DAMON can be extended for various address spaces and usages. For this, +* users should register the low level primitives for their target address +* space and usecase via the &damon_ctx.primitive. Then, the monitoring thread +* (&damon_ctx.kdamond) calls @init and @prepare_access_checks before starting +* the monitoring, @update after each &damon_ctx.primitive_update_interval, and +* @check_accesses, @target_valid and @prepare_access_checks after each +* &damon_ctx.sample_interval. Finally, @reset_aggregated is called after each +* &damon_ctx.aggr_interval. +* +* @init should initialize primitive-internal data structures. For example, +* this could be used to construct proper monitoring target regions and link +* those to @damon_ctx.target. +* @update should update the primitive-internal data structures. For example, +* this could be used to update monitoring target regions for current status. +* @prepare_access_checks should manipulate the monitoring regions to be +* prepared for the next access check. +* @check_accesses should check the accesses to each region that made after the +* last preparation and update the number of observed accesses of each region. +* @reset_aggregated should reset the access monitoring results that aggregated +* by @check_accesses. +* @target_valid should check whether the target is still valid for the +* monitoring. +* @cleanup is called from @kdamond just before its termination. +*/ +struct damon_primitive { +void (*init)(struct damon_ctx *context); +void (*update)(struct damon_ctx *context); +void (*prepare_access_checks)(struct damon_ctx *context); +void (*check_accesses)(struct damon_ctx *context); +void (*reset_aggregated)(struct damon_ctx *context); +bool (*target_valid)(void *target); +void (*cleanup)(struct damon_ctx *context); +}; + +/* +* struct damon_callback Monitoring events notification callbacks. +* +* @before_start: Called before starting the monitoring. +* @after_sampling: Called after each sampling. +* @after_aggregation: Called after each aggregation. +* @before_terminate: Called before terminating the monitoring. +* @private: User private data. +* +* The monitoring thread (&damon_ctx.kdamond) calls @before_start and +* @before_terminate just before starting and finishing the monitoring, +* respectively. Therefore, those are good places for installing and cleaning +* @private. +* +* The monitoring thread calls @after_sampling and @after_aggregation for each +* of the sampling intervals and aggregation intervals, respectively. +* Therefore, users can safely access the monitoring results without additional +* protection. For the reason, users are recommended to use these callback for +* the accesses to the results. +* +* If any callback returns non-zero, monitoring stops. +*/ +struct damon_callback { +void *private; + +int (*before_start)(struct damon_ctx *context); +int (*after_sampling)(struct damon_ctx *context); +int (*after_aggregation)(struct damon_ctx *context); +int (*before_terminate)(struct damon_ctx *context); +}; + +/** +* struct damon_ctx - Represents a context for each monitoring. This is the +* main interface that allows users to set the attributes and get the results +* of the monitoring. +* +* @sample_interval: The time between access samplings. +* @aggr_interval: The time between monitor results aggregations. +* @primitive_update_interval: The time between monitoring primitive updates. +* +* For each @sample_interval, DAMON checks whether each region is accessed or +* not. It aggregates and keeps the access information (number of accesses to +* each region) for @aggr_interval time. DAMON also checks whether the target +* memory regions need update (e.g., by ``mmap()`` calls from the application, +* in case of virtual memory monitoring) and applies the changes for each +* @primitive_update_interval. All time intervals are in micro-seconds. +* Please refer to &struct damon_primitive and &struct damon_callback for more +* detail. +* +* @kdamond: Kernel thread who does the monitoring. +* @kdamond_stop: Notifies whether kdamond should stop. +* @kdamond_lock: Mutex for the synchronizations with @kdamond. +* +* For each monitoring context, one kernel thread for the monitoring is +* created. The pointer to the thread is stored in @kdamond. +* +* Once started, the monitoring thread runs until explicitly required to be +* terminated or every monitoring target is invalid. The validity of the +* targets is checked via the &damon_primitive.target_valid of @primitive. The +* termination can also be explicitly requested by writing non-zero to +* @kdamond_stop. The thread sets @kdamond to NULL when it terminates. +* Therefore, users can know whether the monitoring is ongoing or terminated by +* reading @kdamond. Reads and writes to @kdamond and @kdamond_stop from +* outside of the monitoring thread must be protected by @kdamond_lock. +* +* Note that the monitoring thread protects only @kdamond and @kdamond_stop via +* @kdamond_lock. Accesses to other fields must be protected by themselves. +* +* @primitive: Set of monitoring primitives for given use cases. +* @callback: Set of callbacks for monitoring events notifications. +* +* @target: Pointer to the user-defined monitoring target. +*/ +struct damon_ctx { +unsigned long sample_interval; +unsigned long aggr_interval; +unsigned long primitive_update_interval; + +/* private: internal use only */ +struct timespec64 last_aggregation; +struct timespec64 last_primitive_update; + +/* public: */ +struct task_struct *kdamond; +bool kdamond_stop; +struct mutex kdamond_lock; + +struct damon_primitive primitive; +struct damon_callback callback; + +void *target; +}; + +#ifdef CONFIG_DAMON + +struct damon_ctx *damon_new_ctx (void ); +void damon_destroy_ctx (struct damon_ctx *ctx); +int damon_set_attrs (struct damon_ctx *ctx,unsigned long sample_int, +unsigned long aggr_int,unsigned long primitive_upd_int); + +int damon_start (struct damon_ctx **ctxs,int nr_ctxs); +int damon_stop (struct damon_ctx **ctxs,int nr_ctxs); + +#endif /* CONFIG_DAMON */ + +#endif /* _DAMON_H */
mm/Kconfig +2 -0
@@ -859,4 +859,6 @@ config ARCH_HAS_HUGEPD config MAPPING_DIRTY_HELPERS bool +source "mm/damon/Kconfig" + endmenu
mm/Makefile +1 -0
@@ -120,3 +120,4 @@ obj-$(CONFIG_MEMFD_CREATE) += memfd.o obj-$(CONFIG_MAPPING_DIRTY_HELPERS) += mapping_dirty_helpers.o obj-$(CONFIG_PTDUMP_CORE) += ptdump.o obj-$(CONFIG_PAGE_REPORTING) += page_reporting.o +obj-$(CONFIG_DAMON) += damon/
mm/damon/Kconfig new file +15 -0
@@ -0,0 +1,15 @@ +# SPDX-License-Identifier: GPL-2.0-only + +menu "Data Access Monitoring" + +config DAMON + bool "DAMON: Data Access Monitoring Framework" + help + This builds a framework that allows kernel subsystems to monitor + access frequency of each memory region. The information can be useful + for performance-centric DRAM level memory management. + + See https://damonitor.github.io/doc/html/latest-damon/index.html for + more information. + +endmenu
mm/damon/Makefile new file +3 -0
@@ -0,0 +1,3 @@ +# SPDX-License-Identifier: GPL-2.0 + +obj-$(CONFIG_DAMON) := core.o
mm/damon/core.c new file +318 -0
318 lines not on this page · raw message
Signature · 1 line
2.17.1
PATCH v24 2/14 mm/damon/core: Implement region-based sampling
In reply to SeongJae ParkFrom: SeongJae Park <[email protected]>
To avoid the unbounded increase of the overhead, DAMON groups adjacent pages that are assumed to have the same access frequencies into a region. As long as the assumption (pages in a region have the same access frequencies) is kept, only one page in the region is required to be checked. Thus, for each ``sampling interval``,
1. the 'prepare_access_checks' primitive picks one page in each region,
2. waits for one ``sampling interval``,
3. checks whether the page is accessed meanwhile, and
4. increases the access count of the region if so.
Therefore, the monitoring overhead is controllable by adjusting the number of regions. DAMON allows both the underlying primitives and user callbacks to adjust regions for the trade-off. In other words, this commit makes DAMON to use not only time-based sampling but also space-based sampling.
This scheme, however, cannot preserve the quality of the output if the assumption is not guaranteed. Next commit will address this problem.
---
 include/linux/damon.h |  77 ++++++++++++++++++++++-
 mm/damon/core.c       | 143 ++++++++++++++++++++++++++++++++++++++++--
 2 files changed, 213 insertions(+), 7 deletions(-)
include/linux/damon.h +74 -3
@@ -12,6 +12,48 @@#include <linux/time64.h> #include <linux/types.h> +/** +* struct damon_addr_range - Represents an address region of [@start, @end). +* @start: Start address of the region (inclusive). +* @end: End address of the region (exclusive). +*/ +struct damon_addr_range { +unsigned long start; +unsigned long end; +}; + +/** +* struct damon_region - Represents a monitoring target region. +* @ar: The address range of the region. +* @sampling_addr: Address of the sample for the next access check. +* @nr_accesses: Access frequency of this region. +* @list: List head for siblings. +*/ +struct damon_region { +struct damon_addr_range ar; +unsigned long sampling_addr; +unsigned int nr_accesses; +struct list_head list; +}; + +/** +* struct damon_target - Represents a monitoring target. +* @id: Unique identifier for this target. +* @regions_list: Head of the monitoring target regions of this target. +* @list: List head for siblings. +* +* Each monitoring context could have multiple targets. For example, a context +* for virtual memory address spaces could have multiple target processes. The +* @id of each target should be unique among the targets of the context. For +* example, in the virtual address monitoring context, it could be a pidfd or +* an address of an mm_struct. +*/ +struct damon_target { +unsigned long id; +struct list_head regions_list; +struct list_head list; +}; +struct damon_ctx ;/**
@@ -36,7 +78,7 @@ struct damon_ctx;* * @init should initialize primitive-internal data structures. For example, * this could be used to construct proper monitoring target regions and link -* those to @damon_ctx.target. +* those to @damon_ctx.adaptive_targets. * @update should update the primitive-internal data structures. For example, * this could be used to update monitoring target regions for current status. * @prepare_access_checks should manipulate the monitoring regions to be
@@ -130,7 +172,7 @@ struct damon_callback {* @primitive: Set of monitoring primitives for given use cases. * @callback: Set of callbacks for monitoring events notifications. * -* @target: Pointer to the user-defined monitoring target. +* @region_targets: Head of monitoring targets (&damon_target) list. */ struct damon_ctx {unsigned long sample_interval;
@@ -149,11 +191,40 @@ struct damon_ctx {struct damon_primitive primitive;struct damon_callback callback; -void *target; +struct list_head region_targets; }; +#define damon_next_region (r) \ + (container_of(r->list.next, struct damon_region, list)) + +#define damon_prev_region (r) \ + (container_of(r->list.prev, struct damon_region, list)) + +#define damon_for_each_region (r, t) \ + list_for_each_entry(r, &t->regions_list, list) + +#define damon_for_each_region_safe (r, next, t) \ + list_for_each_entry_safe(r, next, &t->regions_list, list) + +#define damon_for_each_target (t, ctx) \ + list_for_each_entry(t, &(ctx)->region_targets, list) + +#define damon_for_each_target_safe (t, next, ctx) \ + list_for_each_entry_safe(t, next, &(ctx)->region_targets, list) +#ifdef CONFIG_DAMON +struct damon_region *damon_new_region (unsigned long start,unsigned long end); +inline void damon_insert_region (struct damon_region *r, +struct damon_region *prev,struct damon_region *next); +void damon_add_region (struct damon_region *r,struct damon_target *t); +void damon_destroy_region (struct damon_region *r); + +struct damon_target *damon_new_target (unsigned long id); +void damon_add_target (struct damon_ctx *ctx,struct damon_target *t); +void damon_free_target (struct damon_target *t); +void damon_destroy_target (struct damon_target *t); +struct damon_ctx *damon_new_ctx (void );void damon_destroy_ctx (struct damon_ctx *ctx); int damon_set_attrs(struct damon_ctx *ctx, unsigned long sample_int,
mm/damon/core.c +139 -4
197 lines not on this page · raw message
Signature · 1 line
2.17.1
PATCH v24 3/14 mm/damon: Adaptively adjust regions
In reply to SeongJae ParkFrom: SeongJae Park <[email protected]>
Even somehow the initial monitoring target regions are well constructed to fulfill the assumption (pages in same region have similar access frequencies), the data access pattern can be dynamically changed. This will result in low monitoring quality. To keep the assumption as much as possible, DAMON adaptively merges and splits each region based on their access frequency.
For each ``aggregation interval``, it compares the access frequencies of adjacent regions and merges those if the frequency difference is small. Then, after it reports and clears the aggregated access frequency of each region, it splits each region into two or three regions if the total number of regions will not exceed the user-specified maximum number of regions after the split.
In this way, DAMON provides its best-effort quality and minimal overhead while keeping the upper-bound overhead that users set.
---
 include/linux/damon.h |  23 +++--
 mm/damon/core.c       | 214 +++++++++++++++++++++++++++++++++++++++++-
 2 files changed, 227 insertions(+), 10 deletions(-)
include/linux/damon.h +17 -6
@@ -12,6 +12,9 @@#include <linux/time64.h> #include <linux/types.h> +/* Minimal region size. Every damon_region is aligned by this. */ +#define DAMON_MIN_REGION PAGE_SIZE +/** * struct damon_addr_range - Represents an address region of [@start, @end). * @start: Start address of the region (inclusive).
@@ -85,6 +88,8 @@ struct damon_ctx;* prepared for the next access check. * @check_accesses should check the accesses to each region that made after the * last preparation and update the number of observed accesses of each region. +* It should also return max number of observed accesses that made as a result +* of its update. The value will be used for regions adjustment threshold. * @reset_aggregated should reset the access monitoring results that aggregated * by @check_accesses. * @target_valid should check whether the target is still valid for the
@@ -95,7 +100,7 @@ struct damon_primitive {void (*init)(struct damon_ctx *context);void (*update)(struct damon_ctx *context);void (*prepare_access_checks)(struct damon_ctx *context); -void (*check_accesses)(struct damon_ctx *context); +unsigned int (*check_accesses)(struct damon_ctx *context);void (*reset_aggregated)(struct damon_ctx *context);bool (*target_valid)(void *target);void (*cleanup)(struct damon_ctx *context);
@@ -172,7 +177,9 @@ struct damon_callback {* @primitive: Set of monitoring primitives for given use cases. * @callback: Set of callbacks for monitoring events notifications. * -* @region_targets: Head of monitoring targets (&damon_target) list. +* @min_nr_regions: The minimum number of adaptive monitoring regions. +* @max_nr_regions: The maximum number of adaptive monitoring regions. +* @adaptive_targets: Head of monitoring targets (&damon_target) list. */ struct damon_ctx {unsigned long sample_interval;
@@ -191,7 +198,9 @@ struct damon_ctx {struct damon_primitive primitive;struct damon_callback callback; -struct list_head region_targets; +unsigned long min_nr_regions; +unsigned long max_nr_regions; +struct list_head adaptive_targets; };#define damon_next_region (r) \
@@ -207,10 +216,10 @@ struct damon_ctx { list_for_each_entry_safe(r, next, &t->regions_list, list)#define damon_for_each_target (t, ctx) \ - list_for_each_entry(t, &(ctx)->region_targets, list) + list_for_each_entry(t, &(ctx)->adaptive_targets, list)#define damon_for_each_target_safe (t, next, ctx) \ - list_for_each_entry_safe(t, next, &(ctx)->region_targets, list) + list_for_each_entry_safe(t, next, &(ctx)->adaptive_targets, list)#ifdef CONFIG_DAMON
@@ -224,11 +233,13 @@ struct damon_target *damon_new_target(unsigned long id);void damon_add_target (struct damon_ctx *ctx,struct damon_target *t);void damon_free_target (struct damon_target *t);void damon_destroy_target (struct damon_target *t); +unsigned int damon_nr_regions (struct damon_target *t);struct damon_ctx *damon_new_ctx (void );void damon_destroy_ctx (struct damon_ctx *ctx);int damon_set_attrs (struct damon_ctx *ctx,unsigned long sample_int, -unsigned long aggr_int,unsigned long primitive_upd_int); +unsigned long aggr_int,unsigned long primitive_upd_int, +unsigned long min_nr_reg,unsigned long max_nr_reg);int damon_start (struct damon_ctx **ctxs,int nr_ctxs);int damon_stop (struct damon_ctx **ctxs,int nr_ctxs);
mm/damon/core.c +210 -4
296 lines not on this page · raw message
Signature · 1 line
2.17.1
PATCH v24 4/14 mm/idle_page_tracking: Make PG_idle reusable
In reply to SeongJae ParkFrom: SeongJae Park <[email protected]>
PG_idle and PG_young allow the two PTE Accessed bit users, Idle Page Tracking and the reclaim logic concurrently work while don't interfere each other. That is, when they need to clear the Accessed bit, they set PG_young to represent the previous state of the bit, respectively. And when they need to read the bit, if the bit is cleared, they further read the PG_young to know whether the other has cleared the bit meanwhile or not.
We could add another page flag and extend the mechanism to use the flag if we need to add another concurrent PTE Accessed bit user subsystem. However, the space is limited. Meanwhile, if the new subsystem is mutually exclusive with IDLE_PAGE_TRACKING or interfering with it is not a real problem, it would be ok to simply reuse the PG_idle flag. However, it's impossible because the flags are dependent on IDLE_PAGE_TRACKING.
To allow such reuse of the flags, this commit separates the PG_young and PG_idle flag logic from IDLE_PAGE_TRACKING and introduces new kernel config, 'PAGE_IDLE_FLAG'. Hence, a new subsystem would be able to reuse PG_idle without depending on IDLE_PAGE_TRACKING.
In the next commit, DAMON's reference implementation of the virtual memory address space monitoring primitives will use it.
---
 include/linux/page-flags.h     |  4 ++--
 include/linux/page_ext.h       |  2 +-
 include/linux/page_idle.h      |  6 +++---
 include/trace/events/mmflags.h |  2 +-
 mm/Kconfig                     |  8 ++++++++
 mm/page_ext.c                  | 12 +++++++++++-
 mm/page_idle.c                 | 10 ----------
 7 files changed, 26 insertions(+), 18 deletions(-)
include/linux/page-flags.h +2 -2
@@ -132,7 +132,7 @@ enum pageflags {#ifdef CONFIG_MEMORY_FAILURE PG_hwpoison, /* hardware poisoned page. Don't touch */#endif -#if defined(CONFIG_IDLE_PAGE_TRACKING ) && defined(CONFIG_64BIT ) +#if defined(CONFIG_PAGE_IDLE_FLAG ) && defined(CONFIG_64BIT ) PG_young, PG_idle,#endif
@@ -437,7 +437,7 @@ PAGEFLAG_FALSE(HWPoison)#define __PG_HWPOISON 0#endif -#if defined(CONFIG_IDLE_PAGE_TRACKING ) && defined(CONFIG_64BIT ) +#if defined(CONFIG_PAGE_IDLE_FLAG ) && defined(CONFIG_64BIT ) TESTPAGEFLAG(Young, young, PF_ANY) SETPAGEFLAG(Young, young, PF_ANY)TESTCLEARFLAG (Young, young,PF_ANY )
include/linux/page_ext.h +1 -1
@@ -19,7 +19,7 @@ struct page_ext_operations {enum page_ext_flags {PAGE_EXT_OWNER ,PAGE_EXT_OWNER_ALLOCATED , -#if defined(CONFIG_IDLE_PAGE_TRACKING ) && !defined(CONFIG_64BIT ) +#if defined(CONFIG_PAGE_IDLE_FLAG ) && !defined(CONFIG_64BIT )PAGE_EXT_YOUNG ,PAGE_EXT_IDLE ,#endif
include/linux/page_idle.h +3 -3
@@ -6,7 +6,7 @@#include <linux/page-flags.h> #include <linux/page_ext.h> -#ifdef CONFIG_IDLE_PAGE_TRACKING +#ifdef CONFIG_PAGE_IDLE_FLAG #ifdef CONFIG_64BIT static inline bool page_is_young (struct page *page)
@@ -106,7 +106,7 @@ static inline void clear_page_idle(struct page *page) }#endif /* CONFIG_64BIT */ -#else /* !CONFIG_IDLE_PAGE_TRACKING */ +#else /* !CONFIG_PAGE_IDLE_FLAG */ static inline bool page_is_young (struct page *page) {
@@ -135,6 +135,6 @@ static inline void clear_page_idle(struct page *page)
 {
 }

-#endif /* CONFIG_IDLE_PAGE_TRACKING */
+#endif /* CONFIG_PAGE_IDLE_FLAG */

 #endif /* _LINUX_MM_PAGE_IDLE_H */
include/trace/events/mmflags.h +1 -1
@@ -73,7 +73,7 @@#define IF_HAVE_PG_HWPOISON (flag,string)#endif -#if defined(CONFIG_IDLE_PAGE_TRACKING ) && defined(CONFIG_64BIT ) +#if defined(CONFIG_PAGE_IDLE_FLAG ) && defined(CONFIG_64BIT )#define IF_HAVE_PG_IDLE (flag,string) ,{1UL << flag, string}#else #define IF_HAVE_PG_IDLE (flag,string)
mm/Kconfig +8 -0
@@ -749,10 +749,18 @@ config DEFERRED_STRUCT_PAGE_INIT lifetime of the system until these kthreads finish the initialisation. +config PAGE_IDLE_FLAG + bool "Add PG_idle and PG_young flags" + help + This feature adds PG_idle and PG_young flags in 'struct page'. PTE + Accessed bit writers can set the state of the bit in the flags to let + other PTE Accessed bit readers don't disturbed. + config IDLE_PAGE_TRACKING bool "Enable idle page tracking" depends on SYSFS && MMU select PAGE_EXTENSION if !64BIT + select PAGE_IDLE_FLAG help This feature allows to estimate the amount of user pages that have not been touched during a given period of time. This information can
mm/page_ext.c +11 -1
@@ -58,11 +58,21 @@* can utilize this callback to initialize the state of it correctly. */ +#if defined(CONFIG_PAGE_IDLE_FLAG ) && !defined(CONFIG_64BIT ) +static bool need_page_idle (void ) +{ +return true; +} +struct page_ext_operations page_idle_ops = { + .need = need_page_idle, +}; +#endif +static struct page_ext_operations *page_ext_ops[] = { #ifdef CONFIG_PAGE_OWNER &page_owner_ops, #endif -#if defined(CONFIG_IDLE_PAGE_TRACKING) && !defined(CONFIG_64BIT) +#if defined(CONFIG_PAGE_IDLE_FLAG) && !defined(CONFIG_64BIT) &page_idle_ops, #endif };
mm/page_idle.c +0 -10
@@ -211,16 +211,6 @@ static const struct attribute_group page_idle_attr_group = { .name = "page_idle", }; -#ifndef CONFIG_64BIT -static bool need_page_idle (void ) -{ -return true; -} -struct page_ext_operations page_idle_ops = { - .need = need_page_idle, -}; -#endif -static int __init page_idle_init (void ) {int err;
Signature · 1 line
2.17.1
PATCH v24 5/14 mm/damon: Implement primitives for the virtual memory address spaces
In reply to SeongJae ParkFrom: SeongJae Park <[email protected]>
This commit introduces a reference implementation of the address space specific low level primitives for the virtual address space, so that users of DAMON can easily monitor the data accesses on virtual address spaces of specific processes by simply configuring the implementation to be used by DAMON.
The low level primitives for the fundamental access monitoring are defined in two parts:
1. Identification of the monitoring target address range for the address space.
2. Access check of specific address range in the target space.
The reference implementation for the virtual address space does the works as below.
PTE Accessed-bit Based Access Check
-----------------------------------
The implementation uses PTE Accessed-bit for basic access checks. That is, it clears the bit for the next sampling target page and checks whether it is set again after one sampling period. This could disturb the reclaim logic. DAMON uses ``PG_idle`` and ``PG_young`` page flags to solve the conflict, as Idle page tracking does.
VMA-based Target Address Range Construction
-------------------------------------------
Only small parts in the super-huge virtual address space of the processes are mapped to physical memory and accessed. Thus, tracking the unmapped address regions is just wasteful. However, because DAMON can deal with some level of noise using the adaptive regions adjustment mechanism, tracking every mapping is not strictly required but could even incur a high overhead in some cases. That said, too huge unmapped areas inside the monitoring target should be removed to not take the time for the adaptive mechanism.
For the reason, this implementation converts the complex mappings to three distinct regions that cover every mapped area of the address space. Also, the two gaps between the three regions are the two biggest unmapped areas in the given address space. The two biggest unmapped areas would be the gap between the heap and the uppermost mmap()-ed region, and the gap between the lowermost mmap()-ed region and the stack in most of the cases. Because these gaps are exceptionally huge in usual address spaces, excluding these will be sufficient to make a reasonable trade-off. Below shows this in detail::
<heap>
<BIG UNMAPPED REGION 1>
<uppermost mmap()-ed region>
(small mmap()-ed regions and munmap()-ed regions) <lowermost mmap()-ed region>
<BIG UNMAPPED REGION 2>
<stack>
---
 include/linux/damon.h |  13 +
 mm/damon/Kconfig      |   9 +
 mm/damon/Makefile     |   1 +
 mm/damon/vaddr.c      | 579 ++++++++++++++++++++++++++++++++++++++++++
 4 files changed, 602 insertions(+)
 create mode 100644 mm/damon/vaddr.c
include/linux/damon.h +13 -0
@@ -246,4 +246,17 @@ int damon_stop(struct damon_ctx **ctxs, int nr_ctxs);#endif /* CONFIG_DAMON */ +#ifdef CONFIG_DAMON_VADDR + +/* Monitoring primitives for virtual memory address spaces */ +void damon_va_init (struct damon_ctx *ctx); +void damon_va_update (struct damon_ctx *ctx); +void damon_va_prepare_access_checks (struct damon_ctx *ctx); +unsigned int damon_va_check_accesses (struct damon_ctx *ctx); +bool damon_va_target_valid (void *t); +void damon_va_cleanup (struct damon_ctx *ctx); +void damon_va_set_primitives (struct damon_ctx *ctx); + +#endif /* CONFIG_DAMON_VADDR */ +#endif /* _DAMON_H */
mm/damon/Kconfig +9 -0
@@ -12,4 +12,13 @@ config DAMON See https://damonitor.github.io/doc/html/latest-damon/index.html for more information. +config DAMON_VADDR + bool "Data access monitoring primitives for virtual address spaces" + depends on DAMON && MMU + select PAGE_EXTENSION if !64BIT + select PAGE_IDLE_FLAG + help + This builds the default data access monitoring primitives for DAMON + that works for virtual address spaces. + endmenu
mm/damon/Makefile +1 -0
@@ -1,3 +1,4 @@ # SPDX-License-Identifier: GPL-2.0 obj-$(CONFIG_DAMON) := core.o +obj-$(CONFIG_DAMON_VADDR) += vaddr.o
mm/damon/vaddr.c new file +579 -0
579 lines not on this page · raw message
Signature · 1 line
2.17.1
PATCH v24 6/14 mm/damon: Add a tracepoint
In reply to SeongJae ParkFrom: SeongJae Park <[email protected]>
This commit adds a tracepoint for DAMON. It traces the monitoring results of each region for each aggregation interval. Using this, DAMON can easily integrated with tracepoints supporting tools such as perf.
---
 include/trace/events/damon.h | 43 ++++++++++++++++++++++++++++++++++++
 mm/damon/core.c              |  7 +++++-
 2 files changed, 49 insertions(+), 1 deletion(-)
 create mode 100644 include/trace/events/damon.h
include/trace/events/damon.h new file +43 -0
@@ -0,0 +1,43 @@ +/* SPDX-License-Identifier: GPL-2.0 */ +#undef TRACE_SYSTEM +#define TRACE_SYSTEM damon + +#if !defined(_TRACE_DAMON_H) || defined(TRACE_HEADER_MULTI_READ ) +#define _TRACE_DAMON_H + +#include <linux/damon.h> +#include <linux/types.h> +#include <linux/tracepoint.h> + +TRACE_EVENT (damon_aggregated, + + TP_PROTO(struct damon_target *t, struct damon_region *r, + unsigned int nr_regions), + +TP_ARGS (t, r, nr_regions), + +TP_STRUCT__entry ( + __field(unsigned long, target_id) + __field(unsigned int, nr_regions) + __field(unsigned long, start) + __field(unsigned long, end) + __field(unsigned int, nr_accesses) + ), + +TP_fast_assign ( + __entry->target_id = t->id; + __entry->nr_regions = nr_regions; + __entry->start = r->ar.start; + __entry->end = r->ar.end; + __entry->nr_accesses = r->nr_accesses; + ), + +TP_printk ("target_id=%lu nr_regions=%u %lu-%lu: %u" , + __entry->target_id, __entry->nr_regions, + __entry->start, __entry->end, __entry->nr_accesses) +); + +#endif /* _TRACE_DAMON_H */ + +/* This part must be outside protection */ +#include <trace/define_trace.h>
mm/damon/core.c +6 -1
@@ -13,6 +13,9 @@#include <linux/random.h> #include <linux/slab.h> +#define CREATE_TRACE_POINTS +#include <trace/events/damon.h> +/* Get a random number in [l, r) */ #define damon_rand (l, r) (l + prandom_u32_max(r - l))
@@ -388,8 +391,10 @@ static void kdamond_reset_aggregated(struct damon_ctx *c)damon_for_each_target (t, c) {struct damon_region *r; -damon_for_each_region (r, t) +damon_for_each_region (r, t) { +trace_damon_aggregated (t, r,damon_nr_regions (t)); r->nr_accesses =0 ; + } } }
Signature · 1 line
2.17.1
PATCH v24 7/14 mm/damon: Implement a debugfs-based user space interface
In reply to SeongJae ParkFrom: SeongJae Park <[email protected]>
DAMON is designed to be used by kernel space code such as the memory management subsystems, and therefore it provides only kernel space API. That said, letting the user space control DAMON could provide some benefits to them. For example, it will allow user space to analyze their specific workloads and make their own special optimizations.
For such cases, this commit implements a simple DAMON application kernel module, namely 'damon-dbgfs', which merely wraps the DAMON api and exports those to the user space via the debugfs.
'damon-dbgfs' exports three files, ``attrs``, ``target_ids``, and ``monitor_on`` under its debugfs directory, ``<debugfs>/damon/``.
Attributes
----------
Users can read and write the ``sampling interval``, ``aggregation interval``, ``regions update interval``, and min/max number of monitoring target regions by reading from and writing to the ``attrs`` file. For example, below commands set those values to 5 ms, 100 ms, 1,000 ms, 10, 1000 and check it again::
    # cd <debugfs>/damon
    # echo 5000 100000 1000000 10 1000 > attrs
    # cat attrs
    5000 100000 1000000 10 1000
Target IDs
----------
Some types of address spaces supports multiple monitoring target. For example, the virtual memory address spaces monitoring can have multiple processes as the monitoring targets. Users can set the targets by writing relevant id values of the targets to, and get the ids of the current targets by reading from the ``target_ids`` file. In case of the virtual address spaces monitoring, the values should be pids of the monitoring target processes. For example, below commands set processes having pids 42 and 4242 as the monitoring targets and check it again::
    # cd <debugfs>/damon
    # echo 42 4242 > target_ids
    # cat target_ids
    42 4242
Note that setting the target ids doesn't start the monitoring.
Turning On/Off
--------------
Setting the files as described above doesn't incur effect unless you explicitly start the monitoring. You can start, stop, and check the current status of the monitoring by writing to and reading from the ``monitor_on`` file. Writing ``on`` to the file starts the monitoring of the targets with the attributes. Writing ``off`` to the file stops those. DAMON also stops if every targets are invalidated (in case of the virtual memory monitoring, target processes are invalidated when terminated). Below example commands turn on, off, and check the status of DAMON::
    # cd <debugfs>/damon
    # echo on > monitor_on
    # echo off > monitor_on
    # cat monitor_on
    off
Please note that you cannot write to the above-mentioned debugfs files while the monitoring is turned on. If you write to the files while DAMON is running, an error code such as ``-EBUSY`` will be returned.
---
 include/linux/damon.h |   3 +
 mm/damon/Kconfig      |   9 +
 mm/damon/Makefile     |   1 +
 mm/damon/core.c       |  47 +++++
 mm/damon/dbgfs.c      | 387 ++++++++++++++++++++++++++++++++++++++++++
 5 files changed, 447 insertions(+)
 create mode 100644 mm/damon/dbgfs.c
include/linux/damon.h +3 -0
@@ -237,9 +237,12 @@ unsigned int damon_nr_regions(struct damon_target *t);struct damon_ctx *damon_new_ctx (void );void damon_destroy_ctx (struct damon_ctx *ctx); +int damon_set_targets (struct damon_ctx *ctx, +unsigned long *ids,ssize_t nr_ids);int damon_set_attrs (struct damon_ctx *ctx,unsigned long sample_int,unsigned long aggr_int,unsigned long primitive_upd_int,unsigned long min_nr_reg,unsigned long max_nr_reg); +int damon_nr_running_ctxs (void );int damon_start (struct damon_ctx **ctxs,int nr_ctxs);int damon_stop (struct damon_ctx **ctxs,int nr_ctxs);
mm/damon/Kconfig +9 -0
@@ -21,4 +21,13 @@ config DAMON_VADDR This builds the default data access monitoring primitives for DAMON that works for virtual address spaces. +config DAMON_DBGFS + bool "DAMON debugfs interface" + depends on DAMON_VADDR && DEBUG_FS + help + This builds the debugfs interface for DAMON. The user space admins + can use the interface for arbitrary data access monitoring. + + If unsure, say N. + endmenu
mm/damon/Makefile +1 -0
@@ -2,3 +2,4 @@ obj-$(CONFIG_DAMON) := core.o obj-$(CONFIG_DAMON_VADDR) += vaddr.o +obj-$(CONFIG_DAMON_DBGFS) += dbgfs.o
mm/damon/core.c +47 -0
59 lines not on this page · raw message
mm/damon/dbgfs.c new file +387 -0
387 lines not on this page · raw message
Signature · 1 line
2.17.1
Re: [PATCH v24 07/14] mm/damon: Implement a debugfs-based user space interface
Quoted 458 lines · SeongJae Park
From: SeongJae Park <[email protected]>
DAMON is designed to be used by kernel space code such as the memory management subsystems, and therefore it provides only kernel space API. That said, letting the user space control DAMON could provide some benefits to them. For example, it will allow user space to analyze their specific workloads and make their own special optimizations.
For such cases, this commit implements a simple DAMON application kernel module, namely 'damon-dbgfs', which merely wraps the DAMON api and exports those to the user space via the debugfs.
'damon-dbgfs' exports three files, ``attrs``, ``target_ids``, and ``monitor_on`` under its debugfs directory, ``<debugfs>/damon/``.
Attributes
----------Users can read and write the ``sampling interval``, ``aggregation interval``, ``regions update interval``, and min/max number of monitoring target regions by reading from and writing to the ``attrs`` file. For example, below commands set those values to 5 ms, 100 ms, 1,000 ms, 10, 1000 and check it again::
    # cd <debugfs>/damon
    # echo 5000 100000 1000000 10 1000 > attrs
    # cat attrs
    5000 100000 1000000 10 1000
Target IDs
----------Some types of address spaces supports multiple monitoring target. For example, the virtual memory address spaces monitoring can have multiple processes as the monitoring targets. Users can set the targets by writing relevant id values of the targets to, and get the ids of the current targets by reading from the ``target_ids`` file. In case of the virtual address spaces monitoring, the values should be pids of the monitoring target processes. For example, below commands set processes having pids 42 and 4242 as the monitoring targets and check it again::
    # cd <debugfs>/damon
    # echo 42 4242 > target_ids
    # cat target_ids
    42 4242
Note that setting the target ids doesn't start the monitoring.
Turning On/Off
--------------Setting the files as described above doesn't incur effect unless you explicitly start the monitoring. You can start, stop, and check the current status of the monitoring by writing to and reading from the ``monitor_on`` file. Writing ``on`` to the file starts the monitoring of the targets with the attributes. Writing ``off`` to the file stops those. DAMON also stops if every targets are invalidated (in case of the virtual memory monitoring, target processes are invalidated when terminated). Below example commands turn on, off, and check the status of DAMON::
    # cd <debugfs>/damon
    # echo on > monitor_on
    # echo off > monitor_on
    # cat monitor_on
    off
Please note that you cannot write to the above-mentioned debugfs files while the monitoring is turned on. If you write to the files while DAMON is running, an error code such as ``-EBUSY`` will be returned.
Signed-off-by SeongJae Park <[email protected]>Reviewed-by Leonard Foerster <[email protected]>--- include/linux/damon.h | 3 + mm/damon/Kconfig | 9 + mm/damon/Makefile | 1 + mm/damon/core.c | 47 +++++ mm/damon/dbgfs.c | 387 ++++++++++++++++++++++++++++++++++++++++++ 5 files changed, 447 insertions(+) create mode 100644 mm/damon/dbgfs.cinclude/linux/damon.h +3
-0@@ -237,9 +237,12 @@ unsigned int damon_nr_regions(struct damon_target *t);struct damon_ctx *damon_new_ctx (void );void damon_destroy_ctx (struct damon_ctx *ctx); +int damon_set_targets (struct damon_ctx *ctx, +unsigned long *ids,ssize_t nr_ids);int damon_set_attrs (struct damon_ctx *ctx,unsigned long sample_int,unsigned long aggr_int,unsigned long primitive_upd_int,unsigned long min_nr_reg,unsigned long max_nr_reg); +int damon_nr_running_ctxs (void );int damon_start (struct damon_ctx **ctxs,int nr_ctxs);int damon_stop (struct damon_ctx **ctxs,int nr_ctxs);mm/damon/Kconfig +9
-0@@ -21,4 +21,13 @@ config DAMON_VADDR This builds the default data access monitoring primitives for DAMON that works for virtual address spaces. +config DAMON_DBGFS + bool "DAMON debugfs interface" + depends on DAMON_VADDR && DEBUG_FS + help + This builds the debugfs interface for DAMON. The user space admins + can use the interface for arbitrary data access monitoring. + + If unsure, say N. + endmenumm/damon/Makefile +1
-0@@ -2,3 +2,4 @@ obj-$(CONFIG_DAMON) := core.o obj-$(CONFIG_DAMON_VADDR) += vaddr.o +obj-$(CONFIG_DAMON_DBGFS) += dbgfs.omm/damon/core.c +47
-0@@ -172,6 +172,39 @@ void damon_destroy_ctx(struct damon_ctx *ctx)kfree (ctx); } +/** +* damon_set_targets() - Set monitoring targets. +* @ctx: monitoring context +* @ids: array of target ids +* @nr_ids: number of entries in @ids +* +* This function should not be called while the kdamond is running. +* +* Return: 0 on success, negative error code otherwise. +*/ +int damon_set_targets (struct damon_ctx *ctx, +unsigned long *ids,ssize_t nr_ids) +{ +ssize_t i; +struct damon_target *t, *next; + +damon_destroy_targets (ctx); + +for (i =0 ; i < nr_ids; i++) { + t =damon_new_target (ids[i]); +if (!t) { +pr_err ("Failed to alloc damon_target\n" ); +/* The caller should do cleanup of the ids itself */ +damon_for_each_target_safe (t, next, ctx) +damon_destroy_target (t); +return -ENOMEM ; + } +damon_add_target (ctx, t); + } + +return 0 ; +} +/** * damon_set_attrs() - Set attributes for the monitoring. * @ctx: monitoring context @@ -210,6 +243,20 @@ int damon_set_attrs(struct damon_ctx *ctx, unsigned long sample_int,return 0 ; } +/** +* damon_nr_running_ctxs() - Return number of currently running contexts. +*/ +int damon_nr_running_ctxs (void ) +{ +int nr_ctxs; + +mutex_lock (&damon_lock); + nr_ctxs = nr_running_ctxs; +mutex_unlock (&damon_lock); + +return nr_ctxs; +} +/* Returns the size upper limit for each monitoring region */ static unsigned long damon_region_sz_limit (struct damon_ctx *ctx) {mm/damon/dbgfs.c new file +261
-0@@ -0,0 +1,387 @@ +// SPDX-License-Identifier: GPL-2.0 +/* +* DAMON Debugfs Interface +* +* Author: SeongJae Park <[email protected]> +*/ + +#define pr_fmt (fmt) "damon-dbgfs: " fmt + +#include <linux/damon.h> +#include <linux/debugfs.h> +#include <linux/file.h> +#include <linux/mm.h> +#include <linux/module.h> +#include <linux/page_idle.h> +#include <linux/slab.h> + +static struct damon_ctx **dbgfs_ctxs; +static int dbgfs_nr_ctxs; +static struct dentry **dbgfs_dirs; + +/* +* Returns non-empty string on success, negarive error code otherwise. +*/ +static char *user_input_str (const char __user *buf,size_t count,loff_t *ppos) +{ +char *kbuf; +ssize_t ret; + +/* We do not accept continuous write */ +if (*ppos) +return ERR_PTR (-EINVAL ); + + kbuf =kmalloc (count +1 ,GFP_KERNEL ); +if (!kbuf) +return ERR_PTR (-ENOMEM ); + + ret =simple_write_to_buffer (kbuf, count +1 , ppos, buf, count); +if (ret != count) { +kfree (kbuf); +return ERR_PTR (-EIO ); + } + kbuf[ret] ='\0' ; + +return kbuf; +} + +static ssize_t dbgfs_attrs_read (struct file *file, +char __user *buf,size_t count,loff_t *ppos) +{ +struct damon_ctx *ctx = file->private_data; +char kbuf[128 ]; +int ret; + +mutex_lock (&ctx->kdamond_lock); + ret =scnprintf (kbuf,ARRAY_SIZE (kbuf),"%lu %lu %lu %lu %lu\n" , + ctx->sample_interval, ctx->aggr_interval, + ctx->primitive_update_interval, ctx->min_nr_regions, + ctx->max_nr_regions); +mutex_unlock (&ctx->kdamond_lock); + +return simple_read_from_buffer (buf, count, ppos, kbuf, ret); +} + +static ssize_t dbgfs_attrs_write (struct file *file, +const char __user *buf,size_t count,loff_t *ppos) +{ +struct damon_ctx *ctx = file->private_data; +unsigned long s, a, r, minr, maxr; +char *kbuf; +ssize_t ret = count; +int err; + + kbuf =user_input_str (buf, count, ppos); +if (IS_ERR (kbuf)) +return PTR_ERR (kbuf); + +if (sscanf (kbuf,"%lu %lu %lu %lu %lu" , + &s, &a, &r, &minr, &maxr) !=5 ) { + ret = -EINVAL ; + goto out; + } + +mutex_lock (&ctx->kdamond_lock); +if (ctx->kdamond) { + ret = -EBUSY ; + goto unlock_out; + } + + err =damon_set_attrs (ctx, s, a, r, minr, maxr); +if (err) + ret = err; +unlock_out: +mutex_unlock (&ctx->kdamond_lock); +out: +kfree (kbuf); +return ret; +} + +#define targetid_is_pid (ctx) \ + (ctx->primitive.target_valid == damon_va_target_valid) + +static ssize_t sprint_target_ids (struct damon_ctx *ctx,char *buf,ssize_t len) +{ +struct damon_target *t; +unsigned long id; +int written =0 ; +int rc; + +damon_for_each_target (t, ctx) { + id = t->id; +if (targetid_is_pid (ctx)) +/* Show pid numbers to debugfs users */ + id = (unsigned long )pid_vnr ((struct pid *)id); + + rc =scnprintf (&buf[written], len - written,"%lu " , id); +if (!rc) +return -ENOMEM ; + written += rc; + } +if (written) + written -=1 ; + written +=scnprintf (&buf[written], len - written,"\n" ); +return written; +} + +static ssize_t dbgfs_target_ids_read (struct file *file, +char __user *buf,size_t count,loff_t *ppos) +{ +struct damon_ctx *ctx = file->private_data; +ssize_t len; +char ids_buf[320 ]; + +mutex_lock (&ctx->kdamond_lock); + len =sprint_target_ids (ctx, ids_buf,320 ); +mutex_unlock (&ctx->kdamond_lock); +if (len <0 ) +return len; + +return simple_read_from_buffer (buf, count, ppos, ids_buf, len); +} + +/* +* Converts a string into an array of unsigned long integers +* +* Returns an array of unsigned long integers if the conversion success, or +* NULL otherwise. +*/ +static unsigned long *str_to_target_ids (const char *str,ssize_t len, +ssize_t *nr_ids) +{ +unsigned long *ids; +const int max_nr_ids =32 ; +unsigned long id; +int pos =0 , parsed, ret; + + *nr_ids =0 ; + ids =kmalloc_array (max_nr_ids,sizeof (id),GFP_KERNEL ); +if (!ids) +return NULL ; +while (*nr_ids < max_nr_ids && pos < len) { + ret =sscanf (&str[pos],"%lu%n" , &id, &parsed); + pos += parsed; +if (ret !=1 ) +break ; + ids[*nr_ids] = id; + *nr_ids +=1 ; + } + +return ids; +} + +static void dbgfs_put_pids (unsigned long *ids,int nr_ids) +{ +int i; + +for (i =0 ; i < nr_ids; i++) +put_pid ((struct pid *)ids[i]); +} + +static ssize_t dbgfs_target_ids_write (struct file *file, +const char __user *buf,size_t count,loff_t *ppos) +{ +struct damon_ctx *ctx = file->private_data; +char *kbuf, *nrs; +unsigned long *targets; +ssize_t nr_targets; +ssize_t ret = count; +int i; +int err; + + kbuf =user_input_str (buf, count, ppos); +if (IS_ERR (kbuf)) +return PTR_ERR (kbuf); + + nrs = kbuf; + + targets =str_to_target_ids (nrs, ret, &nr_targets); +if (!targets) { + ret = -ENOMEM ; + goto out; + } + +if (targetid_is_pid (ctx)) { +for (i =0 ; i < nr_targets; i++) { + targets[i] = (unsigned long )find_get_pid ( + (int )targets[i]); +if (!targets[i]) { +dbgfs_put_pids (targets, i); + ret = -EINVAL ; + goto free_targets_out; + } + } + } + +mutex_lock (&ctx->kdamond_lock); +if (ctx->kdamond) { +if (targetid_is_pid (ctx)) +dbgfs_put_pids (targets, nr_targets); + ret = -EBUSY ; + goto unlock_out; + } + + err =damon_set_targets (ctx, targets, nr_targets); +if (err) { +if (targetid_is_pid (ctx)) +dbgfs_put_pids (targets, nr_targets); + ret = err; + } + +unlock_out: +mutex_unlock (&ctx->kdamond_lock); +free_targets_out: +kfree (targets); +out: +kfree (kbuf); +return ret; +} + +static int damon_dbgfs_open (struct inode *inode,struct file *file) +{ + file->private_data = inode->i_private; + +return nonseekable_open (inode, file); +} + +static const struct file_operations attrs_fops = { + .owner =THIS_MODULE , + .open = damon_dbgfs_open, + .read = dbgfs_attrs_read, + .write = dbgfs_attrs_write, +}; + +static const struct file_operations target_ids_fops = { + .owner =THIS_MODULE , + .open = damon_dbgfs_open, + .read = dbgfs_target_ids_read, + .write = dbgfs_target_ids_write, +}; + +static int dbgfs_fill_ctx_dir (struct dentry *dir,struct damon_ctx *ctx)
mm/damon/dbgfs.c line 271
Quoted 10 lines
mm/damon/dbgfs.c new file +10
-0+{ +const char *const file_names[] = {"attrs" ,"target_ids" }; +const struct file_operations *fops[] = {&attrs_fops, &target_ids_fops}; +int i; + +for (i =0 ; i <ARRAY_SIZE (file_names); i++) { +if (!debugfs_create_file (file_names[i],0600 , dir, + ctx, fops[i])) { +pr_err ("failed to create %s file\n" , file_names[i]); +return -ENOMEM ;
No need to check the return value of this function, just keep going and ignore it as there's nothing to do and kernel code should not do different things based on the output of any debugfs calls.
Also, this check is totally wrong and doesn't do what you think it is doing...
mm/damon/dbgfs.c line 348
Quoted 11 lines
mm/damon/dbgfs.c new file +11
-0+static int __init __damon_dbgfs_init (void ) +{ +struct dentry *dbgfs_root; +const char *const file_names[] = {"monitor_on" }; +const struct file_operations *fops[] = {&monitor_on_fops}; +int i; + + dbgfs_root =debugfs_create_dir ("damon" ,NULL ); +if (IS_ERR (dbgfs_root)) { +pr_err ("failed to create the dbgfs dir\n" ); +return PTR_ERR (dbgfs_root);
Again, no need to check anything, just pass the result of a debugfs call back into another one just fine.
mm/damon/dbgfs.c line 353
Quoted 5 lines
mm/damon/dbgfs.c new file +5
-0+ } + +for (i =0 ; i <ARRAY_SIZE (file_names); i++) { +if (!debugfs_create_file (file_names[i],0600 , dbgfs_root, +NULL , fops[i])) {
Again, this isn't checking what you think it is, so please don't do it.
thanks,
greg k-h
Re: [PATCH v24 07/14] mm/damon: Implement a debugfs-based user space interface
Quoted 15 lines · On Fri, 5 Feb 2021 16:29:41 +0100 Greg KH <[email protected]> wrote:
Quoted 14 lines · SeongJae Park
From: SeongJae Park <[email protected]>
DAMON is designed to be used by kernel space code such as the memory management subsystems, and therefore it provides only kernel space API. That said, letting the user space control DAMON could provide some benefits to them. For example, it will allow user space to analyze their specific workloads and make their own special optimizations.
For such cases, this commit implements a simple DAMON application kernel module, namely 'damon-dbgfs', which merely wraps the DAMON api and exports those to the user space via the debugfs.
'damon-dbgfs' exports three files, ``attrs``, ``target_ids``, and ``monitor_on`` under its debugfs directory, ``<debugfs>/damon/``.
[...]
Quoted 8 lines
Quoted 8 lines
---
 include/linux/damon.h |   3 +
 mm/damon/Kconfig      |   9 +
 mm/damon/Makefile     |   1 +
 mm/damon/core.c       |  47 +++++
 mm/damon/dbgfs.c      | 387 ++++++++++++++++++++++++++++++++++++++++++
 5 files changed, 447 insertions(+)
 create mode 100644 mm/damon/dbgfs.c
[...]
Quoted 5 lines
Quoted 5 lines
mm/damon/dbgfs.c new file +0
-0
[...]
Quoted 17 lines
mm/damon/dbgfs.c line 271
Quoted 12 lines
mm/damon/dbgfs.c new file +12
-0+ +static int dbgfs_fill_ctx_dir (struct dentry *dir,struct damon_ctx *ctx) +{ +const char *const file_names[] = {"attrs" ,"target_ids" }; +const struct file_operations *fops[] = {&attrs_fops, &target_ids_fops}; +int i; + +for (i =0 ; i <ARRAY_SIZE (file_names); i++) { +if (!debugfs_create_file (file_names[i],0600 , dir, + ctx, fops[i])) { +pr_err ("failed to create %s file\n" , file_names[i]); +return -ENOMEM ;No need to check the return value of this function, just keep going and ignore it as there's nothing to do and kernel code should not do different things based on the output of any debugfs calls.
Quoted 2 lines
Also, this check is totally wrong and doesn't do what you think it is doing...
Ok, I will drop the check.
Quoted 15 lines
mm/damon/dbgfs.c line 348
Quoted 12 lines
mm/damon/dbgfs.c new file +11
-0+static int __init __damon_dbgfs_init (void ) +{ +struct dentry *dbgfs_root; +const char *const file_names[] = {"monitor_on" }; +const struct file_operations *fops[] = {&monitor_on_fops}; +int i; + + dbgfs_root =debugfs_create_dir ("damon" ,NULL ); +if (IS_ERR (dbgfs_root)) { +pr_err ("failed to create the dbgfs dir\n" ); +return PTR_ERR (dbgfs_root);Again, no need to check anything, just pass the result of a debugfs call back into another one just fine.
Ok.
Quoted 8 lines
mm/damon/dbgfs.c line 353
Quoted 6 lines
mm/damon/dbgfs.c new file +5
-0+ } + +for (i =0 ; i <ARRAY_SIZE (file_names); i++) { +if (!debugfs_create_file (file_names[i],0600 , dbgfs_root, +NULL , fops[i])) {Again, this isn't checking what you think it is, so please don't do it.
Got it.
I will fix those as you suggested in the next version.
Thanks,
SeongJae Park
Quoted 4 lines
thanks,
greg k-h
PATCH v24 8/14 mm/damon/dbgfs: Implement recording feature
In reply to SeongJae ParkFrom: SeongJae Park <[email protected]>
The user space users can control DAMON and get the monitoring results via the 'damon_aggregated' tracepoint event. However, dealing with the tracepoint might be complex for some simple use cases. This commit therefore implements 'recording' feature in 'damon-dbgfs'. The feature can be used via 'record' file in the '<debugfs>/damon/' directory.
The file allows users to record monitored access patterns in a regular binary file. The recorded results are first written in an in-memory buffer and flushed to a file in batch. Users can get and set the size of the buffer and the path to the result file by reading from and writing to the ``record`` file. For example, below commands set the buffer to be 4 KiB and the result to be saved in ``/damon.data``. ::
    # cd <debugfs>/damon
    # echo "4096 /damon.data" > record
    # cat record
    4096 /damon.data
The recording can be disabled by setting the buffer size zero.
---
 mm/damon/dbgfs.c | 261 ++++++++++++++++++++++++++++++++++++++++++++++-
 1 file changed, 259 insertions(+), 2 deletions(-)
mm/damon/dbgfs.c +259 -2
@@ -15,6 +15,17 @@#include <linux/page_idle.h> #include <linux/slab.h> +#define MIN_RECORD_BUFFER_LEN 1024 +#define MAX_RECORD_BUFFER_LEN (4 * 1024 * 1024) +#define MAX_RFILE_PATH_LEN 256 + +struct dbgfs_recorder { +unsigned char *rbuf; +unsigned int rbuf_len; +unsigned int rbuf_offset; +char *rfile_path; +}; +static struct damon_ctx **dbgfs_ctxs;static int dbgfs_nr_ctxs;static struct dentry **dbgfs_dirs;
@@ -97,6 +108,116 @@ static ssize_t dbgfs_attrs_write(struct file *file,return ret; } +static ssize_t dbgfs_record_read (struct file *file, +char __user *buf,size_t count,loff_t *ppos) +{ +struct damon_ctx *ctx = file->private_data; +struct dbgfs_recorder *rec = ctx->callback.private; +char record_buf[20 +MAX_RFILE_PATH_LEN ]; +int ret; + +mutex_lock (&ctx->kdamond_lock); + ret =scnprintf (record_buf,ARRAY_SIZE (record_buf),"%u %s\n" , + rec->rbuf_len, rec->rfile_path); +mutex_unlock (&ctx->kdamond_lock); +return simple_read_from_buffer (buf, count, ppos, record_buf, ret); +} + +/* +* dbgfs_set_recording() - Set attributes for the recording. +* @ctx: target kdamond context +* @rbuf_len: length of the result buffer +* @rfile_path: path to the monitor result files +* +* Setting 'rbuf_len' 0 disables recording. +* +* This function should not be called while the kdamond is running. +* +* Return: 0 on success, negative error code otherwise. +*/ +static int dbgfs_set_recording (struct damon_ctx *ctx, +unsigned int rbuf_len,char *rfile_path) +{ +struct dbgfs_recorder *recorder; +size_t rfile_path_len; + +if (rbuf_len && (rbuf_len >MAX_RECORD_BUFFER_LEN || + rbuf_len <MIN_RECORD_BUFFER_LEN )) { +pr_err ("result buffer size (%u) is out of [%d,%d]\n" , + rbuf_len,MIN_RECORD_BUFFER_LEN , +MAX_RECORD_BUFFER_LEN ); +return -EINVAL ; + } + rfile_path_len =strnlen (rfile_path,MAX_RFILE_PATH_LEN ); +if (rfile_path_len >=MAX_RFILE_PATH_LEN ) { +pr_err ("too long (>%d) result file path %s\n" , +MAX_RFILE_PATH_LEN , rfile_path); +return -EINVAL ; + } + + recorder = ctx->callback.private; +if (!recorder) { + recorder =kzalloc (sizeof (*recorder),GFP_KERNEL ); +if (!recorder) +return -ENOMEM ; + ctx->callback.private = recorder; + } + + recorder->rbuf_len = rbuf_len; +kfree (recorder->rbuf); + recorder->rbuf =NULL ; +kfree (recorder->rfile_path); + recorder->rfile_path =NULL ; + +if (rbuf_len) { + recorder->rbuf =kvmalloc (rbuf_len,GFP_KERNEL ); +if (!recorder->rbuf) +return -ENOMEM ; + } + recorder->rfile_path =kmalloc (rfile_path_len +1 ,GFP_KERNEL ); +if (!recorder->rfile_path) +return -ENOMEM ; +strncpy (recorder->rfile_path, rfile_path, rfile_path_len +1 ); + +return 0 ; +} + +static ssize_t dbgfs_record_write (struct file *file, +const char __user *buf,size_t count,loff_t *ppos) +{ +struct damon_ctx *ctx = file->private_data; +char *kbuf; +unsigned int rbuf_len; +char rfile_path[MAX_RFILE_PATH_LEN ]; +ssize_t ret = count; +int err; + + kbuf =user_input_str (buf, count, ppos); +if (IS_ERR (kbuf)) +return PTR_ERR (kbuf); + +if (sscanf (kbuf,"%u %s" , + &rbuf_len, rfile_path) !=2 ) { + ret = -EINVAL ; + goto out; + } + +mutex_lock (&ctx->kdamond_lock); +if (ctx->kdamond) { + ret = -EBUSY ; + goto unlock_out; + } + + err =dbgfs_set_recording (ctx, rbuf_len, rfile_path); +if (err) + ret = err; +unlock_out: +mutex_unlock (&ctx->kdamond_lock); +out: +kfree (kbuf); +return ret; +} +#define targetid_is_pid (ctx) \ (ctx->primitive.target_valid == damon_va_target_valid)
@@ -251,6 +372,13 @@ static const struct file_operations attrs_fops = { .write = dbgfs_attrs_write, }; +static const struct file_operations record_fops = { + .owner =THIS_MODULE , + .open = damon_dbgfs_open, + .read = dbgfs_record_read, + .write = dbgfs_record_write, +}; +static const struct file_operations target_ids_fops = { .owner =THIS_MODULE , .open = damon_dbgfs_open,
@@ -260,8 +388,9 @@ static const struct file_operations target_ids_fops = {static int dbgfs_fill_ctx_dir (struct dentry *dir,struct damon_ctx *ctx) { -const char *const file_names[] = {"attrs" ,"target_ids" }; -const struct file_operations *fops[] = {&attrs_fops, &target_ids_fops}; +const char *const file_names[] = {"attrs" ,"record" ,"target_ids" }; +const struct file_operations *fops[] = {&attrs_fops, &record_fops, + &target_ids_fops};int i;for (i =0 ; i <ARRAY_SIZE (file_names); i++) {
@@ -275,6 +404,126 @@ static int dbgfs_fill_ctx_dir(struct dentry *dir, struct damon_ctx *ctx)return 0 ; } +/* +* Flush the content in the result buffer to the result file +*/ +static void dbgfs_flush_rbuffer (struct dbgfs_recorder *rec) +{ +ssize_t sz; +loff_t pos =0 ; +struct file *rfile; + +if (!rec->rbuf_offset) +return ; + + rfile =filp_open (rec->rfile_path, +O_CREAT |O_RDWR |O_APPEND |O_LARGEFILE ,0644 ); +if (IS_ERR (rfile)) { +pr_err ("Cannot open the result file %s\n" , + rec->rfile_path); +return ; + } + +while (rec->rbuf_offset) { + sz =kernel_write (rfile, rec->rbuf, rec->rbuf_offset, &pos); +if (sz <0 ) +break ; + rec->rbuf_offset -= sz; + } +filp_close (rfile,NULL ); +} + +/* +* Write a data into the result buffer +*/ +static void dbgfs_write_rbuf (struct damon_ctx *ctx,void *data,ssize_t size) +{ +struct dbgfs_recorder *rec = ctx->callback.private; + +if (!rec->rbuf_len || !rec->rbuf || !rec->rfile_path) +return ; +if (rec->rbuf_offset + size > rec->rbuf_len) +dbgfs_flush_rbuffer (ctx->callback.private); +if (rec->rbuf_offset + size > rec->rbuf_len) { +pr_warn ("%s: flush failed, or wrong size given(%u, %zu)\n" , + __func__, rec->rbuf_offset, size); +return ; + } + +memcpy (&rec->rbuf[rec->rbuf_offset], data, size); + rec->rbuf_offset += size; +} + +static void dbgfs_write_record_header (struct damon_ctx *ctx) +{ +int recfmt_ver =2 ; + +dbgfs_write_rbuf (ctx,"damon_recfmt_ver" ,16 ); +dbgfs_write_rbuf (ctx, &recfmt_ver,sizeof (recfmt_ver)); +} + +static unsigned int nr_damon_targets (struct damon_ctx *ctx) +{ +struct damon_target *t; +unsigned int nr_targets =0 ; + +damon_for_each_target (t, ctx) + nr_targets++; + +return nr_targets; +} + +static int dbgfs_before_start (struct damon_ctx *ctx) +{ +dbgfs_write_record_header (ctx); +return 0 ; +} + +/* +* Store the aggregated monitoring results to the result buffer +* +* The format for the result buffer is as below: +* +* <time> <number of targets> <array of target infos> +* +* target info: <id> <number of regions> <array of region infos> +* region info: <start address> <end address> <nr_accesses> +*/ +static int dbgfs_after_aggregation (struct damon_ctx *c) +{ +struct damon_target *t; +struct timespec64 now; +unsigned int nr; + +ktime_get_coarse_ts64 (&now); + +dbgfs_write_rbuf (c, &now,sizeof (now)); + nr =nr_damon_targets (c); +dbgfs_write_rbuf (c, &nr,sizeof (nr)); + +damon_for_each_target (t, c) { +struct damon_region *r; + +dbgfs_write_rbuf (c, &t->id,sizeof (t->id)); + nr =damon_nr_regions (t); +dbgfs_write_rbuf (c, &nr,sizeof (nr)); +damon_for_each_region (r, t) { +dbgfs_write_rbuf (c, &r->ar.start,sizeof (r->ar.start)); +dbgfs_write_rbuf (c, &r->ar.end,sizeof (r->ar.end)); +dbgfs_write_rbuf (c, &r->nr_accesses, +sizeof (r->nr_accesses)); + } + } + +return 0 ; +} + +static int dbgfs_before_terminate (struct damon_ctx *ctx) +{ +dbgfs_flush_rbuffer (ctx->callback.private); +return 0 ; +} +static struct damon_ctx *dbgfs_new_ctx (void ) {struct damon_ctx *ctx;
@@ -283,7 +532,15 @@ static struct damon_ctx *dbgfs_new_ctx(void)if (!ctx)return NULL ; +if (dbgfs_set_recording (ctx,0 ,"none" )) { +damon_destroy_ctx (ctx); +return NULL ; + } +damon_va_set_primitives (ctx); + ctx->callback.before_start = dbgfs_before_start; + ctx->callback.after_aggregation = dbgfs_after_aggregation; + ctx->callback.before_terminate = dbgfs_before_terminate;return ctx; }
Signature · 1 line
2.17.1
PATCH v24 9/14 mm/damon/dbgfs: Export kdamond pid to the user space
In reply to SeongJae ParkFrom: SeongJae Park <[email protected]>
For CPU usage accounting, knowing pid of the monitoring thread could be helpful. For example, users could use cpuaccount cgroups with the pid.
This commit therefore exports the pid of currently running monitoring thread to the user space via 'kdamond_pid' file in the debugfs directory.
---
 mm/damon/dbgfs.c | 37 +++++++++++++++++++++++++++++++++++--
 1 file changed, 35 insertions(+), 2 deletions(-)
mm/damon/dbgfs.c +35 -2
@@ -358,6 +358,32 @@ static ssize_t dbgfs_target_ids_write(struct file *file,return ret; } +static ssize_t dbgfs_kdamond_pid_read (struct file *file, +char __user *buf,size_t count,loff_t *ppos) +{ +struct damon_ctx *ctx = file->private_data; +char *kbuf; +ssize_t len; + + kbuf =kmalloc (count,GFP_KERNEL ); +if (!kbuf) +return -ENOMEM ; + +mutex_lock (&ctx->kdamond_lock); +if (ctx->kdamond) + len =scnprintf (kbuf, count,"%d\n" , ctx->kdamond->pid); +else + len =scnprintf (kbuf, count,"none\n" ); +mutex_unlock (&ctx->kdamond_lock); +if (!len) + goto out; + len =simple_read_from_buffer (buf, count, ppos, kbuf, len); + +out: +kfree (kbuf); +return len; +} +static int damon_dbgfs_open (struct inode *inode,struct file *file) { file->private_data = inode->i_private;
@@ -386,11 +412,18 @@ static const struct file_operations target_ids_fops = { .write = dbgfs_target_ids_write, }; +static const struct file_operations kdamond_pid_fops = { + .owner =THIS_MODULE , + .open = damon_dbgfs_open, + .read = dbgfs_kdamond_pid_read, +}; +static int dbgfs_fill_ctx_dir (struct dentry *dir,struct damon_ctx *ctx) { -const char *const file_names[] = {"attrs" ,"record" ,"target_ids" }; +const char *const file_names[] = {"attrs" ,"record" ,"target_ids" , +"kdamond_pid" };const struct file_operations *fops[] = {&attrs_fops, &record_fops, - &target_ids_fops}; + &target_ids_fops, &kdamond_pid_fops};int i;for (i =0 ; i <ARRAY_SIZE (file_names); i++) {
Signature · 1 line
2.17.1
PATCH v24 10/14 mm/damon/dbgfs: Support multiple contexts
In reply to SeongJae ParkFrom: SeongJae Park <[email protected]>
In some use cases, users would want to run multiple monitoring context. For example, if a user wants a high precision monitoring and dedicating multiple CPUs for the job is ok, because DAMON creates one monitoring thread per one context, the user can split the monitoring target regions into multiple small regions and create one context for each region. Or, someone might want to simultaneously monitor different address spaces, e.g., both virtual address space and physical address space.
The DAMON's API allows such usage, but 'damon-dbgfs' does not. Therefore, only kernel space DAMON users can do multiple contexts monitoring.
This commit allows the user space DAMON users to use multiple contexts monitoring by introducing two new 'damon-dbgfs' debugfs files, 'mk_context' and 'rm_context'. Users can create a new monitoring context by writing the desired name of the new context to 'mk_context'. Then, a new directory with the name and having the files for setting of the context ('attrs', 'target_ids' and 'record') will be created under the debugfs directory. Writing the name of the context to remove to 'rm_context' will remove the related context and directory.
---
 mm/damon/dbgfs.c | 215 ++++++++++++++++++++++++++++++++++++++++++++++-
 1 file changed, 212 insertions(+), 3 deletions(-)
mm/damon/dbgfs.c +212 -3
@@ -29,6 +29,7 @@ struct dbgfs_recorder {static struct damon_ctx **dbgfs_ctxs;static int dbgfs_nr_ctxs;static struct dentry **dbgfs_dirs; +static DEFINE_MUTEX (damon_dbgfs_lock);/* * Returns non-empty string on success, negarive error code otherwise.
@@ -495,6 +496,13 @@ static void dbgfs_write_record_header(struct damon_ctx *ctx)dbgfs_write_rbuf (ctx, &recfmt_ver,sizeof (recfmt_ver)); } +static void dbgfs_free_recorder (struct dbgfs_recorder *recorder) +{ +kfree (recorder->rbuf); +kfree (recorder->rfile_path); +kfree (recorder); +} +static unsigned int nr_damon_targets (struct damon_ctx *ctx) {struct damon_target *t;
@@ -561,7 +569,7 @@ static struct damon_ctx *dbgfs_new_ctx(void) {struct damon_ctx *ctx; - ctx =damon_new_ctx (DAMON_ADAPTIVE_TARGET ); + ctx =damon_new_ctx ();if (!ctx)return NULL ;
@@ -577,6 +585,195 @@ static struct damon_ctx *dbgfs_new_ctx(void)return ctx; } +static void dbgfs_destroy_ctx (struct damon_ctx *ctx) +{ +dbgfs_free_recorder (ctx->callback.private); +damon_destroy_ctx (ctx); +} + +/* +* Make a context of @name and create a debugfs directory for it. +* +* This function should be called while holding damon_dbgfs_lock. +* +* Returns 0 on success, negative error code otherwise. +*/ +static int dbgfs_mk_context (char *name) +{ +struct dentry *root, **new_dirs, *new_dir; +struct damon_ctx **new_ctxs, *new_ctx; +int err; + +if (damon_nr_running_ctxs ()) +return -EBUSY ; + + new_ctxs =krealloc (dbgfs_ctxs,sizeof (*dbgfs_ctxs) * + (dbgfs_nr_ctxs +1 ),GFP_KERNEL ); +if (!new_ctxs) +return -ENOMEM ; + + new_dirs =krealloc (dbgfs_dirs,sizeof (*dbgfs_dirs) * + (dbgfs_nr_ctxs +1 ),GFP_KERNEL ); +if (!new_dirs) { +kfree (new_ctxs); +return -ENOMEM ; + } + + dbgfs_ctxs = new_ctxs; + dbgfs_dirs = new_dirs; + + root = dbgfs_dirs[0 ]; +if (!root) +return -ENOENT ; + + new_dir =debugfs_create_dir (name, root); +if (IS_ERR (new_dir)) +return PTR_ERR (new_dir); + dbgfs_dirs[dbgfs_nr_ctxs] = new_dir; + + new_ctx =dbgfs_new_ctx (); +if (!new_ctx) { +debugfs_remove (new_dir); + dbgfs_dirs[dbgfs_nr_ctxs] =NULL ; +return -ENOMEM ; + } + dbgfs_ctxs[dbgfs_nr_ctxs] = new_ctx; + + err =dbgfs_fill_ctx_dir (dbgfs_dirs[dbgfs_nr_ctxs], + dbgfs_ctxs[dbgfs_nr_ctxs]); +if (err) +return err; + + dbgfs_nr_ctxs++; +return 0 ; +} + +static ssize_t dbgfs_mk_context_write (struct file *file, +const char __user *buf,size_t count,loff_t *ppos) +{ +char *kbuf; +char *ctx_name; +ssize_t ret = count; +int err; + + kbuf =user_input_str (buf, count, ppos); +if (IS_ERR (kbuf)) +return PTR_ERR (kbuf); + ctx_name =kmalloc (count +1 ,GFP_KERNEL ); +if (!ctx_name) { +kfree (kbuf); +return -ENOMEM ; + } + +/* Trim white space */ +if (sscanf (kbuf,"%s" , ctx_name) !=1 ) { + ret = -EINVAL ; + goto out; + } + +mutex_lock (&damon_dbgfs_lock); + err =dbgfs_mk_context (ctx_name); +if (err) + ret = err; +mutex_unlock (&damon_dbgfs_lock); + +out: +kfree (kbuf); +kfree (ctx_name); +return ret; +} + +/* +* Remove a context of @name and its debugfs directory. +* +* This function should be called while holding damon_dbgfs_lock. +* +* Return 0 on success, negative error code otherwise. +*/ +static int dbgfs_rm_context (char *name) +{ +struct dentry *root, *dir, **new_dirs; +struct damon_ctx **new_ctxs; +int i, j; + +if (damon_nr_running_ctxs ()) +return -EBUSY ; + + root = dbgfs_dirs[0 ]; +if (!root) +return -ENOENT ; + + dir =debugfs_lookup (name, root); +if (!dir) +return -ENOENT ; + + new_dirs =kmalloc_array (dbgfs_nr_ctxs -1 ,sizeof (*dbgfs_dirs), +GFP_KERNEL ); +if (!new_dirs) +return -ENOMEM ; + + new_ctxs =kmalloc_array (dbgfs_nr_ctxs -1 ,sizeof (*dbgfs_ctxs), +GFP_KERNEL ); +if (!new_ctxs) { +kfree (new_dirs); +return -ENOMEM ; + } + +for (i =0 , j =0 ; i < dbgfs_nr_ctxs; i++) { +if (dbgfs_dirs[i] == dir) { +debugfs_remove (dbgfs_dirs[i]); +dbgfs_destroy_ctx (dbgfs_ctxs[i]); +continue ; + } + new_dirs[j] = dbgfs_dirs[i]; + new_ctxs[j++] = dbgfs_ctxs[i]; + } + +kfree (dbgfs_dirs); +kfree (dbgfs_ctxs); + + dbgfs_dirs = new_dirs; + dbgfs_ctxs = new_ctxs; + dbgfs_nr_ctxs--; + +return 0 ; +} + +static ssize_t dbgfs_rm_context_write (struct file *file, +const char __user *buf,size_t count,loff_t *ppos) +{ +char *kbuf; +ssize_t ret = count; +int err; +char *ctx_name; + + kbuf =user_input_str (buf, count, ppos); +if (IS_ERR (kbuf)) +return PTR_ERR (kbuf); + ctx_name =kmalloc (count +1 ,GFP_KERNEL ); +if (!ctx_name) { +kfree (kbuf); +return -ENOMEM ; + } + +/* Trim white space */ +if (sscanf (kbuf,"%s" , ctx_name) !=1 ) { + ret = -EINVAL ; + goto out; + } + +mutex_lock (&damon_dbgfs_lock); + err =dbgfs_rm_context (ctx_name); +if (err) + ret = err; +mutex_unlock (&damon_dbgfs_lock); + +out: +kfree (kbuf); +kfree (ctx_name); +return ret; +} +static ssize_t dbgfs_monitor_on_read (struct file *file,char __user *buf,size_t count,loff_t *ppos) {
@@ -619,6 +816,16 @@ static ssize_t dbgfs_monitor_on_write(struct file *file,return ret; } +static const struct file_operations mk_contexts_fops = { + .owner =THIS_MODULE , + .write = dbgfs_mk_context_write, +}; + +static const struct file_operations rm_contexts_fops = { + .owner =THIS_MODULE , + .write = dbgfs_rm_context_write, +}; +static const struct file_operations monitor_on_fops = { .owner =THIS_MODULE , .read = dbgfs_monitor_on_read,
@@ -628,8 +835,10 @@ static const struct file_operations monitor_on_fops = {static int __init __damon_dbgfs_init (void ) {struct dentry *dbgfs_root; -const char *const file_names[] = {"monitor_on" }; -const struct file_operations *fops[] = {&monitor_on_fops}; +const char *const file_names[] = {"mk_contexts" ,"rm_contexts" , +"monitor_on" }; +const struct file_operations *fops[] = {&mk_contexts_fops, + &rm_contexts_fops, &monitor_on_fops};int i; dbgfs_root =debugfs_create_dir ("damon" ,NULL );
Signature · 1 line
2.17.1
PATCH v24 11/14 Documentation: Add documents for DAMON
In reply to SeongJae ParkFrom: SeongJae Park <[email protected]>
This commit adds documents for DAMON under Documentation/admin-guide/mm/damon/ and Documentation/vm/damon/.
---
 Documentation/admin-guide/mm/damon/guide.rst | 159 ++++++++++
 Documentation/admin-guide/mm/damon/index.rst |  15 +
 Documentation/admin-guide/mm/damon/plans.rst |  29 ++
 Documentation/admin-guide/mm/damon/start.rst |  97 ++++++
 Documentation/admin-guide/mm/damon/usage.rst | 304 +++++++++++++++++++
 Documentation/admin-guide/mm/index.rst       |   1 +
 Documentation/vm/damon/api.rst               |  20 ++
 Documentation/vm/damon/design.rst            | 166 ++++++++++
 Documentation/vm/damon/eval.rst              | 232 ++++++++++++++
 Documentation/vm/damon/faq.rst               |  58 ++++
 Documentation/vm/damon/index.rst             |  31 ++
 Documentation/vm/index.rst                   |   1 +
 12 files changed, 1113 insertions(+)
 create mode 100644 Documentation/admin-guide/mm/damon/guide.rst
 create mode 100644 Documentation/admin-guide/mm/damon/index.rst
 create mode 100644 Documentation/admin-guide/mm/damon/plans.rst
 create mode 100644 Documentation/admin-guide/mm/damon/start.rst
 create mode 100644 Documentation/admin-guide/mm/damon/usage.rst
 create mode 100644 Documentation/vm/damon/api.rst
 create mode 100644 Documentation/vm/damon/design.rst
 create mode 100644 Documentation/vm/damon/eval.rst
 create mode 100644 Documentation/vm/damon/faq.rst
 create mode 100644 Documentation/vm/damon/index.rst
Documentation/admin-guide/mm/damon/guide.rst new file +159 -0
@@ -0,0 +1,159 @@ +.. SPDX-License-Identifier: GPL-2.0 + +================== +Optimization Guide +================== + +This document helps you estimating the amount of benefit that you could get +from DAMON-based optimizations, and describes how you could achieve it. You +are assumed to already read :doc:`start`. + + +Check The Signs +=============== + +No optimization can provide same extent of benefit to every case. Therefore +you should first guess how much improvements you could get using DAMON. If +some of below conditions match your situation, you could consider using DAMON. + +- *Low IPC and High Cache Miss Ratios.* Low IPC means most of the CPU time is + spent waiting for the completion of time-consuming operations such as memory + access, while high cache miss ratios mean the caches don't help it well. + DAMON is not for cache level optimization, but DRAM level. However, + improving DRAM management will also help this case by reducing the memory + operation latency. +- *Memory Over-commitment and Unknown Users.* If you are doing memory + overcommitment and you cannot control every user of your system, a memory + bank run could happen at any time. You can estimate when it will happen + based on DAMON's monitoring results and act earlier to avoid or deal better + with the crisis. +- *Frequent Memory Pressure.* Frequent memory pressure means your system has + wrong configurations or memory hogs. DAMON will help you find the right + configuration and/or the criminals. +- *Heterogeneous Memory System.* If your system is utilizing memory devices + that placed between DRAM and traditional hard disks, such as non-volatile + memory or fast SSDs, DAMON could help you utilizing the devices more + efficiently. + + +Profile +======= + +If you found some positive signals, you could start by profiling your workloads +using DAMON. Find major workloads on your systems and analyze their data +access pattern to find something wrong or can be improved. The DAMON user +space tool (``damo``) will be useful for this. You can get ``damo`` from +``tools/damon/`` directory in the DAMON development tree (``damon/master`` +branch of https://github.com/sjp38/linux.git). + +We recommend you to start from working set size distribution check using ``damo +report wss``. If the distribution is ununiform or quite different from what +you estimated, you could consider `Memory Configuration`_ optimization. + +Then, review the overall access pattern in heatmap form using ``damo report +heats``. If it shows a simple pattern consists of a small number of memory +regions having high contrast of access temperature, you could consider manual +`Program Modification`_. + +If you still want to absorb more benefits, you should develop `Personalized +DAMON Application`_ for your special case. + +You don't need to take only one approach among the above plans, but you could +use multiple of the above approaches to maximize the benefit. + + +Optimize +======== + +If the profiling result also says it's worth trying some optimization, you +could consider below approaches. Note that some of the below approaches assume +that your systems are configured with swap devices or other types of auxiliary +memory so that you don't strictly required to accommodate the whole working set +in the main memory. Most of the detailed optimization should be made on your +concrete understanding of your memory devices. + + +Memory Configuration +-------------------- + +No more no less, DRAM should be large enough to accommodate only important +working sets, because DRAM is highly performance critical but expensive and +heavily consumes the power. However, knowing the size of the real important +working sets is difficult. As a consequence, people usually equips +unnecessarily large or too small DRAM. Many problems stem from such wrong +configurations. + +Using the working set size distribution report provided by ``damo report wss``, +you can know the appropriate DRAM size for you. For example, roughly speaking, +if you worry about only 95 percentile latency, you don't need to equip DRAM of +a size larger than 95 percentile working set size. + +Let's see a real example. This `page +<https://damonitor.github.io/doc/html/v17/admin-guide/mm/damon/guide.html#memory-configuration>`_ +shows the heatmap and the working set size distributions/changes of +``freqmine`` workload in PARSEC3 benchmark suite. The working set size spikes +up to 180 MiB, but keeps smaller than 50 MiB for more than 95% of the time. +Even though you give only 50 MiB of memory space to the workload, it will work +well for 95% of the time. Meanwhile, you can save the 130 MiB of memory space. + + +Program Modification +-------------------- + +If the data access pattern heatmap plotted by ``damo report heats`` is quite +simple so that you can understand how the things are going in the workload with +your human eye, you could manually optimize the memory management. + +For example, suppose that the workload has two big memory object but only one +object is frequently accessed while the other one is only occasionally +accessed. Then, you could modify the program source code to keep the hot +object in the main memory by invoking ``mlock()`` or ``madvise()`` with +``MADV_WILLNEED``. Or, you could proactively evict the cold object using +``madvise()`` with ``MADV_COLD`` or ``MADV_PAGEOUT``. Using both together +would be also worthy. + +A research work [1]_ using the ``mlock()`` achieved up to 2.55x performance +speedup. + +Let's see another realistic example access pattern for this kind of +optimizations. This `page +<https://damonitor.github.io/doc/html/v17/admin-guide/mm/damon/guide.html#program-modification>`_ +shows the visualized access patterns of streamcluster workload in PARSEC3 +benchmark suite. We can easily identify the 100 MiB sized hot object. + + +Personalized DAMON Application +------------------------------ + +Above approaches will work well for many general cases, but would not enough +for some special cases. + +If this is the case, it might be the time to forget the comfortable use of the +user space tool and dive into the debugfs interface (refer to :doc:`usage` for +the detail) of DAMON. Using the interface, you can control the DAMON more +flexibly. Therefore, you can write your personalized DAMON application that +controls the monitoring via the debugfs interface, analyzes the result, and +applies complex optimizations itself. Using this, you can make more creative +and wise optimizations. + +If you are a kernel space programmer, writing kernel space DAMON applications +using the API (refer to the :doc:`/vm/damon/api` for more detail) would be an +option. + + +Reference Practices +=================== + +Referencing previously done successful practices could help you getting the +sense for this kind of optimizations. There is an academic paper [1]_ +reporting the visualized access pattern and manual `Program +Modification`_ results for a number of realistic workloads. You can also get +the visualized access patterns [3]_ [4]_ [5]_ and automated DAMON-based memory +operations results for other realistic workloads that collected with latest +version of DAMON [2]_ . + +.. [1] https://dl.acm.org/doi/10.1145/3366626.3368125 +.. [2] https://damonitor.github.io/test/result/perf/latest/html/ +.. [3] https://damonitor.github.io/test/result/visual/latest/rec.heatmap.1.png.html +.. [4] https://damonitor.github.io/test/result/visual/latest/rec.wss_sz.png.html +.. [5] https://damonitor.github.io/test/result/visual/latest/rec.wss_time.png.html
Documentation/admin-guide/mm/damon/index.rst new file +15 -0
@@ -0,0 +1,15 @@ +.. SPDX-License-Identifier: GPL-2.0 + +======================== +Monitoring Data Accesses +======================== + +:doc:`DAMON </vm/damon/index>` allows light-weight data access monitoring. +Using this, users can analyze and optimize their systems. + +.. toctree:: + :maxdepth: 2 + + start + guide + usage
Documentation/admin-guide/mm/damon/plans.rst new file +29 -0
@@ -0,0 +1,29 @@ +.. SPDX-License-Identifier: GPL-2.0 + +============ +Future Plans +============ + +DAMON is still on its first stage. Below plans are still under development. + + +Automate Data Access Monitoring-based Memory Operation Schemes Execution +======================================================================== + +The ultimate goal of DAMON is to be used as a building block for the data +access pattern aware kernel memory management optimization. It will make +system just works efficiently. However, some users having very special +workloads will want to further do their own optimization. DAMON will automate +most of the tasks for such manual optimizations in near future. Users will be +required to only describe what kind of data access pattern-based operation +schemes they want in a simple form. + +By applying a very simple scheme for THP promotion/demotion with a prototype +implementation, DAMON reduced 60% of THP memory footprint overhead while +preserving 50% of the THP performance benefit. The detailed results can be +seen on an external web page [1]_. + +Several RFC patchsets for this plan are available [2]_. + +.. [1] https://damonitor.github.io/test/result/perf/latest/html/ +.. [2] https://lore.kernel.org/linux-mm/[email protected]/
Documentation/admin-guide/mm/damon/start.rst new file +97 -0
97 lines not on this page · raw message
Documentation/admin-guide/mm/damon/usage.rst new file +304 -0
304 lines not on this page · raw message
Documentation/admin-guide/mm/index.rst +1 -0
@@ -27,6 +27,7 @@ the Linux memory management. concepts cma_debugfs + damon/index hugetlbpage idle_page_tracking ksm
Documentation/vm/damon/api.rst new file +20 -0
@@ -0,0 +1,20 @@ +.. SPDX-License-Identifier: GPL-2.0 + +============= +API Reference +============= + +Kernel space programs can use every feature of DAMON using below APIs. All you +need to do is including ``damon.h``, which is located in ``include/linux/`` of +the source tree. + +Structures +========== + +.. kernel-doc:: include/linux/damon.h + + +Functions +========= + +.. kernel-doc:: mm/damon/core.c
Documentation/vm/damon/design.rst new file +166 -0
166 lines not on this page · raw message
Documentation/vm/damon/eval.rst new file +232 -0
232 lines not on this page · raw message
Documentation/vm/damon/faq.rst new file +58 -0
58 lines not on this page · raw message
Documentation/vm/damon/index.rst new file +31 -0
@@ -0,0 +1,31 @@ +.. SPDX-License-Identifier: GPL-2.0 + +========================== +DAMON: Data Access MONitor +========================== + +DAMON is a data access monitoring framework subsystem for the Linux kernel. +The core mechanisms of DAMON (refer to :doc:`design` for the detail) make it + + - *accurate* (the monitoring output is useful enough for DRAM level memory + management; It might not appropriate for CPU Cache levels, though), + - *light-weight* (the monitoring overhead is low enough to be applied online), + and + - *scalable* (the upper-bound of the overhead is in constant range regardless + of the size of target workloads). + +Using this framework, therefore, the kernel's memory management mechanisms can +make advanced decisions. Experimental memory management optimization works +that incurring high data accesses monitoring overhead could implemented again. +In user space, meanwhile, users who have some special workloads can write +personalized applications for better understanding and optimizations of their +workloads and systems. + +.. toctree:: + :maxdepth: 2 + + faq + design + eval + api + plans
Documentation/vm/index.rst +1 -0
@@ -32,6 +32,7 @@ descriptions of data structures and algorithms. arch_pgtable_helpers balance cleancache + damon/index free_page_reporting frontswap highmem
Signature · 1 line
2.17.1
Re: [PATCH v24 11/14] Documentation: Add documents for DAMON
Quoted 31 lines · On Thu, 4 Feb 2021 16:31:47 +0100 SeongJae Park <[email protected]> wrote:
From: SeongJae Park <[email protected]>
This commit adds documents for DAMON under
Documentation/admin-guide/mm/damon/andDocumentation/vm/damon/.Signed-off-by SeongJae Park <[email protected]>--- Documentation/admin-guide/mm/damon/guide.rst | 159 ++++++++++ Documentation/admin-guide/mm/damon/index.rst | 15 + Documentation/admin-guide/mm/damon/plans.rst | 29 ++ Documentation/admin-guide/mm/damon/start.rst | 97 ++++++ Documentation/admin-guide/mm/damon/usage.rst | 304 +++++++++++++++++++ Documentation/admin-guide/mm/index.rst | 1 + Documentation/vm/damon/api.rst | 20 ++ Documentation/vm/damon/design.rst | 166 ++++++++++ Documentation/vm/damon/eval.rst | 232 ++++++++++++++ Documentation/vm/damon/faq.rst | 58 ++++ Documentation/vm/damon/index.rst | 31 ++ Documentation/vm/index.rst | 1 + 12 files changed, 1113 insertions(+) create mode 100644 Documentation/admin-guide/mm/damon/guide.rst create mode 100644 Documentation/admin-guide/mm/damon/index.rst create mode 100644 Documentation/admin-guide/mm/damon/plans.rst create mode 100644 Documentation/admin-guide/mm/damon/start.rst create mode 100644 Documentation/admin-guide/mm/damon/usage.rst create mode 100644 Documentation/vm/damon/api.rst create mode 100644 Documentation/vm/damon/design.rst create mode 100644 Documentation/vm/damon/eval.rst create mode 100644 Documentation/vm/damon/faq.rst create mode 100644 Documentation/vm/damon/index.rst
[...]
Quoted 29 lines
Documentation/admin-guide/mm/damon/usage.rst new file +23
-0@@ -0,0 +1,304 @@ +.. SPDX-License-Identifier: GPL-2.0 + +=============== +Detailed Usages +=============== + +DAMON provides below three interfaces for different users. + +- *DAMON user space tool.* + This is for privileged people such as system administrators who want a + just-working human-friendly interface. Using this, users can use the DAMON’s + major features in a human-friendly way. It may not be highly tuned for + special cases, though. It supports only virtual address spaces monitoring. +- *debugfs interface.* + This is for privileged user space programmers who want more optimized use of + DAMON. Using this, users can use DAMON’s major features by reading + from and writing to special debugfs files. Therefore, you can write and use + your personalized DAMON debugfs wrapper programs that reads/writes the + debugfs files instead of you. The DAMON user space tool is also a reference + implementation of such programs. It supports only virtual address spaces + monitoring. +- *Kernel Space Programming Interface.* + This is for kernel space programmers. Using this, users can utilize every
Documentation/admin-guide/mm/damon/usage.rst line 33
Quoted 10 lines
Documentation/admin-guide/mm/damon/usage.rst new file +10
-0+ feature of DAMON most flexibly and efficiently by writing kernel space + DAMON application programs for you. You can even extend DAMON for various + address spaces. + +This document does not describe the kernel space programming interface in +detail. For that, please refer to the :doc:`/vm/damon/api`. + + +DAMON User Space Tool +=====================
This version of the patchset doesn't introduce the user space tool source code, so putting the detailed usage here might make no sense. I will remove this section in the next version. If you will review this patch, please skip this section.
[...]
Documentation/admin-guide/mm/damon/usage.rst line 225
Quoted 3 lines
Documentation/admin-guide/mm/damon/usage.rst new file +3
-0+ +debugfs Interface +=================
But, this section will not be removed. Please review.
[...]
Thanks,
SeongJae Park
PATCH v24 12/14 mm/damon: Add kunit tests
In reply to SeongJae ParkFrom: SeongJae Park <[email protected]>
This commit adds kunit based unit tests for the core and the virtual address spaces monitoring primitives of DAMON.
---
 mm/damon/Kconfig      |  36 +++++
 mm/damon/core-test.h  | 253 ++++++++++++++++++++++++++++++++
 mm/damon/core.c       |   7 +
 mm/damon/dbgfs-test.h | 214 +++++++++++++++++++++++++++
 mm/damon/dbgfs.c      |   2 +
 mm/damon/vaddr-test.h | 328 ++++++++++++++++++++++++++++++++++++++++++
 mm/damon/vaddr.c      |   7 +
 7 files changed, 847 insertions(+)
 create mode 100644 mm/damon/core-test.h
 create mode 100644 mm/damon/dbgfs-test.h
 create mode 100644 mm/damon/vaddr-test.h
mm/damon/Kconfig +36 -0
@@ -12,6 +12,18 @@ config DAMON See https://damonitor.github.io/doc/html/latest-damon/index.html for more information. +config DAMON_KUNIT_TEST + bool "Test for damon" if !KUNIT_ALL_TESTS + depends on DAMON && KUNIT=y + default KUNIT_ALL_TESTS + help + This builds the DAMON Kunit test suite. + + For more information on KUnit and unit tests in general, please refer + to the KUnit documentation. + + If unsure, say N. + config DAMON_VADDR bool "Data access monitoring primitives for virtual address spaces" depends on DAMON && MMU
@@ -21,6 +33,18 @@ config DAMON_VADDR
 	  This builds the default data access monitoring primitives for DAMON
 	  that works for virtual address spaces.

+config DAMON_VADDR_KUNIT_TEST
+	bool "Test for DAMON primitives" if !KUNIT_ALL_TESTS
+	depends on DAMON_VADDR && KUNIT=y
+	default KUNIT_ALL_TESTS
+	help
+	  This builds the DAMON virtual addresses primitives Kunit test suite.
+
+	  For more information on KUnit and unit tests in general, please refer
+	  to the KUnit documentation.
+
+	  If unsure, say N.
+
 config DAMON_DBGFS
 	bool "DAMON debugfs interface"
 	depends on DAMON_VADDR && DEBUG_FS
@@ -30,4 +54,16 @@ config DAMON_DBGFS

 	  If unsure, say N.

+config DAMON_DBGFS_KUNIT_TEST
+	bool "Test for damon debugfs interface" if !KUNIT_ALL_TESTS
+	depends on DAMON_DBGFS && KUNIT=y
+	default KUNIT_ALL_TESTS
+	help
+	  This builds the DAMON debugfs interface Kunit test suite.
+
+	  For more information on KUnit and unit tests in general, please refer
+	  to the KUnit documentation.
+
+	  If unsure, say N.
+
 endmenu
mm/damon/core-test.h new file +253 -0
253 lines not on this page · raw message
mm/damon/core.c +7 -0
@@ -16,6 +16,11 @@#define CREATE_TRACE_POINTS #include <trace/events/damon.h> +#ifdef CONFIG_DAMON_KUNIT_TEST +#undef DAMON_MIN_REGION +#define DAMON_MIN_REGION 1 +#endif +/* Get a random number in [l, r) */ #define damon_rand (l, r) (l + prandom_u32_max(r - l))
@@ -709,3 +714,5 @@ static int kdamond_fn(void *data)do_exit (0 ); } + +#include "core-test.h"
mm/damon/dbgfs-test.h new file +214 -0
214 lines not on this page · raw message
mm/damon/dbgfs.c +2 -0
@@ -884,3 +884,5 @@ static int __init damon_dbgfs_init(void) }module_init (damon_dbgfs_init); + +#include "dbgfs-test.h"
mm/damon/vaddr-test.h new file +328 -0
328 lines not on this page · raw message
mm/damon/vaddr.c +7 -0
@@ -15,6 +15,11 @@#include <linux/sched/mm.h> #include <linux/slab.h> +#ifdef CONFIG_DAMON_VADDR_KUNIT_TEST +#undef DAMON_MIN_REGION +#define DAMON_MIN_REGION 1 +#endif +/* Get a random number in [l, r) */ #define damon_rand (l, r) (l + prandom_u32_max(r - l))
@@ -577,3 +582,5 @@ void damon_va_set_primitives(struct damon_ctx *ctx)
 	ctx->primitive.target_valid = damon_va_target_valid;
 	ctx->primitive.cleanup = damon_va_cleanup;
 }
+
+#include "vaddr-test.h"
Signature · 1 line
2.17.1
PATCH v24 13/14 mm/damon: Add user space selftests
In reply to SeongJae ParkFrom: SeongJae Park <[email protected]>
This commit adds a simple user space tests for DAMON. The tests are using kselftest framework.
---
 tools/testing/selftests/damon/Makefile        |   7 +
 .../selftests/damon/_chk_dependency.sh        |  28 +++
 tools/testing/selftests/damon/_chk_record.py  | 109 ++++++++++++
 .../testing/selftests/damon/debugfs_attrs.sh  | 161 ++++++++++++++++++
 .../testing/selftests/damon/debugfs_record.sh |  50 ++++++
 5 files changed, 355 insertions(+)
 create mode 100644 tools/testing/selftests/damon/Makefile
 create mode 100644 tools/testing/selftests/damon/_chk_dependency.sh
 create mode 100644 tools/testing/selftests/damon/_chk_record.py
 create mode 100755 tools/testing/selftests/damon/debugfs_attrs.sh
 create mode 100755 tools/testing/selftests/damon/debugfs_record.sh
tools/testing/selftests/damon/Makefile new file +7 -0
@@ -0,0 +1,7 @@ +# SPDX-License-Identifier: GPL-2.0 +# Makefile for damon selftests + +TEST_FILES = _chk_dependency.sh _chk_record_file.py +TEST_PROGS = debugfs_attrs.sh debugfs_record.sh + +include ../lib.mk
tools/testing/selftests/damon/_chk_dependency.sh new file +28 -0
@@ -0,0 +1,28 @@ +#!/bin/bash +# SPDX-License-Identifier: GPL-2.0 + +# Kselftest framework requirement - SKIP code is 4. +ksft_skip=4 + +DBGFS=/sys/kernel/debug/damon + +if [ $EUID -ne 0 ]; +then + echo "Run as root" + exit $ksft_skip +fi + +if [ ! -d $DBGFS ] +then + echo "$DBGFS not found" + exit $ksft_skip +fi + +for f in attrs record target_ids monitor_on +do + if [ ! -f "$DBGFS/$f" ] + then + echo "$f not found" + exit 1 + fi +done
tools/testing/selftests/damon/_chk_record.py new file +109 -0
109 lines not on this page · raw message
tools/testing/selftests/damon/debugfs_attrs.sh new file +161 -0
161 lines not on this page · raw message
tools/testing/selftests/damon/debugfs_record.sh new file +50 -0
50 lines not on this page · raw message
Signature · 1 line
2.17.1
Quoted 2 lines · On Thu, 4 Feb 2021 16:31:36 +0100 SeongJae Park <[email protected]> wrote:
From: SeongJae Park <[email protected]>
[...]
Quoted 21 lines
Introduction
============DAMON is a data access monitoring framework for the Linux kernel. The core mechanisms of DAMON called 'region based sampling' and 'adaptive regions adjustment' (refer to '
mechanisms.rst' in the 11th patch of this patchset for the detail) make it- accurate (The monitored information is useful for DRAM level memory management. It might not appropriate for Cache-level accuracy, though.),
- light-weight (The monitoring overhead is low enough to be applied online while making no impact on the performance of the target workloads.), and
- scalable (the upper-bound of the instrumentation overhead is controllable regardless of the size of target workloads.).Using this framework, therefore, several memory management mechanisms such as reclamation and THP can be optimized to aware real data access patterns. Experimental access pattern aware memory management optimization works that incurring high instrumentation overhead will be able to have another try.
Quoted 6 lines
Though DAMON is for kernel subsystems, it can be easily exposed to the user space by writing a DAMON-wrapper kernel subsystem. Then, user space users who have some special workloads will be able to write personalized tools or applications for deeper understanding and specialized optimizations of their systems.
I realized I didn't introduce a good, intuitive example use case of DAMON for profiling so far, though DAMON is not for only profiling. One straightforward and realistic usage of DAMON as a profiling tool would be recording the monitoring results with callstack and visualize those by timeline together.
For example, below link shows that visualization for a realistic workload, namely 'fft' in SPLASH-2X benchmark suite. From that, you can know there are three memory access bursting phases in the workload and 'FFT1DOnce.cons::prop.2()' looks responsible for the first and second hot phase, while 'Transpose()' is responsible for the last one. Now the programmer can take a deep look in the functions and optimize the code (e.g., adding madvise() or mlock() calls).
https://damonitor.github.io/temporal/damon_callstack.png
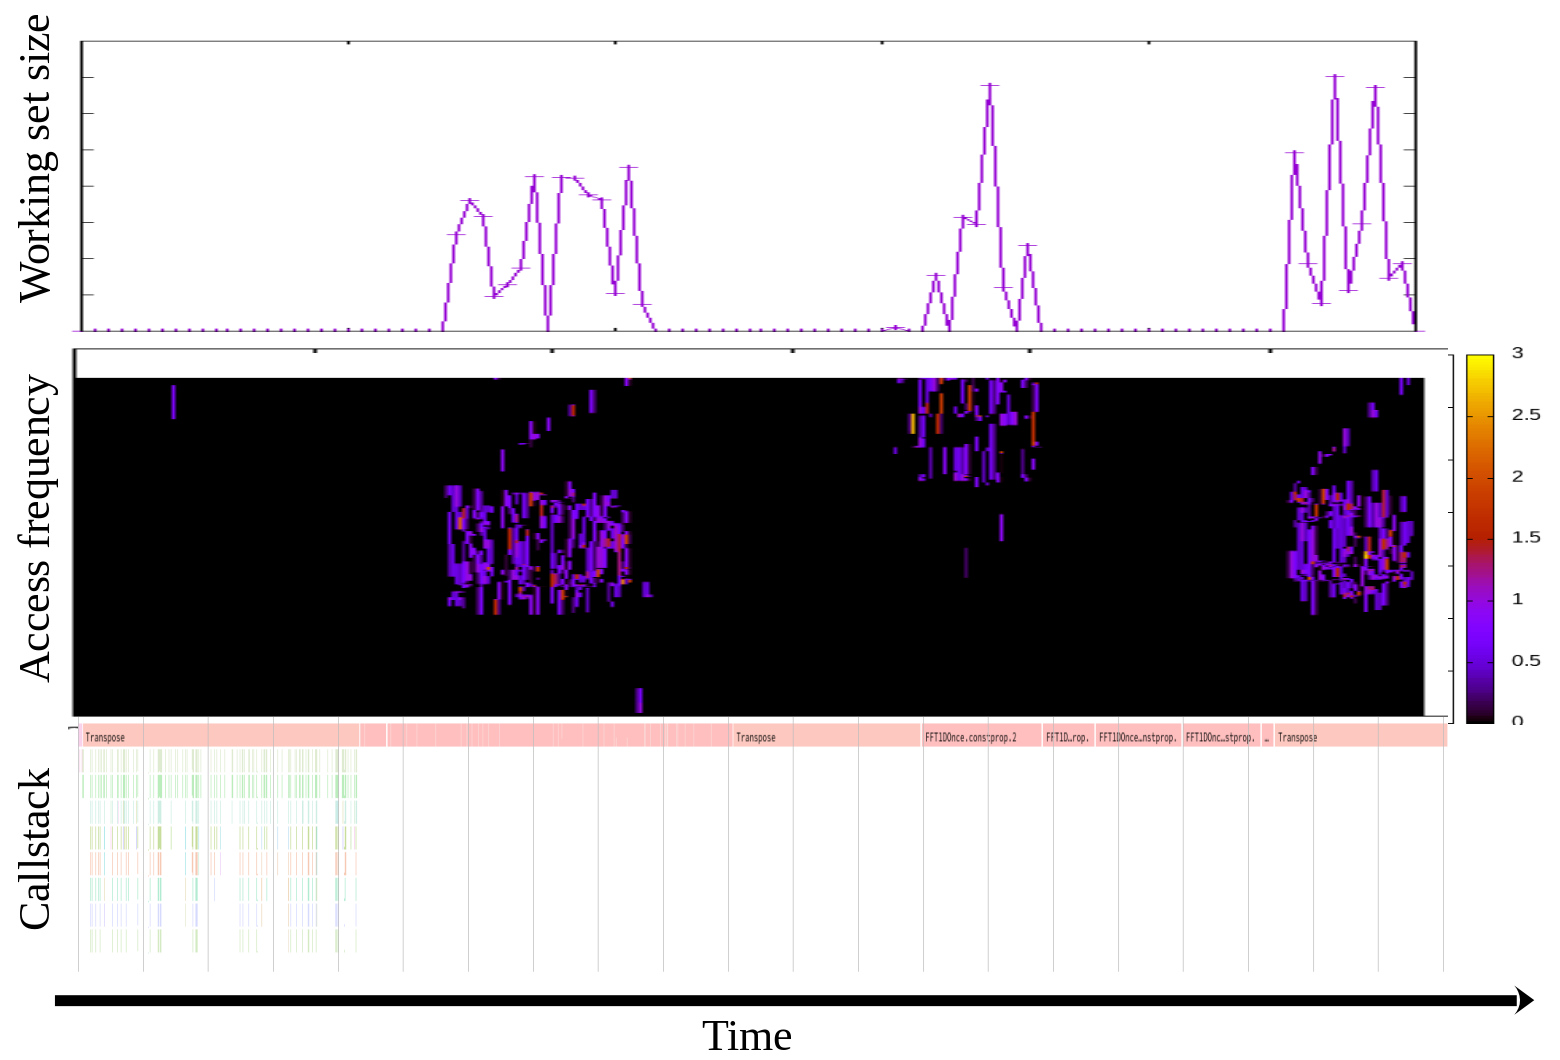
We used the approach for 'mlock()'-based optimization of a range of other realistic benchmark workloads. The optimized versions achieved up to about 2.5x performance improvement under memory pressure[1].
Note: I made the uppermost two figures in above 'fft' visualization (working set size and access frequency of each memory region by time) via the DAMON user space tool[2], while the lowermost one (callstack by time) is made using perf and speedscope[3]. We have no descent and totally automated tool for that yet (will be implemented soon, maybe under perf as a perf-script[4]), but you could reproduce that with below commands.
    $ # run the workload
    $ sudo damo record $(pidof <your_workload>) &
    $ sudo perf record -g $(pidof <your_workload>)
    $ # after your workload finished (you should also finish perf on your own)
    $ damo report wss --sortby time --plot wss.pdf
    $ damo report heats --heatmap freq.pdf
    $ sudo perf script | speedscope -
    $ # open wss.pdf and freq.pdf with our favorite pdf viewer
[1] https://linuxplumbersconf.org/event/4/contributions/548/attachments/311/590/damon_ksummit19.pdf
[2] https://lore.kernel.org/linux-mm/[email protected]/
[3] https://www.speedscope.app/
[4] https://lore.kernel.org/linux-mm/[email protected]/
PATCH v24 14/14 MAINTAINERS: Update for DAMON
In reply to SeongJae ParkFrom: SeongJae Park <[email protected]>
This commit updates MAINTAINERS file for DAMON related files.
---
 MAINTAINERS | 12 ++++++++++++
 1 file changed, 12 insertions(+)
MAINTAINERS +12 -0
@@ -4872,6 +4872,18 @@ F: net/ax25/ax25_out.c F: net/ax25/ax25_timer.c F: net/ax25/sysctl_net_ax25.c +DATA ACCESS MONITOR +M: SeongJae Park <[email protected]> +L: [email protected] +S: Maintained +F: Documentation/admin-guide/mm/damon/* +F: Documentation/vm/damon/* +F: include/linux/damon.h +F: include/trace/events/damon.h +F: mm/damon/* +F: tools/damon/* +F: tools/testing/selftests/damon/* + DAVICOM FAST ETHERNET (DMFE) NETWORK DRIVER L: [email protected] S: Orphan
Signature · 1 line
2.17.1
Quoted 1 line · On Thu, 4 Feb 2021 16:31:36 +0100 SeongJae Park <[email protected]> wrote:
From: SeongJae Park <[email protected]>
[...]
Quoted 27 lines
Introduction
============DAMON is a data access monitoring framework for the Linux kernel. The core mechanisms of DAMON called 'region based sampling' and 'adaptive regions adjustment' (refer to '
mechanisms.rst' in the 11th patch of this patchset for the detail) make it- accurate (The monitored information is useful for DRAM level memory management. It might not appropriate for Cache-level accuracy, though.),
- light-weight (The monitoring overhead is low enough to be applied online while making no impact on the performance of the target workloads.), and
- scalable (the upper-bound of the instrumentation overhead is controllable regardless of the size of target workloads.).Using this framework, therefore, several memory management mechanisms such as reclamation and THP can be optimized to aware real data access patterns. Experimental access pattern aware memory management optimization works that incurring high instrumentation overhead will be able to have another try.
Though DAMON is for kernel subsystems, it can be easily exposed to the user space by writing a DAMON-wrapper kernel subsystem. Then, user space users who have some special workloads will be able to write personalized tools or applications for deeper understanding and specialized optimizations of their systems.
[...]
Quoted 12 lines
Baseline and Complete Git Trees
===============================The patches are based on the v5.10. You can also clone the complete git tree:
$ git clone git://github.com/sjp38/linux -b damon/patches/v24The web is also available:
https://github.com/sjp38/linux/releases/tag/damon/patches/v24
Quoted 6 lines
There are a couple of trees for entire DAMON patchset series. It includes future features. The first one[1] contains the changes for latest release, while the other one[2] contains the changes for next release.
[1] https://github.com/sjp38/linux/tree/damon/master
[2] https://github.com/sjp38/linux/tree/damon/next
For people who prefer LTS kernels, I decided to maintain two more trees that repectively based on latest two LTS kernels and contains backports of the latest 'damon/master' tree, as below. Please use those if you want to test DAMON but using LTS.
- For v5.4.y: https://github.com/sjp38/linux/tree/damon/for-v5.4.y
- For v5.10.y: https://github.com/sjp38/linux/tree/damon/for-v5.10.y
Thanks,
SeongJae Park