Btrfs Heatmap - visualize your filesystem
Hi,
It seems I never mailed the list yet about a fun little tool to visualize the space usage of a btrfs filesystem:
https://github.com/knorrie/btrfs-heatmap
It needs python-btrfs to query a btrfs filesystem for block group usage and pypng to generate an image showing disk space usage as some kind of heatmap.
More info is in the README inside the project.
The Hilbert curve might seem a little weird at first, but I haven't seen a better way of visualization that keeps providing useful information about locality for larger filesystems.
Today on IRC naptastic shared a timelapse video of using btrfs balance after adding 2 disks to a filesystem:
20:30 < naptastic> https://youtu.be/AA5gvsRtLgI
20:30 < naptastic> Enjoy!
Oh, and if someone is bored... What about creating an ncurses frontend for fun, that looks like this, while you're waiting on btrfs balance to complete... https://hblok.net/blog_pics/nsd.png
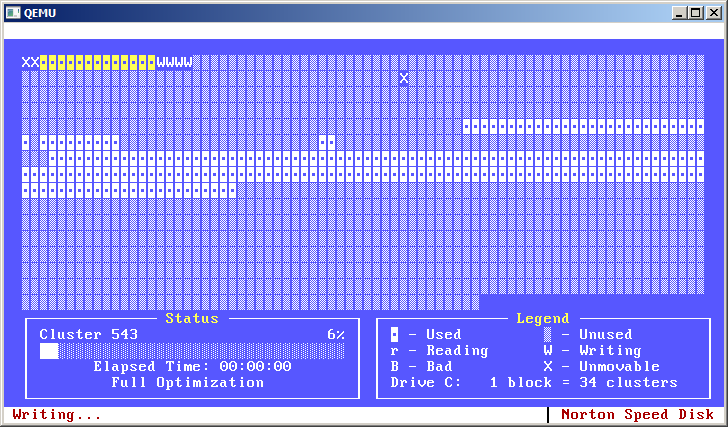
Quote of the day:
01:09 < kdave> watching speeddisk was a computer game substitute of my youth
P.S. This program also shows how convenient it is to build something else on top of python-btrfs... The lines that are really needed to get all information about the filesystem can be counted on two hands. :)
Moo!
Knorrie
Btrfs Heatmap - v2 - block group internals!
In the last two days I've added the --blockgroup option to btrfs heatmap to let it create pictures of block group internals.
Examples and more instructions are to be found in the README at:
https://github.com/knorrie/btrfs-heatmap/blob/master/README.md
To use the new functionality it needs a fairly recent python-btrfs for the 'skinny' METADATA_ITEM_KEY to be present. Latest python-btrfs release is v0.3, created yesterday.
Yay,
Signature · 1 line
Hans van Kranenburg
Re: Btrfs Heatmap - v2 - block group internals!
Quoted 12 lines · Hans van Kranenburg
In the last two days I've added the --blockgroup option to btrfs heatmap to let it create pictures of block group internals.
Examples and more instructions are to be found in the README at:
https://github.com/knorrie/btrfs-heatmap/blob/master/README.mdTo use the new functionality it needs a fairly recent python-btrfs for the 'skinny'
METADATA_ITEM_KEYto be present. Latest python-btrfs release is v0.3, created yesterday.Yay,
Wow, really cool!
I always dream about a visualizing tool to represent the chunk and extent level of btrfs.
This should really save me from reading the boring dec numbers from btrfs-debug-tree.
Although IMHO the full fs output is mixing extent and chunk level together, which makes it a little hard to represent multi-device case, it's still an awesome tool!
And considering the "show-block" tool in btrfs-progs is quite old,
I think if the tool get further polished it may have a chance get into btrfs-progs.
Thanks,
Qu
Re: Btrfs Heatmap - v2 - block group internals!
Hey,
Quoted 5 lines · Qu Wenruo
Quoted 3 lines · Hans van Kranenburg
In the last two days I've added the --blockgroup option to btrfs heatmap to let it create pictures of block group internals.
Quoted 8 lines
Quoted 7 lines
Examples and more instructions are to be found in the README at:
https://github.com/knorrie/btrfs-heatmap/blob/master/README.mdTo use the new functionality it needs a fairly recent python-btrfs for the 'skinny'
METADATA_ITEM_KEYto be present. Latest python-btrfs release is v0.3, created yesterday.Wow, really cool!
Thanks!
Quoted 9 lines
I always dream about a visualizing tool to represent the chunk and extent level of btrfs.
This should really save me from reading the boring dec numbers from btrfs-debug-tree.
Although IMHO the full fs output is mixing extent and chunk level together, which makes it a little hard to represent multi-device case, it's still an awesome tool!
The picture of a full filesystem just appends all devices together into one big space, and then walks the dev_extent tree and associated chunk/blockgroup items for the %used/greyscale value.
I don't see what displaying a blockgroup-level aggregate usage number has to do with multi-device, except that the same %usage will appear another time when using RAID1*.
When generating a picture of a file system with multiple devices, boundaries between the separate devices are not visible now.
If someone has a brilliant idea about how to do this without throwing out actual usage data...
Signature · 1 line
Hans van Kranenburg
Re: Btrfs Heatmap - v2 - block group internals!
Quoted 37 lines · Hans van Kranenburg
Hey,
Quoted 5 lines · Qu Wenruo
Quoted 3 lines · Hans van Kranenburg
In the last two days I've added the --blockgroup option to btrfs heatmap to let it create pictures of block group internals.
Quoted 8 lines
Quoted 7 lines
Examples and more instructions are to be found in the README at:
https://github.com/knorrie/btrfs-heatmap/blob/master/README.mdTo use the new functionality it needs a fairly recent python-btrfs for the 'skinny'
METADATA_ITEM_KEYto be present. Latest python-btrfs release is v0.3, created yesterday.Wow, really cool!
Thanks!
Quoted 9 lines
I always dream about a visualizing tool to represent the chunk and extent level of btrfs.
This should really save me from reading the boring dec numbers from btrfs-debug-tree.
Although IMHO the full fs output is mixing extent and chunk level together, which makes it a little hard to represent multi-device case, it's still an awesome tool!
The picture of a full filesystem just appends all devices together into one big space, and then walks the
dev_extenttree and associated chunk/blockgroup items for the %used/greyscale value.I don't see what displaying a blockgroup-level aggregate usage number has to do with multi-device, except that the same %usage will appear another time when using RAID1*.
Quoted 6 lines
When generating a picture of a file system with multiple devices, boundaries between the separate devices are not visible now.
If someone has a brilliant idea about how to do this without throwing out actual usage data...
The first thought that comes to mind for me is to make each device be a different color, and otherwise obey the same intensity mapping correlating to how much data is there. For example, if you've got a 3 device FS, the parts of the image that correspond to device 1 would go from 0x000000 to 0xFF0000, the parts for device 2 could be 0x000000 to 0x00FF00, and the parts for device 3 could be 0x000000 to 0x0000FF. This is of course not perfect (you can't tell what device each segment of empty space corresponds to), but would probably cover most use cases. (for example, with such a scheme, you could look at an image and tell whether the data is relatively well distributed across all the devices or you might need to re-balance).
Re: Btrfs Heatmap - v2 - block group internals!
Quoted 8 lines · Austin S. Hemmelgarn
Quoted 7 lines · Hans van Kranenburg
When generating a picture of a file system with multiple devices, boundaries between the separate devices are not visible now.
If someone has a brilliant idea about how to do this without throwing out actual usage data...
Quoted 11 lines
The first thought that comes to mind for me is to make each device be a different color, and otherwise obey the same intensity mapping correlating to how much data is there. For example, if you've got a 3 device FS, the parts of the image that correspond to device 1 would go from
0x000000to0xFF0000, the parts for device 2 could be0x000000to0x00FF00, and the parts for device 3 could be0x000000to0x0000FF. This is of course not perfect (you can't tell what device each segment of empty space corresponds to), but would probably cover most use cases. (for example, with such a scheme, you could look at an image and tell whether the data is relatively well distributed across all the devices or you might need to re-balance).
"most use cases" -> what are those use cases? If you want to know how much total GiB or TiB is present on all devices, a simple btrfs fi show does suffice.
Another option is to just write three images, one for each of the devices. :) Those are more easily compared.
The first idea with color that I had was to use two different colors for data and metadata. When also using separate colors for devices, it might all together become a big mess really quickly, or, maybe a beautiful rainbow.
But, the fun with visualizations of data is that you learn whether they just work(tm) or don't as soon as you see them. Mathematical or algorithmic beauty is not always a good recipe for beauty as seen by the human eye.
So, let's gather a bunch of ideas which we can try out and then observe the result.
Before doing so, I'm going to restructure the code a bit more so I can write another script in the same directory, just doing import heatmap and calling a few functions in there to quickly try stuff, bypassing the normal cli api.
Also, the png writing handling is now done by some random png library that I found, which requires me to build (or copy/resize) an entire pixel grid in memory, explicitely listing all pixel values, which is a bit of a memory hog for bigger pictures, so I want to see if something can be done there also.
Signature · 1 line
Hans van Kranenburg
Re: Btrfs Heatmap - v2 - block group internals!
Quoted 21 lines · Hans van Kranenburg
Quoted 8 lines · Austin S. Hemmelgarn
Quoted 7 lines · Hans van Kranenburg
When generating a picture of a file system with multiple devices, boundaries between the separate devices are not visible now.
If someone has a brilliant idea about how to do this without throwing out actual usage data...
Quoted 11 lines
The first thought that comes to mind for me is to make each device be a different color, and otherwise obey the same intensity mapping correlating to how much data is there. For example, if you've got a 3 device FS, the parts of the image that correspond to device 1 would go from
0x000000to0xFF0000, the parts for device 2 could be0x000000to0x00FF00, and the parts for device 3 could be0x000000to0x0000FF. This is of course not perfect (you can't tell what device each segment of empty space corresponds to), but would probably cover most use cases. (for example, with such a scheme, you could look at an image and tell whether the data is relatively well distributed across all the devices or you might need to re-balance).
Quoted 3 lines
"most use cases" -> what are those use cases? If you want to know how much total GiB or TiB is present on all devices, a simple btrfs fi show does suffice.
Visualizing how the data patterning differs across devices would be the biggest one that comes to mind.
Quoted 3 lines
Another option is to just write three images, one for each of the devices. :) Those are more easily compared.
That would actually be more useful probably, as you can then do pretty much whatever post-processing you want, and it would cover the above use case just as well.
Quoted 5 lines
The first idea with color that I had was to use two different colors for data and metadata. When also using separate colors for devices, it might all together become a big mess really quickly, or, maybe a beautiful rainbow.
I actually like that idea a lot better than using color for differentiating between devices.
Quoted 14 lines
But, the fun with visualizations of data is that you learn whether they just work(tm) or don't as soon as you see them. Mathematical or algorithmic beauty is not always a good recipe for beauty as seen by the human eye.
So, let's gather a bunch of ideas which we can try out and then observe the result.
Before doing so, I'm going to restructure the code a bit more so I can write another script in the same directory, just doing import heatmap and calling a few functions in there to quickly try stuff, bypassing the normal cli api.
Quoted 5 lines
Also, the png writing handling is now done by some random png library that I found, which requires me to build (or copy/resize) an entire pixel grid in memory, explicitely listing all pixel values, which is a bit of a memory hog for bigger pictures, so I want to see if something can be done there also.
I haven't had a chance to look at the code yet, but do you have an option to control how much data a pixel represents? On a multi TB filesystem for example, you may not care about exact data, just an overall view of the data, in which case making each pixel represent a larger chunk of data (and thus reducing the resolution of the image) would almost certainly save some memory on big filesystems.
Re: Btrfs Heatmap - v2 - block group internals!
Ha,
Quoted 21 lines · Austin S. Hemmelgarn
Quoted 15 lines · Hans van Kranenburg
Quoted 1 line · Austin S. Hemmelgarn
On 2016-11-17 13:51, Hans van Kranenburg wrote:
But, the fun with visualizations of data is that you learn whether they just work(tm) or don't as soon as you see them. Mathematical or algorithmic beauty is not always a good recipe for beauty as seen by the human eye.
So, let's gather a bunch of ideas which we can try out and then observe the result.
Before doing so, I'm going to restructure the code a bit more so I can write another script in the same directory, just doing import heatmap and calling a few functions in there to quickly try stuff, bypassing the normal cli api.
Quoted 5 lines
Also, the png writing handling is now done by some random png library that I found, which requires me to build (or copy/resize) an entire pixel grid in memory, explicitely listing all pixel values, which is a bit of a memory hog for bigger pictures, so I want to see if something can be done there also.
Quoted 6 lines
I haven't had a chance to look at the code yet, but do you have an option to control how much data a pixel represents? On a multi TB filesystem for example, you may not care about exact data, just an overall view of the data, in which case making each pixel represent a larger chunk of data (and thus reducing the resolution of the image) would almost certainly save some memory on big filesystems.
--order, which defines the hilbert curve order.
Example: for a 238GiB filesystem, when specifying --order 7, then 2**7 = 128, so 128x128 = 16384 pixels, which means that a single one represents ~16MiB
when --size > --order, the image simply gets scaled up.
When not specifying --order, a number gets chosen automatically with which bytes per pixel is closest to 32MiB.
When size is not specified, it's 10, or same as order if order is greater than 10.
Now this output should make sense:
-# ./heatmap.py /mnt/238GiBmax_id 1 num_devices 1 fsid ed108358-c746-4e76-a071-3820d423a99d nodesize 16384 sectorsize 4096 clone_alignment 4096 scope filesystem curve hilbert order 7 size 10 pngfile fsid_ed10a358-c846-4e76-a071-3821d423a99d_at_1479473532.png grid height 128 width 128 total_bytes 255057723392 bytes_per_pixel 15567488.0 pixels 16384
-# ./heatmap.py /mnt/40TiBmax_id 2 num_devices 2 fsid 9bc9947e-070f-4bbc-872e-49b2a39b3f7b
nodesize 16384 sectorsize 4096 clone_alignment 4096
scope filesystem curve hilbert order 10 size 10 pngfile /home/beheer/heatmap/generated/fsid_9bd9947e-070f-4cbc-8e2e-49b3a39b8f7b_at_1479473950.png grid height 1024 width 1024 total_bytes 46165378727936 bytes_per_pixel 44026736.0 pixels 1048576
Signature · 1 line
Hans van Kranenburg
Re: Btrfs Heatmap - v2 - block group internals!
Quoted 55 lines · Hans van Kranenburg
Ha,
Quoted 21 lines · Austin S. Hemmelgarn
Quoted 15 lines · Hans van Kranenburg
Quoted 1 line · Austin S. Hemmelgarn
On 2016-11-17 13:51, Hans van Kranenburg wrote:
But, the fun with visualizations of data is that you learn whether they just work(tm) or don't as soon as you see them. Mathematical or algorithmic beauty is not always a good recipe for beauty as seen by the human eye.
So, let's gather a bunch of ideas which we can try out and then observe the result.
Before doing so, I'm going to restructure the code a bit more so I can write another script in the same directory, just doing import heatmap and calling a few functions in there to quickly try stuff, bypassing the normal cli api.
Quoted 5 lines
Also, the png writing handling is now done by some random png library that I found, which requires me to build (or copy/resize) an entire pixel grid in memory, explicitely listing all pixel values, which is a bit of a memory hog for bigger pictures, so I want to see if something can be done there also.
Quoted 6 lines
I haven't had a chance to look at the code yet, but do you have an option to control how much data a pixel represents? On a multi TB filesystem for example, you may not care about exact data, just an overall view of the data, in which case making each pixel represent a larger chunk of data (and thus reducing the resolution of the image) would almost certainly save some memory on big filesystems.
--order, which defines the hilbert curve order.
Example: for a 238GiB filesystem, when specifying --order 7, then 2**7 = 128, so 128x128 = 16384 pixels, which means that a single one represents ~16MiB
when --size > --order, the image simply gets scaled up.
When not specifying --order, a number gets chosen automatically with which bytes per pixel is closest to 32MiB.
When size is not specified, it's 10, or same as order if order is greater than 10.
Now this output should make sense:
-# ./heatmap.py
/mnt/238GiBmax_id1num_devices1 fsid ed108358-c746-4e76-a071-3820d423a99d nodesize 16384 sectorsize 4096clone_alignment4096 scope filesystem curve hilbert order 7 size 10 pngfile fsid_ed10a358-c846-4e76-a071-3821d423a99d_at_1479473532.png grid height 128 width 128total_bytes255057723392bytes_per_pixel15567488.0 pixels 16384
Quoted 8 lines
-# ./heatmap.py
/mnt/40TiBmax_id2num_devices2 fsid 9bc9947e-070f-4bbc-872e-49b2a39b3f7b
nodesize 16384 sectorsize 4096clone_alignment4096
scope filesystem curve hilbert order 10 size 10 pngfile/home/beheer/heatmap/generated/fsid_9bd9947e-070f-4cbc-8e2e-49b3a39b8f7b_at_1479473950.pnggrid height 1024 width 1024total_bytes46165378727936bytes_per_pixel44026736.0 pixels 1048576
OK, here's another thought, is it possible to parse smaller chunks of the image at a time, and then use some external tool (ImageMagick maybe?) to stitch those together into the final image? That might also be useful for other reasons too (If you implement it so you can do arbitrary ranges, you could use it to split separate devices into independent images).
Re: Btrfs Heatmap - v2 - block group internals!
In reply to Austin S. HemmelgarnQuoted 27 lines · Austin S. Hemmelgarn
Quoted 26 lines · Hans van Kranenburg
Hey,
Quoted 6 lines · Qu Wenruo
Quoted 4 lines · Hans van Kranenburg
In the last two days I've added the --blockgroup option to btrfs heatmap
to let it create pictures of block group internals.Quoted 8 lines
Quoted 7 lines
Examples and more instructions are to be found in the README at:
https://github.com/knorrie/btrfs-heatmap/blob/master/README.mdTo use the new functionality it needs a fairly recent python-btrfs for the 'skinny'
METADATA_ITEM_KEYto be present. Latest python-btrfs release is v0.3, created yesterday.Wow, really cool!
Thanks!
Quoted 6 lines
I always dream about a visualizing tool to represent the chunk and extent level of btrfs.
This should really save me from reading the boring dec numbers from btrfs-debug-tree.
Quoted 7 lines
Quoted 7 lines
Quoted 3 lines
Although IMHO the full fs output is mixing extent and chunk level together, which makes it a little hard to represent multi-device case, it's still an awesome tool!
The picture of a full filesystem just appends all devices together into one big space, and then walks the
dev_extenttree and associated chunk/blockgroup items for the %used/greyscale value.
My fault, just thought different greyscale means meta/data extents. I got it confused with block group level output.
Then I'm mostly OK.
Just found one small problem.
After specifying --size 16 to output a given block group (small block group, I need large size to make output visible), it takes a full cpu and takes a long long long time to run. So long I don't even want to wait.
I changed size to 10, and it finished much faster.
Is that expected?
Quoted 4 lines
Quoted 4 lines
I don't see what displaying a blockgroup-level aggregate usage number has to do with multi-device, except that the same %usage will appear another time when using RAID1*.
Although in fact, for profiles like RAID0/5/6/10, it's completely possible that one dev_extent contains all the data, while another dev_extent is almost empty. Strictly speaking, at full fs or dev level, we should output things at dev_extent level, then greyscale should be representing dev_extent usage(which is not possible or quite hard to calculate)
Anyway, the greyscale is mostly OK, just as a good addition output for full fs graph.
Although if it could output the fs or specific dev without gray scale, I think it would be better. It will be much clearer about the dev_extent level fragments.
Quoted 7 lines
Quoted 7 lines
When generating a picture of a file system with multiple devices, boundaries between the separate devices are not visible now.
If someone has a brilliant idea about how to do this without throwing out actual usage data...
Quoted 11 lines
The first thought that comes to mind for me is to make each device be a different color, and otherwise obey the same intensity mapping correlating to how much data is there. For example, if you've got a 3 device FS, the parts of the image that correspond to device 1 would go from
0x000000to0xFF0000, the parts for device 2 could be0x000000to0x00FF00, and the parts for device 3 could be0x000000to0x0000FF. This is of course not perfect (you can't tell what device each segment of empty space corresponds to), but would probably cover most use cases. (for example, with such a scheme, you could look at an image and tell whether the data is relatively well distributed across all the devices or you might need to re-balance).
What about linear output separated with lines(or just black)? Like:
X = Used (While)
O = Unallocated (Gray)
= Out of dev range (Black)
|-= Separator (Black)
-----------
| | |X| |X|
| |X|O|O|X|
| |O|O|O|O|
| |X|X|X|X|
|O|X|O|O|X|
-----------
D D D D D
e e e e e
v v v v v
1 2 3 4 5
Or multi vertical line to represent one dev:
----------------
|O |  |X |  |X |
|X |X |O |O |XX|
|XO|O |O |O |OX|
|XO|X |XX|X |XX|
|OX|X |OX|O |XX|
----------------
Thanks,
Qu
Re: Btrfs Heatmap - v2 - block group internals!
Quoted 10 lines · Qu Wenruo
Just found one small problem.
After specifying --size 16 to output a given block group (small block group, I need large size to make output visible), it takes a full cpu and takes a long long long time to run.
So long I don't even want to wait.I changed size to 10, and it finished much faster.
Is that expected?
Yes, hilbert curve size increases exponentially when increasing order.
2**16 = 65536, 65536x65536 = 4294967296 pixels in the png image.
So even if you would have a petabyte filesystem, that would still mean that a single pixel in the image represents only ~ 256kB. I don't think your small block groups are 256kB big?
Specifying values like this does not make any sense at all, and it expected not to work well.
Quoted 7 lines
Quoted 3 lines
Quoted 3 lines
I don't see what displaying a blockgroup-level aggregate usage number has to do with multi-device, except that the same %usage will appear another time when using RAID1*.
Although in fact, for profiles like RAID0/5/6/10, it's completely possible that one
dev_extentcontains all the data, while anotherdev_extentis almost empty.
When using something like RAID0 profile, I would expect 50% of the data to end up in one dev_extent and 50% in the other?
Quoted 3 lines
Strictly speaking, at full fs or dev level, we should output things at
dev_extentlevel, then greyscale should be representingdev_extentusage(which is not possible or quite hard to calculate)
That's what it's doing now?
Quoted 2 lines
Anyway, the greyscale is mostly OK, just as a good addition output for full fs graph.
I don't follow.
Quoted 3 lines
Although if it could output the fs or specific dev without gray scale, I think it would be better.
It will be much clearer about thedev_extentlevel fragments.
I have no idea what you mean, sorry.
Quoted 18 lines
Quoted 6 lines
Quoted 6 lines
When generating a picture of a file system with multiple devices, boundaries between the separate devices are not visible now.
If someone has a brilliant idea about how to do this without throwing out actual usage data...
Quoted 11 lines
The first thought that comes to mind for me is to make each device be a different color, and otherwise obey the same intensity mapping correlating to how much data is there. For example, if you've got a 3 device FS, the parts of the image that correspond to device 1 would go from
0x000000to0xFF0000, the parts for device 2 could be0x000000to0x00FF00, and the parts for device 3 could be0x000000to0x0000FF. This is of course not perfect (you can't tell what device each segment of empty space corresponds to), but would probably cover most use cases. (for example, with such a scheme, you could look at an image and tell whether the data is relatively well distributed across all the devices or you might need to re-balance).
Quoted 1 line
What about linear output separated with lines(or just black)?
Linear output does not produce useful images, except for really small filesystems.
Signature · 1 line
Hans van Kranenburg
Re: Btrfs Heatmap - v2 - block group internals!
Quoted 19 lines · Hans van Kranenburg
Quoted 18 lines · Qu Wenruo
Quoted 17 lines
Quoted 6 lines
When generating a picture of a file system with multiple devices, boundaries between the separate devices are not visible now.
If someone has a brilliant idea about how to do this without throwing out actual usage data...
The first thought that comes to mind for me is to make each device be a different color, and otherwise obey the same intensity mapping correlating to how much data is there. For example, if you've got a 3 device FS, the parts of the image that correspond to device 1 would go from
0x000000to0xFF0000, the parts for device 2 could be0x000000to0x00FF00, and the parts for device 3 could be0x000000to0x0000FF. This is of course not perfect (you can't tell what device each segment of empty space corresponds to), but would probably cover most use cases. (for example, with such a scheme, you could look at an image and tell whether the data is relatively well distributed across all the devices or you might need to re-balance).
Quoted 4 lines
Quoted 1 line
What about linear output separated with lines(or just black)?
Linear output does not produce useful images, except for really small filesystems.
However, it's how the human brain is hardwired to parse data like this (two data points per item, one for value, one for ordering). That's part of the reason that all known writing systems use a linear arrangement arrangement of symbols to store information (the other parts have to do with things like storage efficiency and error detection (and yes, I'm serious, those do play a part in the evolution of language and writing)).
As an example of why this is important, imagine showing someone who understands the concept of data fragmentation (most people have little to no issue understanding this concept) a heatmap of a filesystem with no space fragmentation at all without explaining that it uses a a Hilbert Curve 2d ordering. Pretty much 100% of people who aren't mathematicians or scientists will look at that and the first thought that will come to their mind is almost certainly going to be along the lines of 'holy crap that's fragmented really bad in this specific area'.
This is the reason that pretty much nothing outside of scientific or mathematical data uses a Hilbert curve based 2d ordering of data (and even then, they almost never use it for final presentation of the data).
Data presentation for something like this in a way that laypeople can understand is hard, but it's also important. Take a look at some of the graphical tools for filesystem defragmentation. The presentation requirements there are pretty similar, and so is the data being conveyed. They all use a grid oriented linear presentation of allocation data. The difference is that they scale up the blocks so that they're easily discernible by sight. This allows them to represent the data in a way that's trivial to explain (read this line-by-line), unlike the Hilbert curve (the data follows a complex folded spiral pattern which is fractal in nature).
Now, I personally have no issue with the Hilbert ordering, but if there were an option to use a linear ordering, I would almost certainly use that instead, simply because I could more easily explain the data to people.
Re: Btrfs Heatmap - v2 - block group internals!
Quoted 5 lines · Austin S. Hemmelgarn
Now, I personally have no issue with the Hilbert ordering, but if there were an option to use a linear ordering, I would almost certainly use that instead, simply because I could more easily explain the data to people.
It's in there, but hidden :)
--curve linear
Signature · 1 line
Hans van Kranenburg
Re: Btrfs Heatmap - v2 - block group internals!
In reply to Hans van KranenburgQuoted 27 lines · Hans van Kranenburg
Quoted 10 lines · Qu Wenruo
Just found one small problem.
After specifying --size 16 to output a given block group (small block group, I need large size to make output visible), it takes a full cpu and takes a long long long time to run.
So long I don't even want to wait.I changed size to 10, and it finished much faster.
Is that expected?
Yes, hilbert curve size increases exponentially when increasing order.
2**16 = 65536, 65536x65536 = 4294967296 pixels in the png image.
So even if you would have a petabyte filesystem, that would still mean that a single pixel in the image represents only ~ 256kB. I don't think your small block groups are 256kB big?
Specifying values like this does not make any sense at all, and it expected not to work well.
Quoted 4 lines
Quoted 3 lines
Quoted 3 lines
I don't see what displaying a blockgroup-level aggregate usage number has to do with multi-device, except that the same %usage will appear another time when using RAID1*.
Quoted 6 lines
Quoted 3 lines
Although in fact, for profiles like RAID0/5/6/10, it's completely possible that one
dev_extentcontains all the data, while anotherdev_extentis almost empty.When using something like RAID0 profile, I would expect 50% of the data to end up in one
dev_extentand 50% in the other?
First I'm mostly OK with current grayscale.
What I'm saying can be considered as nitpicking.
The only concern is, the for full fs output, we are in fact output dev_extents of each device.
In that case, we should output info at the same level of dev_extent.
So if we really need to provide *accurate* gray scale, then we should base on the %usage of a dev extent.
And for 50%/50% assumption for RAID0, it's not true and we can easily create a case where it's 100%/0%
The method is as simple as the following script (Assume the data BG is 1G, and first write will be allcated to offset 0 of the BG)
# Fill 1G BG with 64K files
for i in $(seq -w 0 16383); do
xfs_io -f -c "pwrite 0 64k" $mnt/file_$i
# Sync fs to ensure extent allocation happens
sync
done
# Remove every each file, to create holes
for i in $(seq -w 0 2 16383); do
rm $mnt/file_$i
done
btrfs fi sync $mnt
Then, only the 2nd data stripe has data, while the 1st data stripe are free.
Things will become more complicated when RAID5/6 is involved.
Quoted 10 lines
Quoted 4 lines
Strictly speaking, at full fs or dev level, we should output things at
dev_extentlevel, then greyscale should be representingdev_extentusage(which is not possible or quite hard to calculate)That's what it's doing now?
Quoted 2 lines
Anyway, the greyscale is mostly OK, just as a good addition output for full fs graph.
Quoted 7 lines
I don't follow.
Quoted 3 lines
Although if it could output the fs or specific dev without gray scale, I think it would be better.
It will be much clearer about thedev_extentlevel fragments.I have no idea what you mean, sorry.
The point is, for full fs or per-device output, a developer may focus on the fragments of unallocated space in each device.
In that case, an almost empty bg will be much like unallocated space.
So I hope if there is any option to disable greyscale at full fs output, it would be much better.
Just like the blockgroup output, only black and while, and the example in the github is really awesome!
It shows a lot of thing I didn't have a clear view before.
Like batched metadata extents (mostly for csum tree) and fragmented metadata for other trees.
Thanks,
Qu
Quoted 24 lines
Quoted 19 lines
Quoted 7 lines
Quoted 7 lines
When generating a picture of a file system with multiple devices, boundaries between the separate devices are not visible now.
If someone has a brilliant idea about how to do this without throwing out actual usage data...
Quoted 11 lines
The first thought that comes to mind for me is to make each device be a different color, and otherwise obey the same intensity mapping correlating to how much data is there. For example, if you've got a 3 device FS, the parts of the image that correspond to device 1 would go from
0x000000to0xFF0000, the parts for device 2 could be0x000000to0x00FF00, and the parts for device 3 could be0x000000to0x0000FF. This is of course not perfect (you can't tell what device each segment of empty space corresponds to), but would probably cover most use cases. (for example, with such a scheme, you could look at an image and tell whether the data is relatively well distributed across all the devices or you might need to re-balance).Quoted 1 line
What about linear output separated with lines(or just black)?
Linear output does not produce useful images, except for really small filesystems.
Re: Btrfs Heatmap - v2 - block group internals!
Hi,
Quoted 24 lines · Qu Wenruo
Quoted 11 lines · Hans van Kranenburg
Quoted 7 lines · Qu Wenruo
Quoted 3 lines
Quoted 3 lines
I don't see what displaying a blockgroup-level aggregate usage number has to do with multi-device, except that the same %usage will appear another time when using RAID1*.
Although in fact, for profiles like RAID0/5/6/10, it's completely possible that one
dev_extentcontains all the data, while anotherdev_extentis almost empty.When using something like RAID0 profile, I would expect 50% of the data to end up in one
dev_extentand 50% in the other?First I'm mostly OK with current grayscale.
What I'm saying can be considered as nitpicking.The only concern is, the for full fs output, we are in fact output
dev_extentsof each device.In that case, we should output info at the same level of
dev_extent.So if we really need to provide *accurate* gray scale, then we should base on the %usage of a dev extent.
Quoted 7 lines
And for 50%/50% assumption for RAID0, it's not true and we can easily create a case where it's 100%/0%
[...]
Then, only the 2nd data stripe has data, while the 1st data stripe are free.
Ah, yes, I see, that's a good example.
So technically, for others than single and RAID1, just using the blockgroup usage might be wrong. OTOH, for most cases it will still be "correct enough" for the eye, because statistically seen, distribution of data over the stripes will be more uniform more often than not. It's good to realize, but I'm fine with having this as a "known limitation".
Quoted 1 line
Things will become more complicated when RAID5/6 is involved.
Yes.
So being able to show a specific dev extent with the actual info (sorted by physical byte location) would be a nice addition. Since it also requires walking the extent tree for the related block group and doing calculations on the ranges, it's not feasible for the high level file system picture to do.
Quoted 15 lines
Quoted 15 lines
Quoted 3 lines
Strictly speaking, at full fs or dev level, we should output things at
dev_extentlevel, then greyscale should be representingdev_extentusage(which is not possible or quite hard to calculate)That's what it's doing now?
Quoted 2 lines
Anyway, the greyscale is mostly OK, just as a good addition output for full fs graph.
I don't follow.
Quoted 3 lines
Although if it could output the fs or specific dev without gray scale, I think it would be better.
It will be much clearer about thedev_extentlevel fragments.
Quoted 6 lines
Quoted 1 line
I have no idea what you mean, sorry.
The point is, for full fs or per-device output, a developer may focus on the fragments of unallocated space in each device.
In that case, an almost empty bg will be much like unallocated space.
The usage (from 0 to 100) is translated into a brightness between 16 and 255, which already causes empty allocated space to be visually distinguishable from unallocated space:
def _brightness(self, used_pct):
return 16 + int(round(used_pct * (255 - 16)))
If you need it to be more clear, just increase the value to more than 16 and voila.
Quoted 2 lines
So I hope if there is any option to disable greyscale at full fs output, it would be much better.
It's just some python, don't hesitate to change it and try things out.
def _brightness(self, used_pct):
+ return 255
- return 16 + int(round(used_pct * (255 - 16)))
Et voila, 0% used is bright white now. The experience of the resulting image is really different, but if it helps in certain situations, it's quite easy to get it done.
Quoted 6 lines
Just like the blockgroup output, only black and while, and the example in the github is really awesome!
It shows a lot of thing I didn't have a clear view before. Like batched metadata extents (mostly for csum tree) and fragmented metadata for other trees.
:D
First thing I want to do with the blockgrouplevel pics is make a "rolling heatmap" of the 4 highest vaddr blockgroups combined of the filesystem that this thread was about:
http://www.spinics.net/lists/linux-btrfs/msg54940.html
First I'm going to disable autodefrag again, take a picture a few times per hour, let it run for a few days, and then do the same thing again with autodefrag enabled. (spoiler: even with autodefrag enabled, it's a disaster)
But the resulting timelapse videos will show really interesting information on the behaviour of autodefrag I guess. Can't wait to see them.
Signature · 1 line
Hans van Kranenburg