perf changes for v4.9
Subsystems (9)
Linus,
Please pull the latest perf-core-for-linus git tree from:
git://git.kernel.org/pub/scm/linux/kernel/git/tip/tip.git perf-core-for-linus
# HEAD: 41aad2a6d4fcdda8d73c9739daf7a9f3f49499d6 Merge tag 'perf-core-for-mingo-20160929' of git://git.kernel.org/pub/scm/linux/kernel/git/acme/linux into perf/core
The main kernel side changes were:
- uprobes enhancements (Masami Hiramatsu)
- Uncore group events enhancements (David Carrillo-Cisneros)
- x86 Intel: Add support for Skylake server uncore PMUs (Kan Liang)
- x86 Intel: LBR cleanups and enhancements, for better branch annotation tracking (Peter Zijlstra)
- x86 Intel: Add support for PTWRITE and power event tracing (Alexander Shishkin)
- ... various fixes, cleanups and smaller enhancements.
Lots of tooling changes - a couple of highlights:
- Support event group view with hierarchy mode in 'perf top' and 'perf report' (Namhyung Kim)
e.g.:
   $ perf record -e '{cycles,instructions}' make
   $ perf report --hierarchy --stdio
   ...
   #   Overhead  Command / Shared Object / Symbol
   # ......................  ..................................
   ...
   25.74%  27.18%sh
   19.96%  24.14%libc-2.24.so
    9.55%  14.64%[.] __strcmp_sse2
    1.54%   0.00%[.] __tfind
    1.07%   1.13%[.] _int_malloc
    0.95%   0.00%[.] __strchr_sse2
    0.89%   1.39%[.] __tsearch
    0.76%   0.00%[.] strlen
- Add branch stack / basic block info to 'perf annotate --stdio', where for each branch, we add an asm comment after the instruction with information on how often it was taken and predicted. See example with color output at:
http://vger.kernel.org/~acme/perf/annotate_basic_blocks.png
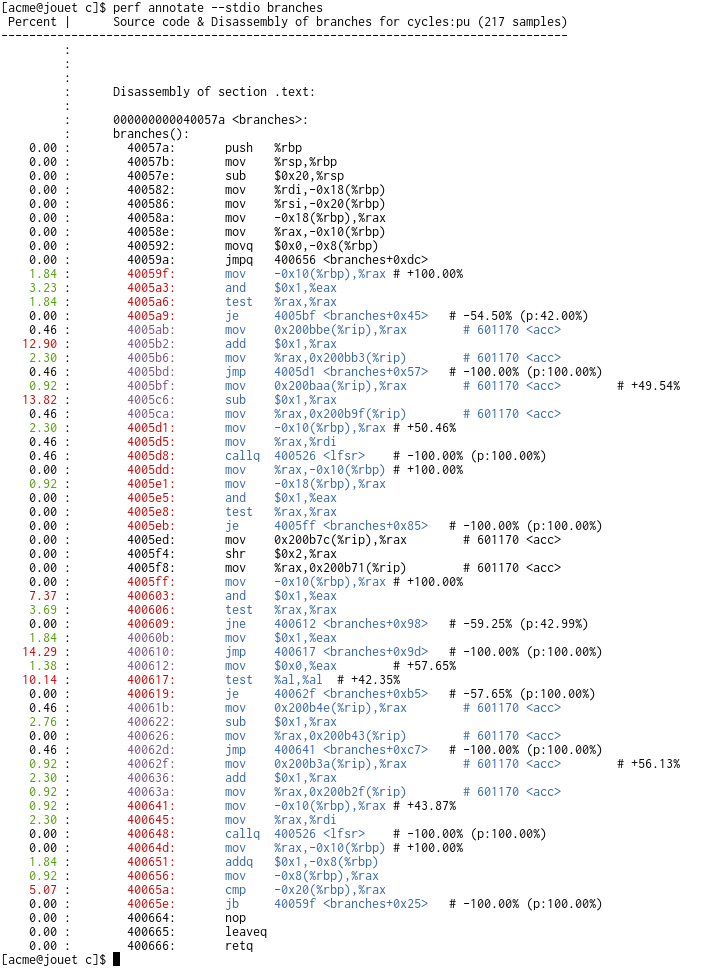
(Peter Zijlstra)
- Add support for using symbols in address filters with Intel PT and ARM CoreSight (hardware assisted tracing facilities) (Adrian Hunter, Mathieu Poirier)
- Add support for interacting with Coresight PMU ETMs/PTMs, that are IP blocks to perform hardware assisted tracing on a ARM CPU core (Mathieu Poirier)
- Support generating cross arch probes, i.e. if you specify a vmlinux file for different arch than the one in the host machine,
$ perf probe --definition function_name args
will generate the probe definition string needed to append to the target machine /sys/kernel/debug/tracing/kprobes_events file, using scripting (Masami Hiramatsu).
- Allow configuring the default 'perf report -s' sort order in ~/.perfconfig, for instance, "sym,dso" may be more fitting for kernel developers. (Arnaldo Carvalho de Melo)
- ... plus lots of other changes, refactorings, features and fixes.
Thanks,
Ingo
------------------>
Adrian Hunter (16):
perf record: Fix documentation 'event_sources' -> 'event_source' perf tools: Fix MMAP event synthesis broken by MAP_HUGETLB change perf script: Fix vanished idle symbols
perf record: Rename label 'out_symbol_exit'
perf record: Fix error paths
perf symbols: Add dso__last_symbol()
perf record: Add support for using symbols in address filters perf probe: Increase debug level of SDT debug messages perf intel-pt: Fix snapshot overlap detection decoder errors perf intel-pt: Add support for recording the max non-turbo ratio perf intel-pt: Fix missing error codes processing auxtrace_info perf intel-pt: Add a helper function for processing AUXTRACE_INFO perf intel-pt: Record address filter in AUXTRACE_INFO event perf intel-pt: Read address filter from AUXTRACE_INFO event perf intel-pt: Enable decoder to handle TIP.PGD with missing IP perf intel-pt: Fix decoding when there are address filters
Alexander Shishkin (1):
perf/x86/intel/pt: Add support for PTWRITE and power event tracing
Arnaldo Carvalho de Melo (35):
tools: Introduce tools/include/linux/time64.h for *SEC_PER_*SEC macros perf bench numa: Use NSEC_PER_U?SEC
perf sched: Use linux/time64.h
perf timechart: Use NSEC_PER_U?SEC
perf bench sched-pipe: Use linux/time64.h, USEC_PER_SEC
perf stat: Use *SEC_PER_*SEC macros
perf bench mem: Use USEC_PER_SEC
perf bench sched-messaging: Use USEC_PER_MSEC
perf record: Use USEC_PER_MSEC
perf kvm: Use NSEC_PER_USEC
perf bench futex: Use NSEC_PER_USEC
perf top: Use MSEC_PER_SEC
perf disassemble: Move check for kallsyms + !kcore
perf disassemble: Simplify logic for picking the filename to disassemble perf disassemble: Extract logic to find file to pass to objdump to a separate function perf report: Allow configuring the default sort order in ~/.perfconfig perf annotate: Initialize the priv are in symbol__new()
perf symbols: Rename ->ignore to ->idle
perf probe: Do not use map_load filters for function
perf test vmlinux: Clarify which -v lines are errors or warning
perf test vmlinux: Avoid printing headers for empty lists
perf test vmlinux: Tolerate symbol aliases
perf symbols: Check symbol_conf.allow_aliases for kallsyms loading too perf symbols: Fixup symbol sizes before picking best ones
perf symbols: Mark if a symbol is idle in the library
perf top: Remove old kernel-only symbol filter
perf machine: Remove machine->symbol_filter and friends
perf test vmlinux: Remove dead symbol_filter_t code
perf symbols: Remove symbol_filter_t machinery
perf probe: Fix dwarf regs table for x86_64
perf trace beauty mmap: Fix defines for non !x86_64
perf tools: Do hugetlb handling in more systems
perf annotate: Pass the symbol's map/dso to the instruction parsers perf annotate: Resolve 'call' operands to function names
perf trace: Beautify sched_[gs]et_attr return value
Colin Ian King (5):
      perf hists browser: Remove superfluous null check on map
      perf tools: Fix typo: "ehough" -> "enough"
      perf test bpf: Fix typo: "ehough" -> "enough"
      perf bpf: Fix typo: "ehough" -> "enough"
      perf record: Fix spelling mistake "Finshed" -> "Finished"
David Carrillo-Cisneros (3):
perf/core: Generalize event->group_flags perf/core: Introduce PMU_EV_CAP_READ_ACTIVE_PKG perf/x86: Use PMUEF_READ_CPU_PKG in uncore events
Harry Pan (1):
perf/x86/rapl: Enable Apollo Lake RAPL support
Jiri Olsa (17):
perf/x86: Fix PEBS threshold initialization
perf hists: Introduce nr_header_lines into struct perf_hpp_list perf hists: Add line argument into perf_hpp_fmt's header callback perf tools tui: Display multiple header lines
perf tools stdio: Display multiple header lines
perf hists: Add support for header span
perf hists: Fix width computation for srcline sort entry perf symbols: Do not open device files
perf evsel: Remove superfluous initialization of weight perf hists: Use bigger buffer for stdio headers
perf hists: Add __hist_entry__snprintf function
perf tools: Make reset_dimensions global
perf tools: Make output_field_add and sort_dimension__add global perf tools: Make several sorting functions global
perf tools: Make several display functions global
perf hists: Make __hist_entry__snprintf function global perf hists: Make hists__fprintf_headers function global
Kan Liang (2):
perf/x86/intel/uncore: Remove hard-coded implementation for Node ID mapping location perf/x86/intel/uncore: Add Skylake server uncore support
Madhavan Srinivasan (1):
bitmap.h, perf/core: Fix the mask in perf_output_sample_regs()
Mark Rutland (3):
perf/core: Sched out groups atomically
perf evlist: Only open events on CPUs an evsel permits perf pmu: Support alternative sysfs cpumask
Masami Hiramatsu (15):
ftrace: kprobe: uprobe: Add x8/x16/x32/x64 for hexadecimal types
ftrace: probe: Add README entries for k/uprobe-events perf probe: Add supported for type casting by the running kernel perf probe: Support hexadecimal casting
perf probe: Use hexadecimal type by default if possible
ftrace: kprobe: uprobe: Show u8/u16/u32/u64 types in decimal perf probe: Remove unused tracing_dir variable
perf probe: Show trace event definition
perf probe: Ignore vmlinux buildid if offline kernel is given perf probe: Support probing on offline cross-arch binary perf probe: Ignore vmlinux Build-id when offline vmlinux given perf probe: Ignore the error of finding inline instance perf probe: Skip if the function address is 0
perf probe: Fix to cut off incompatible chars from group name perf probe: Match linkage name with mangled name
Mathieu Poirier (11):
tools: Copy coresight-pmu.h header file needed by perf tools perf tools: Add infrastructure for PMU specific configuration perf tools: Confine __get_cpuid() to x86 architecture perf tools: Make coresight PMU listable
perf tools: Add coresight etm PMU record capabilities perf pmu: Push configuration down to PMU driver perf tools: Add PMU configuration to tools
perf tools: Add sink configuration for cs_etm PMU perf tools: Make perf_evsel__append_filter() generic perf evsel: New tracepoint specific function
perf evsel: Add support for address filters
Milian Wolff (2):
perf symbols: Demangle symbols for synthesized @plt entries. perf config: Show default report configuration in example and docs
Namhyung Kim (9):
perf hists browser: Fix event group display perf hists: Introduce hists__match_hierarchy() perf hists: Introduce hists__link_hierarchy() perf hist: Initialize hierarchy tree explicitly perf ui/stdio: Always reset output width for hierarchy perf ui/stdio: Rename print_hierarchy_header() perf report: Enable group view with hierarchy perf ui/tui: Reset output width for hierarchy perf hists: Factor out hists__reset_column_width()
Oleg Nesterov (1):
uprobes: Rename the "struct page *" args of __replace_page()
Peter Zijlstra (7):
perf/x86/intel: Rework the large PEBS setup code
perf/x86: Ensure perf_sched_cb_{inc,dec}() is only called from pmu::{add,del}() perf/x86/intel: Eliminate dead code in intel_pmu_lbr_del() perf/x86/intel: Remove redundant test from intel_pmu_lbr_add() perf/x86/intel: Clean up LBR state tracking
perf/core: Optimize perf_pmu_sched_task()
perf annotate: Add branch stack / basic block
Ravi Bangoria (6):
perf probe: Add helper function to check if probe with variable perf uprobe: Skip prologue if program compiled without optimization perf probe: Move dwarf specific functions to dwarf-aux.c perf powerpc: Fix build-test failure
perf annotate: Do not ignore call instruction with indirect target perf tests: Add dwarf unwind test for powerpc
Rui Teng (2):
perf tools: Use __weak definition from linux/compiler.h perf tools: Skip running the feature tests for 'make install-doc'
Shawn Lin (1):
perf tools: Fix error handling of lzma decompression
Simon Que (1):
perf tools: Update documentation info about quipper
Stephane Eranian (1):
perf/x86/intel/uncore: Handle non-standard counter offset
Wang Nan (8):
perf tools: Recognize hugetlb mapping as anon mapping tools lib api fs: Add hugetlbfs filesystem detector perf record: Mark MAP_HUGETLB when synthesizing mmap events tools include: Add uapi mman.h for each architecture perf build: Compare mman.h related headers against kernel originals perf trace beauty mmap: Add missing MADV_FREE
tools include: Add mman macros needed by perf for all arch perf data: Fix building in 32 bit platform with libbabeltrace
Will Deacon (1):
perf/core: Don't pass PERF_EF_START to the PMU ->start callback
 Documentation/trace/kprobetrace.txt                |   9 +-
 Documentation/trace/uprobetracer.txt               |   9 +-
 MAINTAINERS                                        |   5 +
 arch/x86/events/core.c                             |  24 +-
 arch/x86/events/intel/core.c                       |  31 +-
 arch/x86/events/intel/ds.c                         | 108 ++-
 arch/x86/events/intel/lbr.c                        |  70 +-
 arch/x86/events/intel/pt.c                         |  24 +-
 arch/x86/events/intel/pt.h                         |   5 +
 arch/x86/events/intel/rapl.c                       |   4 +
 arch/x86/events/intel/uncore.c                     |  11 +-
 arch/x86/events/intel/uncore.h                     |   7 +
 arch/x86/events/intel/uncore_snb.c                 |   2 +
 arch/x86/events/intel/uncore_snbep.c               | 626 ++++++++++++++++-
 arch/x86/events/perf_event.h                       |  13 +-
 include/linux/bitmap.h                             |  18 +
 include/linux/perf_event.h                         |  24 +-
 kernel/events/core.c                               |  99 ++-
 kernel/events/uprobes.c                            |  36 +-
 kernel/trace/trace.c                               |  24 +
 kernel/trace/trace_kprobe.c                        |   4 +
 kernel/trace/trace_probe.c                         |  30 +-
 kernel/trace/trace_probe.h                         |  11 +-
 kernel/trace/trace_uprobe.c                        |   4 +
 tools/arch/alpha/include/uapi/asm/mman.h           |  47 ++
 tools/arch/arc/include/uapi/asm/mman.h             |   6 +
 tools/arch/arm/include/uapi/asm/mman.h             |   6 +
 tools/arch/arm64/include/uapi/asm/mman.h           |   6 +
 tools/arch/frv/include/uapi/asm/mman.h             |   6 +
 tools/arch/h8300/include/uapi/asm/mman.h           |   6 +
 tools/arch/hexagon/include/uapi/asm/mman.h         |   6 +
 tools/arch/ia64/include/uapi/asm/mman.h            |   6 +
 tools/arch/m32r/include/uapi/asm/mman.h            |   6 +
 tools/arch/microblaze/include/uapi/asm/mman.h      |   6 +
 tools/arch/mips/include/uapi/asm/mman.h            |  46 ++
 tools/arch/mn10300/include/uapi/asm/mman.h         |   6 +
 tools/arch/parisc/include/uapi/asm/mman.h          |  47 ++
 tools/arch/powerpc/include/uapi/asm/mman.h         |  15 +
 tools/arch/s390/include/uapi/asm/mman.h            |   6 +
 tools/arch/score/include/uapi/asm/mman.h           |   6 +
 tools/arch/sh/include/uapi/asm/mman.h              |   6 +
 tools/arch/sparc/include/uapi/asm/mman.h           |  15 +
 tools/arch/tile/include/uapi/asm/mman.h            |  15 +
 tools/arch/x86/include/uapi/asm/mman.h             |   5 +
 tools/arch/xtensa/include/uapi/asm/mman.h          |  47 ++
 tools/include/linux/coresight-pmu.h                |  39 ++
 tools/include/linux/time64.h                       |  12 +
 tools/include/uapi/asm-generic/mman-common.h       |  75 +++
 tools/include/uapi/asm-generic/mman.h              |  22 +
 tools/include/uapi/linux/mman.h                    |  13 +
 tools/lib/api/fs/fs.c                              |  15 +
 tools/lib/api/fs/fs.h                              |   1 +
 tools/perf/Documentation/perf-config.txt           |  12 +
 tools/perf/Documentation/perf-probe.txt            |  14 +-
 tools/perf/Documentation/perf-record.txt           |  73 +-
 tools/perf/Documentation/perf.data-file-format.txt |   6 +-
 tools/perf/Documentation/perfconfig.example        |   9 +
 tools/perf/MANIFEST                                |   6 +
 tools/perf/Makefile.config                         |  11 +-
 tools/perf/Makefile.perf                           |  14 +-
 tools/perf/arch/arm/include/dwarf-regs-table.h     |   9 +
 tools/perf/arch/arm/util/Build                     |   2 +
 tools/perf/arch/arm/util/auxtrace.c                |  54 ++
 tools/perf/arch/arm/util/cs-etm.c                  | 617 +++++++++++++++++
 tools/perf/arch/arm/util/cs-etm.h                  |  26 +
 tools/perf/arch/arm/util/pmu.c                     |  36 +
 tools/perf/arch/arm64/include/dwarf-regs-table.h   |  13 +
 tools/perf/arch/arm64/util/Build                   |   4 +
 tools/perf/arch/powerpc/Build                      |   1 +
 tools/perf/arch/powerpc/include/arch-tests.h       |  13 +
 tools/perf/arch/powerpc/include/dwarf-regs-table.h |  27 +
 tools/perf/arch/powerpc/include/perf_regs.h        |   2 +
 tools/perf/arch/powerpc/tests/Build                |   4 +
 tools/perf/arch/powerpc/tests/arch-tests.c         |  15 +
 tools/perf/arch/powerpc/tests/dwarf-unwind.c       |  62 ++
 tools/perf/arch/powerpc/tests/regs_load.S          |  94 +++
 tools/perf/arch/powerpc/util/sym-handling.c        |   2 +-
 tools/perf/arch/s390/include/dwarf-regs-table.h    |   8 +
 tools/perf/arch/sh/include/dwarf-regs-table.h      |  25 +
 tools/perf/arch/sparc/include/dwarf-regs-table.h   |  18 +
 tools/perf/arch/x86/include/dwarf-regs-table.h     |  14 +
 tools/perf/arch/x86/util/intel-pt.c                |  57 +-
 tools/perf/arch/xtensa/include/dwarf-regs-table.h  |   8 +
 tools/perf/bench/futex-requeue.c                   |   5 +-
 tools/perf/bench/futex-wake-parallel.c             |   5 +-
 tools/perf/bench/futex-wake.c                      |   5 +-
 tools/perf/bench/mem-functions.c                   |   3 +-
 tools/perf/bench/numa.c                            |  53 +-
 tools/perf/bench/sched-messaging.c                 |   5 +-
 tools/perf/bench/sched-pipe.c                      |   9 +-
 tools/perf/builtin-annotate.c                      | 111 +++-
 tools/perf/builtin-diff.c                          |   4 +-
 tools/perf/builtin-inject.c                        |   2 +-
 tools/perf/builtin-kmem.c                          |  10 +-
 tools/perf/builtin-kvm.c                           |  11 +-
 tools/perf/builtin-probe.c                         |  35 +-
 tools/perf/builtin-record.c                        |  50 +-
 tools/perf/builtin-report.c                        |  11 +-
 tools/perf/builtin-sched.c                         |  37 +-
 tools/perf/builtin-script.c                        |  11 +-
 tools/perf/builtin-stat.c                          |  28 +-
 tools/perf/builtin-timechart.c                     |  13 +-
 tools/perf/builtin-top.c                           |  52 +-
 tools/perf/builtin-trace.c                         |  11 +-
 tools/perf/perf-sys.h                              |   1 -
 tools/perf/perf.h                                  |   7 -
 tools/perf/tests/Build                             |   2 +-
 tools/perf/tests/backward-ring-buffer.c            |   2 +-
 tools/perf/tests/bpf.c                             |   2 +-
 tools/perf/tests/code-reading.c                    |   4 +-
 tools/perf/tests/dwarf-unwind.c                    |   2 +-
 tools/perf/tests/vmlinux-kallsyms.c                |  61 +-
 tools/perf/trace/beauty/mmap.c                     |  72 +-
 tools/perf/ui/browsers/annotate.c                  |   2 +-
 tools/perf/ui/browsers/hists.c                     |  59 +-
 tools/perf/ui/browsers/map.c                       |   4 +-
 tools/perf/ui/gtk/hists.c                          |   2 +-
 tools/perf/ui/hist.c                               |  21 +-
 tools/perf/ui/stdio/hist.c                         |  82 +--
 tools/perf/util/Build                              |   3 +
 tools/perf/util/annotate.c                         | 226 +++++--
 tools/perf/util/annotate.h                         |   4 +-
 tools/perf/util/auxtrace.c                         | 738 +++++++++++++++++++++
 tools/perf/util/auxtrace.h                         |  55 ++
 tools/perf/util/block-range.c                      | 328 +++++++++
 tools/perf/util/block-range.h                      |  71 ++
 tools/perf/util/bpf-loader.c                       |   2 +-
 tools/perf/util/build-id.c                         |   4 +-
 tools/perf/util/cs-etm.h                           |  74 +++
 tools/perf/util/data-convert-bt.c                  |   2 +-
 tools/perf/util/debug.c                            |  10 +-
 tools/perf/util/drv_configs.c                      |  77 +++
 tools/perf/util/drv_configs.h                      |  26 +
 tools/perf/util/dso.c                              |   3 +
 tools/perf/util/dwarf-aux.c                        | 207 +++++-
 tools/perf/util/dwarf-aux.h                        |  11 +
 tools/perf/util/dwarf-regs.c                       |  59 ++
 tools/perf/util/event.c                            |  21 +-
 tools/perf/util/evlist.c                           |   8 +-
 tools/perf/util/evsel.c                            |  18 +-
 tools/perf/util/evsel.h                            |   7 +-
 tools/perf/util/evsel_fprintf.c                    |   7 +-
 tools/perf/util/header.c                           |   3 +-
 tools/perf/util/hist.c                             | 154 ++++-
 tools/perf/util/hist.h                             |   9 +-
 tools/perf/util/include/dwarf-regs.h               |   6 +
 tools/perf/util/intel-bts.c                        |   2 +-
 .../perf/util/intel-pt-decoder/intel-pt-decoder.c  |  30 +
 .../perf/util/intel-pt-decoder/intel-pt-decoder.h  |   1 +
 tools/perf/util/intel-pt.c                         | 176 ++++-
 tools/perf/util/intel-pt.h                         |   4 +-
 tools/perf/util/lzma.c                             |  15 +-
 tools/perf/util/machine.c                          |  38 +-
 tools/perf/util/machine.h                          |  34 +-
 tools/perf/util/map.c                              |  45 +-
 tools/perf/util/map.h                              |  32 +-
 tools/perf/util/parse-events.c                     |  48 +-
 tools/perf/util/parse-events.h                     |   1 +
 tools/perf/util/parse-events.l                     |  22 +
 tools/perf/util/parse-events.y                     |  11 +
 tools/perf/util/pmu.c                              |  15 +-
 tools/perf/util/pmu.h                              |   2 +
 tools/perf/util/probe-event.c                      | 126 ++--
 tools/perf/util/probe-event.h                      |   3 +
 tools/perf/util/probe-file.c                       |  64 +-
 tools/perf/util/probe-file.h                       |  10 +
 tools/perf/util/probe-finder.c                     |  96 ++-
 tools/perf/util/probe-finder.h                     |   1 +
 .../perf/util/scripting-engines/trace-event-perl.c |   5 +-
 .../util/scripting-engines/trace-event-python.c    |   5 +-
 tools/perf/util/sort.c                             |  25 +-
 tools/perf/util/sort.h                             |  14 +-
 tools/perf/util/svghelper.c                        |  11 +-
 tools/perf/util/symbol-elf.c                       | 118 ++--
 tools/perf/util/symbol-minimal.c                   |   4 +-
 tools/perf/util/symbol.c                           | 179 +++--
 tools/perf/util/symbol.h                           |  26 +-
 tools/perf/util/util.c                             |   1 +
 tools/perf/util/util.h                             |   4 -
 179 files changed, 6053 insertions(+), 988 deletions(-)
 create mode 100644 tools/arch/alpha/include/uapi/asm/mman.h
 create mode 100644 tools/arch/arc/include/uapi/asm/mman.h
 create mode 100644 tools/arch/arm/include/uapi/asm/mman.h
 create mode 100644 tools/arch/arm64/include/uapi/asm/mman.h
 create mode 100644 tools/arch/frv/include/uapi/asm/mman.h
 create mode 100644 tools/arch/h8300/include/uapi/asm/mman.h
 create mode 100644 tools/arch/hexagon/include/uapi/asm/mman.h
 create mode 100644 tools/arch/ia64/include/uapi/asm/mman.h
 create mode 100644 tools/arch/m32r/include/uapi/asm/mman.h
 create mode 100644 tools/arch/microblaze/include/uapi/asm/mman.h
 create mode 100644 tools/arch/mips/include/uapi/asm/mman.h
 create mode 100644 tools/arch/mn10300/include/uapi/asm/mman.h
 create mode 100644 tools/arch/parisc/include/uapi/asm/mman.h
 create mode 100644 tools/arch/powerpc/include/uapi/asm/mman.h
 create mode 100644 tools/arch/s390/include/uapi/asm/mman.h
 create mode 100644 tools/arch/score/include/uapi/asm/mman.h
 create mode 100644 tools/arch/sh/include/uapi/asm/mman.h
 create mode 100644 tools/arch/sparc/include/uapi/asm/mman.h
 create mode 100644 tools/arch/tile/include/uapi/asm/mman.h
 create mode 100644 tools/arch/x86/include/uapi/asm/mman.h
 create mode 100644 tools/arch/xtensa/include/uapi/asm/mman.h
 create mode 100644 tools/include/linux/coresight-pmu.h
 create mode 100644 tools/include/linux/time64.h
 create mode 100644 tools/include/uapi/asm-generic/mman-common.h
 create mode 100644 tools/include/uapi/asm-generic/mman.h
 create mode 100644 tools/include/uapi/linux/mman.h
 create mode 100644 tools/perf/arch/arm/include/dwarf-regs-table.h
 create mode 100644 tools/perf/arch/arm/util/auxtrace.c
 create mode 100644 tools/perf/arch/arm/util/cs-etm.c
 create mode 100644 tools/perf/arch/arm/util/cs-etm.h
 create mode 100644 tools/perf/arch/arm/util/pmu.c
 create mode 100644 tools/perf/arch/arm64/include/dwarf-regs-table.h
 create mode 100644 tools/perf/arch/powerpc/include/arch-tests.h
 create mode 100644 tools/perf/arch/powerpc/include/dwarf-regs-table.h
 create mode 100644 tools/perf/arch/powerpc/tests/Build
 create mode 100644 tools/perf/arch/powerpc/tests/arch-tests.c
 create mode 100644 tools/perf/arch/powerpc/tests/dwarf-unwind.c
 create mode 100644 tools/perf/arch/powerpc/tests/regs_load.S
 create mode 100644 tools/perf/arch/s390/include/dwarf-regs-table.h
 create mode 100644 tools/perf/arch/sh/include/dwarf-regs-table.h
 create mode 100644 tools/perf/arch/sparc/include/dwarf-regs-table.h
 create mode 100644 tools/perf/arch/x86/include/dwarf-regs-table.h
 create mode 100644 tools/perf/arch/xtensa/include/dwarf-regs-table.h
 create mode 100644 tools/perf/util/block-range.c
 create mode 100644 tools/perf/util/block-range.h
 create mode 100644 tools/perf/util/cs-etm.h
 create mode 100644 tools/perf/util/drv_configs.c
 create mode 100644 tools/perf/util/drv_configs.h
 create mode 100644 tools/perf/util/dwarf-regs.c
Documentation/trace/kprobetrace.txt +6 -3
@@ -44,8 +44,8 @@ Synopsis of kprobe_events +|-offs(FETCHARG) : Fetch memory at FETCHARG +|- offs address.(**) NAME=FETCHARG : Set NAME as the argument name of FETCHARG. FETCHARG:TYPE : Set TYPE as the type of FETCHARG. Currently, basic types - (u8/u16/u32/u64/s8/s16/s32/s64), "string" and bitfield - are supported. + (u8/u16/u32/u64/s8/s16/s32/s64), hexadecimal types + (x8/x16/x32/x64), "string" and bitfield are supported. (*) only for return probe. (**) this is useful for fetching a field of data structures.
@@ -54,7 +54,10 @@ Types
 -----
 Several types are supported for fetch-args. Kprobe tracer will access memory
 by given type. Prefix 's' and 'u' means those types are signed and unsigned
-respectively. Traced arguments are shown in decimal (signed) or hex (unsigned).
+respectively. 'x' prefix implies it is unsigned. Traced arguments are shown
+in decimal ('s' and 'u') or hexadecimal ('x'). Without type casting, 'x32'
+or 'x64' is used depends on the architecture (e.g. x86-32 uses x32, and
+x86-64 uses x64).
 String type is a special type, which fetches a "null-terminated" string from
 kernel space. This means it will fail and store NULL if the string container
 has been paged out.
Documentation/trace/uprobetracer.txt +6 -3
@@ -40,8 +40,8 @@ Synopsis of uprobe_tracer +|-offs(FETCHARG) : Fetch memory at FETCHARG +|- offs address.(**) NAME=FETCHARG : Set NAME as the argument name of FETCHARG. FETCHARG:TYPE : Set TYPE as the type of FETCHARG. Currently, basic types - (u8/u16/u32/u64/s8/s16/s32/s64), "string" and bitfield - are supported. + (u8/u16/u32/u64/s8/s16/s32/s64), hexadecimal types + (x8/x16/x32/x64), "string" and bitfield are supported. (*) only for return probe. (**) this is useful for fetching a field of data structures.
@@ -50,7 +50,10 @@ Types
 -----
 Several types are supported for fetch-args. Uprobe tracer will access memory
 by given type. Prefix 's' and 'u' means those types are signed and unsigned
-respectively. Traced arguments are shown in decimal (signed) or hex (unsigned).
+respectively. 'x' prefix implies it is unsigned. Traced arguments are shown
+in decimal ('s' and 'u') or hexadecimal ('x'). Without type casting, 'x32'
+or 'x64' is used depends on the architecture (e.g. x86-32 uses x32, and
+x86-64 uses x64).
 String type is a special type, which fetches a "null-terminated" string from
 user space.
 Bitfield is another special type, which takes 3 parameters, bit-width, bit-
MAINTAINERS +5 -0
@@ -1123,6 +1123,11 @@ F: drivers/hwtracing/coresight/* F: Documentation/trace/coresight.txt F: Documentation/devicetree/bindings/arm/coresight.txt F: Documentation/ABI/testing/sysfs-bus-coresight-devices-* +F: tools/perf/arch/arm/util/pmu.c +F: tools/perf/arch/arm/util/auxtrace.c +F: tools/perf/arch/arm/util/cs-etm.c +F: tools/perf/arch/arm/util/cs-etm.h +F: tools/perf/util/cs-etm.h ARM/CORGI MACHINE SUPPORT M: Richard Purdie <[email protected]>
arch/x86/events/core.c +22 -2
@@ -1201,6 +1201,9 @@ static int x86_pmu_add(struct perf_event *event, int flags)* If group events scheduling transaction was started, * skip the schedulability test here, it will be performed * at commit time (->commit_txn) as a whole. +* +* If commit fails, we'll call ->del() on all events +* for which ->add() was called. */ if (cpuc->txn_flags &PERF_PMU_TXN_ADD ) goto done_collect;
@@ -1223,6 +1226,14 @@ static int x86_pmu_add(struct perf_event *event, int flags) cpuc->n_added += n - n0; cpuc->n_txn += n - n0; +if (x86_pmu.add) { +/* +* This is before x86_pmu_enable() will call x86_pmu_start(), +* so we enable LBRs before an event needs them etc.. +*/ + x86_pmu.add (event); + } + ret =0 ; out:return ret;
@@ -1346,7 +1357,7 @@ static void x86_pmu_del(struct perf_event *event, int flags) event->hw.flags &= ~PERF_X86_EVENT_COMMITTED ;/* -* If we're called during a txn, we don't need to do anything. +* If we're called during a txn, we only need to undo x86_pmu.add. * The events never got scheduled and ->cancel_txn will truncate * the event_list. *
@@ -1354,7 +1365,7 @@ static void x86_pmu_del(struct perf_event *event, int flags)* an event added during that same TXN. */ if (cpuc->txn_flags &PERF_PMU_TXN_ADD ) -return ; + goto do_del;/* * Not a TXN, therefore cleanup properly.
@@ -1384,6 +1395,15 @@ static void x86_pmu_del(struct perf_event *event, int flags) --cpuc->n_events;perf_event_update_userpage (event); + +do_del: +if (x86_pmu.del) { +/* +* This is after x86_pmu_stop(); so we disable LBRs after any +* event can need them etc.. +*/ + x86_pmu.del (event); + } }int x86_pmu_handle_irq (struct pt_regs *regs)
arch/x86/events/intel/core.c +18 -13
@@ -1906,13 +1906,6 @@ static void intel_pmu_disable_event(struct perf_event *event) cpuc->intel_ctrl_host_mask &= ~(1ull << hwc->idx); cpuc->intel_cp_status &= ~(1ull << hwc->idx); -/* -* must disable before any actual event -* because any event may be combined with LBR -*/ -if (needs_branch_stack (event)) -intel_pmu_lbr_disable (event); -if (unlikely (hwc->config_base ==MSR_ARCH_PERFMON_FIXED_CTR_CTRL )) {intel_pmu_disable_fixed (hwc);return ;
@@ -1924,6 +1917,14 @@ static void intel_pmu_disable_event(struct perf_event *event)intel_pmu_pebs_disable (event); } +static void intel_pmu_del_event (struct perf_event *event) +{ +if (needs_branch_stack (event)) +intel_pmu_lbr_del (event); +if (event->attr.precise_ip) +intel_pmu_pebs_del (event); +} +static void intel_pmu_enable_fixed (struct hw_perf_event *hwc) {int idx = hwc->idx -INTEL_PMC_IDX_FIXED ;
@@ -1967,12 +1968,6 @@ static void intel_pmu_enable_event(struct perf_event *event)intel_pmu_enable_bts (hwc->config);return ; } -/* -* must enabled before any actual event -* because any event may be combined with LBR -*/ -if (needs_branch_stack (event)) -intel_pmu_lbr_enable (event);if (event->attr.exclude_host) cpuc->intel_ctrl_guest_mask |= (1ull << hwc->idx);
@@ -1993,6 +1988,14 @@ static void intel_pmu_enable_event(struct perf_event *event)__x86_pmu_enable_event (hwc,ARCH_PERFMON_EVENTSEL_ENABLE ); } +static void intel_pmu_add_event (struct perf_event *event) +{ +if (event->attr.precise_ip) +intel_pmu_pebs_add (event); +if (needs_branch_stack (event)) +intel_pmu_lbr_add (event); +} +/* * Save and restart an expired event. Called by NMI contexts, * so it has to be careful about preempting normal event ops:
@@ -3291,6 +3294,8 @@ static __initconst const struct x86_pmu intel_pmu = {
 	.enable_all		= intel_pmu_enable_all,
 	.enable			= intel_pmu_enable_event,
 	.disable		= intel_pmu_disable_event,
+	.add			= intel_pmu_add_event,
+	.del			= intel_pmu_del_event,
 	.hw_config		= intel_pmu_hw_config,
 	.schedule_events	= x86_schedule_events,
 	.eventsel		= MSR_ARCH_PERFMON_EVENTSEL0,
arch/x86/events/intel/ds.c +73 -35
149 lines not on this page · raw message
arch/x86/events/intel/lbr.c +32 -38
116 lines not on this page · raw message
arch/x86/events/intel/pt.c +23 -1
@@ -69,6 +69,8 @@ static struct pt_cap_desc {PT_CAP (psb_cyc,0 ,CR_EBX ,BIT (1 )),PT_CAP (ip_filtering,0 ,CR_EBX ,BIT (2 )),PT_CAP (mtc,0 ,CR_EBX ,BIT (3 )), +PT_CAP (ptwrite,0 ,CR_EBX ,BIT (4 )), +PT_CAP (power_event_trace,0 ,CR_EBX ,BIT (5 )),PT_CAP (topa_output,0 ,CR_ECX ,BIT (0 )),PT_CAP (topa_multiple_entries,0 ,CR_ECX ,BIT (1 )), PT_CAP(single_range_output, 0, CR_ECX, BIT(2)),
@@ -259,10 +261,16 @@ static int __init pt_pmu_hw_init(void)#define RTIT_CTL_MTC (RTIT_CTL_MTC_EN | \ RTIT_CTL_MTC_RANGE) +#define RTIT_CTL_PTW (RTIT_CTL_PTW_EN | \ + RTIT_CTL_FUP_ON_PTW) +#define PT_CONFIG_MASK (RTIT_CTL_TSC_EN | \ RTIT_CTL_DISRETC | \ RTIT_CTL_CYC_PSB | \ - RTIT_CTL_MTC) + RTIT_CTL_MTC | \ + RTIT_CTL_PWR_EVT_EN | \ + RTIT_CTL_FUP_ON_PTW | \ + RTIT_CTL_PTW_EN)static bool pt_event_valid (struct perf_event *event) {
@@ -311,6 +319,20 @@ static bool pt_event_valid(struct perf_event *event)return false; } +if (config &RTIT_CTL_PWR_EVT_EN && + !pt_cap_get (PT_CAP_power_event_trace)) +return false; + +if (config &RTIT_CTL_PTW ) { +if (!pt_cap_get (PT_CAP_ptwrite)) +return false; + +/* FUPonPTW without PTW doesn't make sense */ +if ((config &RTIT_CTL_FUP_ON_PTW ) && + !(config &RTIT_CTL_PTW_EN )) +return false; + } +return true; }
arch/x86/events/intel/pt.h +5 -0
@@ -26,11 +26,14 @@#define RTIT_CTL_CYCLEACC BIT(1)#define RTIT_CTL_OS BIT(2)#define RTIT_CTL_USR BIT(3) +#define RTIT_CTL_PWR_EVT_EN BIT(4) +#define RTIT_CTL_FUP_ON_PTW BIT(5)#define RTIT_CTL_CR3EN BIT(7)#define RTIT_CTL_TOPA BIT(8)#define RTIT_CTL_MTC_EN BIT(9)#define RTIT_CTL_TSC_EN BIT(10)#define RTIT_CTL_DISRETC BIT(11) +#define RTIT_CTL_PTW_EN BIT(12)#define RTIT_CTL_BRANCH_EN BIT(13)#define RTIT_CTL_MTC_RANGE_OFFSET 14#define RTIT_CTL_MTC_RANGE (0x0full << RTIT_CTL_MTC_RANGE_OFFSET)
@@ -91,6 +94,8 @@ enum pt_capabilities {
 	PT_CAP_psb_cyc,
 	PT_CAP_ip_filtering,
 	PT_CAP_mtc,
+	PT_CAP_ptwrite,
+	PT_CAP_power_event_trace,
 	PT_CAP_topa_output,
 	PT_CAP_topa_multiple_entries,
 	PT_CAP_single_range_output,
arch/x86/events/intel/rapl.c +4 -0
@@ -357,6 +357,8 @@ static int rapl_pmu_event_init(struct perf_event *event)if (event->cpu <0 )return -EINVAL ; + event->event_caps |=PERF_EV_CAP_READ_ACTIVE_PKG ; +/* * check event is known (determines counter) */
@@ -765,6 +767,8 @@ static const struct x86_cpu_id rapl_cpu_match[] __initconst = {X86_RAPL_MODEL_MATCH (INTEL_FAM6_SKYLAKE_MOBILE , skl_rapl_init),X86_RAPL_MODEL_MATCH (INTEL_FAM6_SKYLAKE_DESKTOP , skl_rapl_init),X86_RAPL_MODEL_MATCH (INTEL_FAM6_SKYLAKE_X , hsx_rapl_init), + + X86_RAPL_MODEL_MATCH(INTEL_FAM6_ATOM_GOLDMONT, hsw_rapl_init), {}, };
arch/x86/events/intel/uncore.c +10 -1
@@ -664,6 +664,8 @@ static int uncore_pmu_event_init(struct perf_event *event) event->cpu = box->cpu; event->pmu_private = box; + event->event_caps |=PERF_EV_CAP_READ_ACTIVE_PKG ; + event->hw.idx =-1 ; event->hw.last_tag = ~0ULL ; event->hw.extra_reg.idx =EXTRA_REG_NONE ;
@@ -683,7 +685,8 @@ static int uncore_pmu_event_init(struct perf_event *event)/* fixed counters have event field hardcoded to zero */ hwc->config =0ULL ; }else { - hwc->config = event->attr.config & pmu->type->event_mask; + hwc->config = event->attr.config & + (pmu->type->event_mask | ((u64 )pmu->type->event_mask_ext <<32 ));if (pmu->type->ops->hw_config) { ret = pmu->type->ops->hw_config (box, event);if (ret)
@@ -1321,6 +1324,11 @@ static const struct intel_uncore_init_fun skl_uncore_init __initconst = { .pci_init = skl_uncore_pci_init, }; +static const struct intel_uncore_init_fun skx_uncore_init__initconst = { + .cpu_init = skx_uncore_cpu_init, + .pci_init = skx_uncore_pci_init, +}; +static const struct x86_cpu_id intel_uncore_match[]__initconst = {X86_UNCORE_MODEL_MATCH (INTEL_FAM6_NEHALEM_EP , nhm_uncore_init),X86_UNCORE_MODEL_MATCH (INTEL_FAM6_NEHALEM , nhm_uncore_init),
@@ -1343,6 +1351,7 @@ static const struct x86_cpu_id intel_uncore_match[] __initconst = {X86_UNCORE_MODEL_MATCH (INTEL_FAM6_XEON_PHI_KNL , knl_uncore_init),X86_UNCORE_MODEL_MATCH (INTEL_FAM6_SKYLAKE_DESKTOP ,skl_uncore_init),X86_UNCORE_MODEL_MATCH (INTEL_FAM6_SKYLAKE_MOBILE , skl_uncore_init), + X86_UNCORE_MODEL_MATCH(INTEL_FAM6_SKYLAKE_X, skx_uncore_init), {}, };
arch/x86/events/intel/uncore.h +7 -0
@@ -44,6 +44,7 @@ struct intel_uncore_type {unsigned perf_ctr;unsigned event_ctl;unsigned event_mask; +unsigned event_mask_ext;unsigned fixed_ctr;unsigned fixed_ctl;unsigned box_ctl;
@@ -120,6 +121,7 @@ struct intel_uncore_box { };#define UNCORE_BOX_FLAG_INITIATED 0 +#define UNCORE_BOX_FLAG_CTL_OFFS8 1/* event config registers are 8-byte apart */ struct uncore_event_desc {struct kobj_attribute attr;
@@ -172,6 +174,9 @@ static inline unsigned uncore_pci_fixed_ctr(struct intel_uncore_box *box)static inline unsigned uncore_pci_event_ctl (struct intel_uncore_box *box,int idx) { +if (test_bit (UNCORE_BOX_FLAG_CTL_OFFS8 , &box->flags)) +return idx *8 + box->pmu->type->event_ctl; +return idx *4 + box->pmu->type->event_ctl; }
@@ -377,6 +382,8 @@ int bdx_uncore_pci_init(void);void bdx_uncore_cpu_init (void );int knl_uncore_pci_init (void );void knl_uncore_cpu_init (void ); +int skx_uncore_pci_init (void ); +void skx_uncore_cpu_init (void );/* perf_event_intel_uncore_nhmex.c */ void nhmex_uncore_cpu_init (void );
arch/x86/events/intel/uncore_snb.c +2 -0
@@ -388,6 +388,8 @@ static int snb_uncore_imc_event_init(struct perf_event *event) event->cpu = box->cpu; event->pmu_private = box; + event->event_caps |=PERF_EV_CAP_READ_ACTIVE_PKG ; + event->hw.idx =-1 ; event->hw.last_tag = ~0ULL ; event->hw.extra_reg.idx =EXTRA_REG_NONE ;
arch/x86/events/intel/uncore_snbep.c +614 -12
720 lines not on this page · raw message
arch/x86/events/perf_event.h +10 -3
@@ -194,12 +194,13 @@ struct cpu_hw_events {*/ struct debug_store *ds;u64 pebs_enabled; +int n_pebs; +int n_large_pebs;/* * Intel LBR bits */ int lbr_users; -void *lbr_context;struct perf_branch_stack lbr_stack;struct perf_branch_entry lbr_entries[MAX_LBR_ENTRIES ];struct er_account *lbr_sel;
@@ -508,6 +509,8 @@ struct x86_pmu {void (*enable_all)(int added);void (*enable)(struct perf_event *);void (*disable)(struct perf_event *); +void (*add)(struct perf_event *); +void (*del)(struct perf_event *);int (*hw_config)(struct perf_event *event);int (*schedule_events)(struct cpu_hw_events *cpuc,int n,int *assign);unsigned eventsel;
@@ -888,6 +891,10 @@ extern struct event_constraint intel_skl_pebs_event_constraints[];struct event_constraint *intel_pebs_constraints (struct perf_event *event); +void intel_pmu_pebs_add (struct perf_event *event); + +void intel_pmu_pebs_del (struct perf_event *event); +void intel_pmu_pebs_enable (struct perf_event *event);void intel_pmu_pebs_disable (struct perf_event *event);
@@ -906,9 +913,9 @@ u64 lbr_from_signext_quirk_wr(u64 val);void intel_pmu_lbr_reset (void ); -void intel_pmu_lbr_enable (struct perf_event *event); +void intel_pmu_lbr_add (struct perf_event *event); -void intel_pmu_lbr_disable (struct perf_event *event); +void intel_pmu_lbr_del (struct perf_event *event);void intel_pmu_lbr_enable_all (bool pmi);
include/linux/bitmap.h +18 -0
@@ -339,6 +339,24 @@ static inline int bitmap_parse(const char *buf, unsigned int buflen,return __bitmap_parse (buf, buflen,0 , maskp, nmaskbits); } +/* +* bitmap_from_u64 - Check and swap words within u64. +* @mask: source bitmap +* @dst: destination bitmap +* +* In 32-bit Big Endian kernel, when using (u32 *)(&val)[*] +* to read u64 mask, we will get the wrong word. +* That is "(u32 *)(&val)[0]" gets the upper 32 bits, +* but we expect the lower 32-bits of u64. +*/ +static inline void bitmap_from_u64 (unsigned long *dst,u64 mask) +{ + dst[0 ] = mask &ULONG_MAX ; + +if (sizeof (mask) >sizeof (unsigned long )) + dst[1 ] = mask >>32 ; +} +#endif /* __ASSEMBLY__ */ #endif /* __LINUX_BITMAP_H */
include/linux/perf_event.h +19 -5
@@ -510,9 +510,15 @@ typedef void (*perf_overflow_handler_t)(struct perf_event *, struct perf_sample_data *, struct pt_regs *regs); -enum perf_group_flag { -PERF_GROUP_SOFTWARE =0x1 , -}; +/* +* Event capabilities. For event_caps and groups caps. +* +* PERF_EV_CAP_SOFTWARE: Is a software event. +* PERF_EV_CAP_READ_ACTIVE_PKG: A CPU event (or cgroup event) that can be read +* from any CPU in the package where it is active. +*/ +#define PERF_EV_CAP_SOFTWARE BIT(0) +#define PERF_EV_CAP_READ_ACTIVE_PKG BIT(1)#define SWEVENT_HLIST_BITS 8#define SWEVENT_HLIST_SIZE (1 << SWEVENT_HLIST_BITS)
@@ -568,7 +574,12 @@ struct perf_event {struct hlist_node hlist_entry;struct list_head active_entry;int nr_siblings; -int group_flags; + +/* Not serialized. Only written during event initialization. */ +int event_caps; +/* The cumulative AND of all event_caps for events in this group. */ +int group_caps; +struct perf_event *group_leader;struct pmu *pmu;void *pmu_private;
@@ -774,6 +785,9 @@ struct perf_cpu_context {#ifdef CONFIG_CGROUP_PERF struct perf_cgroup *cgrp;#endif + +struct list_head sched_cb_entry; +int sched_cb_usage; };struct perf_output_handle {
@@ -985,7 +999,7 @@ static inline bool is_sampling_event(struct perf_event *event)*/ static inline int is_software_event (struct perf_event *event) { -return event->pmu->task_ctx_nr == perf_sw_context; +return event->event_caps &PERF_EV_CAP_SOFTWARE ; }extern struct static_key perf_swevent_enabled[PERF_COUNT_SW_MAX ];
kernel/events/core.c +67 -32
224 lines not on this page · raw message
kernel/events/uprobes.c +18 -18
@@ -150,7 +150,7 @@ static loff_t vaddr_to_offset(struct vm_area_struct *vma, unsigned long vaddr)* Returns 0 on success, -EFAULT on failure. */ static int __replace_page (struct vm_area_struct *vma,unsigned long addr, -struct page *page,struct page *kpage) +struct page *old_page,struct page *new_page) {struct mm_struct *mm = vma->vm_mm;spinlock_t *ptl;
@@ -161,49 +161,49 @@ static int __replace_page(struct vm_area_struct *vma, unsigned long addr,const unsigned long mmun_end = addr +PAGE_SIZE ;struct mem_cgroup *memcg; - err =mem_cgroup_try_charge (kpage, vma->vm_mm,GFP_KERNEL , &memcg, + err =mem_cgroup_try_charge (new_page, vma->vm_mm,GFP_KERNEL , &memcg, false);if (err)return err;/* For try_to_free_swap() and munlock_vma_page() below */ -lock_page (page); +lock_page (old_page);mmu_notifier_invalidate_range_start (mm, mmun_start, mmun_end); err = -EAGAIN ; - ptep =page_check_address (page, mm, addr, &ptl,0 ); + ptep =page_check_address (old_page, mm, addr, &ptl,0 );if (!ptep) { -mem_cgroup_cancel_charge (kpage, memcg, false); +mem_cgroup_cancel_charge (new_page, memcg, false); goto unlock; } -get_page (kpage); -page_add_new_anon_rmap (kpage, vma, addr, false); -mem_cgroup_commit_charge (kpage, memcg, false, false); -lru_cache_add_active_or_unevictable (kpage, vma); +get_page (new_page); +page_add_new_anon_rmap (new_page, vma, addr, false); +mem_cgroup_commit_charge (new_page, memcg, false, false); +lru_cache_add_active_or_unevictable (new_page, vma); -if (!PageAnon (page)) { -dec_mm_counter (mm,mm_counter_file (page)); +if (!PageAnon (old_page)) { +dec_mm_counter (mm,mm_counter_file (old_page));inc_mm_counter (mm,MM_ANONPAGES ); }flush_cache_page (vma, addr,pte_pfn (*ptep));ptep_clear_flush_notify (vma, addr, ptep); -set_pte_at_notify (mm, addr, ptep,mk_pte (kpage, vma->vm_page_prot)); +set_pte_at_notify (mm, addr, ptep,mk_pte (new_page, vma->vm_page_prot)); -page_remove_rmap (page, false); -if (!page_mapped (page)) -try_to_free_swap (page); +page_remove_rmap (old_page, false); +if (!page_mapped (old_page)) +try_to_free_swap (old_page);pte_unmap_unlock (ptep, ptl);if (vma->vm_flags &VM_LOCKED ) -munlock_vma_page (page); -put_page (page); +munlock_vma_page (old_page); +put_page (old_page); err =0 ; unlock:mmu_notifier_invalidate_range_end (mm, mmun_start, mmun_end); -unlock_page (page); +unlock_page (old_page);return err; }
kernel/trace/trace.c +24 -0
@@ -4123,6 +4123,30 @@ static const char readme_msg[] = "\t\t\t traces\n"#endif #endif /* CONFIG_STACK_TRACER */ +#ifdef CONFIG_KPROBE_EVENT +" kprobe_events\t\t- Add/remove/show the kernel dynamic events\n" + "\t\t\t Write into this file to define/undefine new trace events.\n" +#endif +#ifdef CONFIG_UPROBE_EVENT +" uprobe_events\t\t- Add/remove/show the userspace dynamic events\n" + "\t\t\t Write into this file to define/undefine new trace events.\n" +#endif +#if defined(CONFIG_KPROBE_EVENT ) || defined(CONFIG_UPROBE_EVENT ) +"\t accepts: event-definitions (one definition per line)\n" +"\t Format: p|r[:[<group>/]<event>] <place> [<args>]\n" +"\t -:[<group>/]<event>\n" +#ifdef CONFIG_KPROBE_EVENT + "\t place: [<module>:]<symbol>[+<offset>]|<memaddr>\n" +#endif +#ifdef CONFIG_UPROBE_EVENT +"\t place: <path>:<offset>\n" +#endif +"\t args: <name>=fetcharg[:type]\n" +"\t fetcharg: %<register>, @<address>, @<symbol>[+|-<offset>],\n" +"\t $stack<index>, $stack, $retval, $comm\n" +"\t type: s8/16/32/64, u8/16/32/64, x8/16/32/64, string,\n" + "\t b<bit-width>@<bit-offset>/<container-size>\n" +#endif " events/\t\t- Directory containing all trace event subsystems:\n" " enable\t\t- Write 0/1 to enable/disable tracing of all events\n" " events/<system>/\t- Directory containing all trace events for <system>:\n"
kernel/trace/trace_kprobe.c +4 -0
@@ -253,6 +253,10 @@ static const struct fetch_type kprobes_fetch_type_table[] = {ASSIGN_FETCH_TYPE (s16, u16,1 ),ASSIGN_FETCH_TYPE (s32, u32,1 ),ASSIGN_FETCH_TYPE (s64, u64,1 ), +ASSIGN_FETCH_TYPE_ALIAS (x8, u8, u8,0 ), +ASSIGN_FETCH_TYPE_ALIAS (x16, u16, u16,0 ), +ASSIGN_FETCH_TYPE_ALIAS (x32, u32, u32,0 ), +ASSIGN_FETCH_TYPE_ALIAS (x64, u64, u64,0 ), ASSIGN_FETCH_TYPE_END };
kernel/trace/trace_probe.c +17 -13
@@ -36,24 +36,28 @@ const char *reserved_field_names[] = { };/* Printing in basic type function template */ -#define DEFINE_BASIC_PRINT_TYPE_FUNC (type, fmt) \ -int PRINT_TYPE_FUNC_NAME(type)(struct trace_seq *s, const char *name, \ +#define DEFINE_BASIC_PRINT_TYPE_FUNC (tname, type, fmt) \ +int PRINT_TYPE_FUNC_NAME(tname)(struct trace_seq *s, const char *name, \ void *data, void *ent) \ { \ trace_seq_printf(s, " %s=" fmt, name, *(type *)data); \ return !trace_seq_has_overflowed(s); \ } \ -const char PRINT_TYPE_FMT_NAME(type)[] = fmt; \ -NOKPROBE_SYMBOL(PRINT_TYPE_FUNC_NAME(type)); - -DEFINE_BASIC_PRINT_TYPE_FUNC(u8 , "0x%x") -DEFINE_BASIC_PRINT_TYPE_FUNC(u16, "0x%x") -DEFINE_BASIC_PRINT_TYPE_FUNC(u32, "0x%x") -DEFINE_BASIC_PRINT_TYPE_FUNC(u64, "0x%Lx") -DEFINE_BASIC_PRINT_TYPE_FUNC(s8, "%d") -DEFINE_BASIC_PRINT_TYPE_FUNC(s16, "%d") -DEFINE_BASIC_PRINT_TYPE_FUNC(s32, "%d") -DEFINE_BASIC_PRINT_TYPE_FUNC (s64,"%Ld" ) +const char PRINT_TYPE_FMT_NAME(tname)[] = fmt; \ +NOKPROBE_SYMBOL(PRINT_TYPE_FUNC_NAME(tname)); + +DEFINE_BASIC_PRINT_TYPE_FUNC(u8, u8, "%u") +DEFINE_BASIC_PRINT_TYPE_FUNC(u16, u16, "%u") +DEFINE_BASIC_PRINT_TYPE_FUNC(u32, u32, "%u") +DEFINE_BASIC_PRINT_TYPE_FUNC(u64, u64, "%Lu") +DEFINE_BASIC_PRINT_TYPE_FUNC(s8, s8, "%d") +DEFINE_BASIC_PRINT_TYPE_FUNC(s16, s16, "%d") +DEFINE_BASIC_PRINT_TYPE_FUNC(s32, s32, "%d") +DEFINE_BASIC_PRINT_TYPE_FUNC(s64, s64, "%Ld") +DEFINE_BASIC_PRINT_TYPE_FUNC(x8, u8, "0x%x") +DEFINE_BASIC_PRINT_TYPE_FUNC(x16, u16, "0x%x") +DEFINE_BASIC_PRINT_TYPE_FUNC(x32, u32, "0x%x") +DEFINE_BASIC_PRINT_TYPE_FUNC (x64, u64,"0x%Lx" ) /* Print type function for string type */ int PRINT_TYPE_FUNC_NAME(string)(struct trace_seq *s, const char *name,
kernel/trace/trace_probe.h +10 -1
@@ -149,6 +149,11 @@ DECLARE_BASIC_PRINT_TYPE_FUNC(s8);DECLARE_BASIC_PRINT_TYPE_FUNC (s16);DECLARE_BASIC_PRINT_TYPE_FUNC (s32);DECLARE_BASIC_PRINT_TYPE_FUNC (s64); +DECLARE_BASIC_PRINT_TYPE_FUNC (x8); +DECLARE_BASIC_PRINT_TYPE_FUNC (x16); +DECLARE_BASIC_PRINT_TYPE_FUNC (x32); +DECLARE_BASIC_PRINT_TYPE_FUNC (x64); +DECLARE_BASIC_PRINT_TYPE_FUNC (string);#define FETCH_FUNC_NAME (method, type) fetch_##method##_##type
@@ -203,7 +208,7 @@ DEFINE_FETCH_##method(u32) \ DEFINE_FETCH_##method(u64)/* Default (unsigned long) fetch type */ -#define __DEFAULT_FETCH_TYPE (t) u##t +#define __DEFAULT_FETCH_TYPE (t) x##t#define _DEFAULT_FETCH_TYPE (t) __DEFAULT_FETCH_TYPE(t)#define DEFAULT_FETCH_TYPE _DEFAULT_FETCH_TYPE(BITS_PER_LONG)#define DEFAULT_FETCH_TYPE_STR __stringify(DEFAULT_FETCH_TYPE)
@@ -234,6 +239,10 @@ ASSIGN_FETCH_FUNC(file_offset, ftype), \#define ASSIGN_FETCH_TYPE (ptype, ftype, sign) \ __ASSIGN_FETCH_TYPE(#ptype, ptype, ftype, sizeof(ftype), sign, #ptype) +/* If ptype is an alias of atype, use this macro (show atype in format) */ +#define ASSIGN_FETCH_TYPE_ALIAS (ptype, atype, ftype, sign) \ + __ASSIGN_FETCH_TYPE(#ptype, ptype, ftype, sizeof(ftype), sign, #atype) +#define ASSIGN_FETCH_TYPE_END {}#define FETCH_TYPE_STRING 0
kernel/trace/trace_uprobe.c +4 -0
@@ -211,6 +211,10 @@ static const struct fetch_type uprobes_fetch_type_table[] = {ASSIGN_FETCH_TYPE (s16, u16,1 ),ASSIGN_FETCH_TYPE (s32, u32,1 ),ASSIGN_FETCH_TYPE (s64, u64,1 ), +ASSIGN_FETCH_TYPE_ALIAS (x8, u8, u8,0 ), +ASSIGN_FETCH_TYPE_ALIAS (x16, u16, u16,0 ), +ASSIGN_FETCH_TYPE_ALIAS (x32, u32, u32,0 ), +ASSIGN_FETCH_TYPE_ALIAS (x64, u64, u64,0 ), ASSIGN_FETCH_TYPE_END };
tools/arch/alpha/include/uapi/asm/mman.h new file +47 -0
47 lines not on this page · raw message
tools/arch/arc/include/uapi/asm/mman.h new file +6 -0
@@ -0,0 +1,6 @@ +#ifndef TOOLS_ARCH_ARC_UAPI_ASM_MMAN_FIX_H +#define TOOLS_ARCH_ARC_UAPI_ASM_MMAN_FIX_H +#include <uapi/asm-generic/mman.h> +/* MAP_32BIT is undefined on arc, fix it for perf */ +#define MAP_32BIT 0 +#endif
tools/arch/arm/include/uapi/asm/mman.h new file +6 -0
@@ -0,0 +1,6 @@ +#ifndef TOOLS_ARCH_ARM_UAPI_ASM_MMAN_FIX_H +#define TOOLS_ARCH_ARM_UAPI_ASM_MMAN_FIX_H +#include <uapi/asm-generic/mman.h> +/* MAP_32BIT is undefined on arm, fix it for perf */ +#define MAP_32BIT 0 +#endif
tools/arch/arm64/include/uapi/asm/mman.h new file +6 -0
@@ -0,0 +1,6 @@ +#ifndef TOOLS_ARCH_ARM64_UAPI_ASM_MMAN_FIX_H +#define TOOLS_ARCH_ARM64_UAPI_ASM_MMAN_FIX_H +#include <uapi/asm-generic/mman.h> +/* MAP_32BIT is undefined on arm64, fix it for perf */ +#define MAP_32BIT 0 +#endif
tools/arch/frv/include/uapi/asm/mman.h new file +6 -0
@@ -0,0 +1,6 @@ +#ifndef TOOLS_ARCH_FRV_UAPI_ASM_MMAN_FIX_H +#define TOOLS_ARCH_FRV_UAPI_ASM_MMAN_FIX_H +#include <uapi/asm-generic/mman.h> +/* MAP_32BIT is undefined on frv, fix it for perf */ +#define MAP_32BIT 0 +#endif
tools/arch/h8300/include/uapi/asm/mman.h new file +6 -0
@@ -0,0 +1,6 @@ +#ifndef TOOLS_ARCH_H8300_UAPI_ASM_MMAN_FIX_H +#define TOOLS_ARCH_H8300_UAPI_ASM_MMAN_FIX_H +#include <uapi/asm-generic/mman.h> +/* MAP_32BIT is undefined on h8300, fix it for perf */ +#define MAP_32BIT 0 +#endif
tools/arch/hexagon/include/uapi/asm/mman.h new file +6 -0
@@ -0,0 +1,6 @@ +#ifndef TOOLS_ARCH_HEXAGON_UAPI_ASM_MMAN_FIX_H +#define TOOLS_ARCH_HEXAGON_UAPI_ASM_MMAN_FIX_H +#include <uapi/asm-generic/mman.h> +/* MAP_32BIT is undefined on hexagon, fix it for perf */ +#define MAP_32BIT 0 +#endif
tools/arch/ia64/include/uapi/asm/mman.h new file +6 -0
@@ -0,0 +1,6 @@ +#ifndef TOOLS_ARCH_IA64_UAPI_ASM_MMAN_FIX_H +#define TOOLS_ARCH_IA64_UAPI_ASM_MMAN_FIX_H +#include <uapi/asm-generic/mman.h> +/* MAP_32BIT is undefined on ia64, fix it for perf */ +#define MAP_32BIT 0 +#endif
tools/arch/m32r/include/uapi/asm/mman.h new file +6 -0
@@ -0,0 +1,6 @@ +#ifndef TOOLS_ARCH_M32R_UAPI_ASM_MMAN_FIX_H +#define TOOLS_ARCH_M32R_UAPI_ASM_MMAN_FIX_H +#include <uapi/asm-generic/mman.h> +/* MAP_32BIT is undefined on m32r, fix it for perf */ +#define MAP_32BIT 0 +#endif
tools/arch/microblaze/include/uapi/asm/mman.h new file +6 -0
@@ -0,0 +1,6 @@ +#ifndef TOOLS_ARCH_MICROBLAZE_UAPI_ASM_MMAN_FIX_H +#define TOOLS_ARCH_MICROBLAZE_UAPI_ASM_MMAN_FIX_H +#include <uapi/asm-generic/mman.h> +/* MAP_32BIT is undefined on microblaze, fix it for perf */ +#define MAP_32BIT 0 +#endif
tools/arch/mips/include/uapi/asm/mman.h new file +46 -0
46 lines not on this page · raw message
tools/arch/mn10300/include/uapi/asm/mman.h new file +6 -0
@@ -0,0 +1,6 @@ +#ifndef TOOLS_ARCH_MN10300_UAPI_ASM_MMAN_FIX_H +#define TOOLS_ARCH_MN10300_UAPI_ASM_MMAN_FIX_H +#include <uapi/asm-generic/mman.h> +/* MAP_32BIT is undefined on mn10300, fix it for perf */ +#define MAP_32BIT 0 +#endif
tools/arch/parisc/include/uapi/asm/mman.h new file +47 -0
47 lines not on this page · raw message
tools/arch/powerpc/include/uapi/asm/mman.h new file +15 -0
@@ -0,0 +1,15 @@ +#ifndef TOOLS_ARCH_POWERPC_UAPI_ASM_MMAN_FIX_H +#define TOOLS_ARCH_POWERPC_UAPI_ASM_MMAN_FIX_H +#define MAP_DENYWRITE 0x0800 +#define MAP_EXECUTABLE 0x1000 +#define MAP_GROWSDOWN 0x0100 +#define MAP_HUGETLB 0x40000 +#define MAP_LOCKED 0x80 +#define MAP_NONBLOCK 0x10000 +#define MAP_NORESERVE 0x40 +#define MAP_POPULATE 0x8000 +#define MAP_STACK 0x20000 +#include <uapi/asm-generic/mman-common.h> +/* MAP_32BIT is undefined on powerpc, fix it for perf */ +#define MAP_32BIT 0 +#endif
tools/arch/s390/include/uapi/asm/mman.h new file +6 -0
@@ -0,0 +1,6 @@ +#ifndef TOOLS_ARCH_S390_UAPI_ASM_MMAN_FIX_H +#define TOOLS_ARCH_S390_UAPI_ASM_MMAN_FIX_H +#include <uapi/asm-generic/mman.h> +/* MAP_32BIT is undefined on s390, fix it for perf */ +#define MAP_32BIT 0 +#endif
tools/arch/score/include/uapi/asm/mman.h new file +6 -0
@@ -0,0 +1,6 @@ +#ifndef TOOLS_ARCH_SCORE_UAPI_ASM_MMAN_FIX_H +#define TOOLS_ARCH_SCORE_UAPI_ASM_MMAN_FIX_H +#include <uapi/asm-generic/mman.h> +/* MAP_32BIT is undefined on score, fix it for perf */ +#define MAP_32BIT 0 +#endif
tools/arch/sh/include/uapi/asm/mman.h new file +6 -0
@@ -0,0 +1,6 @@ +#ifndef TOOLS_ARCH_SH_UAPI_ASM_MMAN_FIX_H +#define TOOLS_ARCH_SH_UAPI_ASM_MMAN_FIX_H +#include <uapi/asm-generic/mman.h> +/* MAP_32BIT is undefined on sh, fix it for perf */ +#define MAP_32BIT 0 +#endif
tools/arch/sparc/include/uapi/asm/mman.h new file +15 -0
@@ -0,0 +1,15 @@ +#ifndef TOOLS_ARCH_SPARC_UAPI_ASM_MMAN_FIX_H +#define TOOLS_ARCH_SPARC_UAPI_ASM_MMAN_FIX_H +#define MAP_DENYWRITE 0x0800 +#define MAP_EXECUTABLE 0x1000 +#define MAP_GROWSDOWN 0x0200 +#define MAP_HUGETLB 0x40000 +#define MAP_LOCKED 0x100 +#define MAP_NONBLOCK 0x10000 +#define MAP_NORESERVE 0x40 +#define MAP_POPULATE 0x8000 +#define MAP_STACK 0x20000 +#include <uapi/asm-generic/mman-common.h> +/* MAP_32BIT is undefined on sparc, fix it for perf */ +#define MAP_32BIT 0 +#endif
tools/arch/tile/include/uapi/asm/mman.h new file +15 -0
@@ -0,0 +1,15 @@ +#ifndef TOOLS_ARCH_TILE_UAPI_ASM_MMAN_FIX_H +#define TOOLS_ARCH_TILE_UAPI_ASM_MMAN_FIX_H +#define MAP_DENYWRITE 0x0800 +#define MAP_EXECUTABLE 0x1000 +#define MAP_GROWSDOWN 0x0100 +#define MAP_HUGETLB 0x4000 +#define MAP_LOCKED 0x0200 +#define MAP_NONBLOCK 0x0080 +#define MAP_NORESERVE 0x0400 +#define MAP_POPULATE 0x0040 +#define MAP_STACK MAP_GROWSDOWN +#include <uapi/asm-generic/mman-common.h> +/* MAP_32BIT is undefined on tile, fix it for perf */ +#define MAP_32BIT 0 +#endif
tools/arch/x86/include/uapi/asm/mman.h new file +5 -0
@@ -0,0 +1,5 @@ +#ifndef TOOLS_ARCH_X86_UAPI_ASM_MMAN_FIX_H +#define TOOLS_ARCH_X86_UAPI_ASM_MMAN_FIX_H +#define MAP_32BIT 0x40 +#include <uapi/asm-generic/mman.h> +#endif
tools/arch/xtensa/include/uapi/asm/mman.h new file +47 -0
47 lines not on this page · raw message
tools/include/linux/coresight-pmu.h new file +39 -0
@@ -0,0 +1,39 @@ +/* +* Copyright(C) 2015 Linaro Limited. All rights reserved. +* Author: Mathieu Poirier <[email protected]> +* +* This program is free software; you can redistribute it and/or modify it +* under the terms of the GNU General Public License version 2 as published by +* the Free Software Foundation. +* +* This program is distributed in the hope that it will be useful, but WITHOUT +* ANY WARRANTY; without even the implied warranty of MERCHANTABILITY or +* FITNESS FOR A PARTICULAR PURPOSE. See the GNU General Public License for +* more details. +* +* You should have received a copy of the GNU General Public License along with +* this program. If not, see <http://www.gnu.org/licenses/>. +*/ + +#ifndef _LINUX_CORESIGHT_PMU_H +#define _LINUX_CORESIGHT_PMU_H + +#define CORESIGHT_ETM_PMU_NAME "cs_etm" +#define CORESIGHT_ETM_PMU_SEED 0x10 + +/* ETMv3.5/PTM's ETMCR config bit */ +#define ETM_OPT_CYCACC 12 +#define ETM_OPT_TS 28 + +static inline int coresight_get_trace_id (int cpu) +{ +/* +* A trace ID of value 0 is invalid, so let's start at some +* random value that fits in 7 bits and go from there. Since +* the common convention is to have data trace IDs be I(N) + 1, +* set instruction trace IDs as a function of the CPU number. +*/ +return (CORESIGHT_ETM_PMU_SEED + (cpu *2 )); +} + +#endif
tools/include/linux/time64.h new file +12 -0
@@ -0,0 +1,12 @@ +#ifndef _TOOLS_LINUX_TIME64_H +#define _TOOLS_LINUX_TIME64_H + +#define MSEC_PER_SEC 1000L +#define USEC_PER_MSEC 1000L +#define NSEC_PER_USEC 1000L +#define NSEC_PER_MSEC 1000000L +#define USEC_PER_SEC 1000000L +#define NSEC_PER_SEC 1000000000L +#define FSEC_PER_SEC 1000000000000000LL + +#endif /* _LINUX_TIME64_H */
tools/include/uapi/asm-generic/mman-common.h new file +75 -0
75 lines not on this page · raw message
tools/include/uapi/asm-generic/mman.h new file +22 -0
@@ -0,0 +1,22 @@ +#ifndef __ASM_GENERIC_MMAN_H +#define __ASM_GENERIC_MMAN_H + +#include <uapi/asm-generic/mman-common.h> + +#define MAP_GROWSDOWN 0x0100/* stack-like segment */ +#define MAP_DENYWRITE 0x0800/* ETXTBSY */ +#define MAP_EXECUTABLE 0x1000/* mark it as an executable */ +#define MAP_LOCKED 0x2000/* pages are locked */ +#define MAP_NORESERVE 0x4000/* don't check for reservations */ +#define MAP_POPULATE 0x8000/* populate (prefault) pagetables */ +#define MAP_NONBLOCK 0x10000/* do not block on IO */ +#define MAP_STACK 0x20000/* give out an address that is best suited for process/thread stacks */ +#define MAP_HUGETLB 0x40000/* create a huge page mapping */ + +/* Bits [26:31] are reserved, see mman-common.h for MAP_HUGETLB usage */ + +#define MCL_CURRENT 1/* lock all current mappings */ +#define MCL_FUTURE 2/* lock all future mappings */ +#define MCL_ONFAULT 4/* lock all pages that are faulted in */ + +#endif /* __ASM_GENERIC_MMAN_H */
tools/include/uapi/linux/mman.h new file +13 -0
@@ -0,0 +1,13 @@ +#ifndef _UAPI_LINUX_MMAN_H +#define _UAPI_LINUX_MMAN_H + +#include <uapi/asm/mman.h> + +#define MREMAP_MAYMOVE 1 +#define MREMAP_FIXED 2 + +#define OVERCOMMIT_GUESS 0 +#define OVERCOMMIT_ALWAYS 1 +#define OVERCOMMIT_NEVER 2 + +#endif /* _UAPI_LINUX_MMAN_H */
tools/lib/api/fs/fs.c +15 -0
@@ -34,6 +34,10 @@#define TRACEFS_MAGIC 0x74726163#endif +#ifndef HUGETLBFS_MAGIC +#define HUGETLBFS_MAGIC 0x958458f6 +#endif +static const char *const sysfs__fs_known_mountpoints[] = {"/sys" ,0 ,
@@ -67,6 +71,10 @@ static const char * const tracefs__known_mountpoints[] = { 0, }; +static const char *const hugetlbfs__known_mountpoints[] = { +0 , +}; +struct fs {const char *name;const char *const *mounts;
@@ -80,6 +88,7 @@ enum {FS__PROCFS =1 ,FS__DEBUGFS =2 ,FS__TRACEFS =3 , + FS__HUGETLBFS = 4, };#ifndef TRACEFS_MAGIC
@@ -107,6 +116,11 @@ static struct fs fs__entries[] = { .mounts = tracefs__known_mountpoints, .magic = TRACEFS_MAGIC, }, + [FS__HUGETLBFS] = { + .name = "hugetlbfs", + .mounts = hugetlbfs__known_mountpoints, + .magic = HUGETLBFS_MAGIC, + }, };static bool fs__read_mounts (struct fs *fs)
@@ -265,6 +279,7 @@ FS(sysfs, FS__SYSFS);FS (procfs,FS__PROCFS );FS (debugfs,FS__DEBUGFS );FS (tracefs,FS__TRACEFS ); +FS (hugetlbfs,FS__HUGETLBFS );int filename__read_int (const char *filename,int *value) {
tools/lib/api/fs/fs.h +1 -0
@@ -21,6 +21,7 @@ FS(sysfs) FS(procfs) FS(debugfs) FS(tracefs) +FS(hugetlbfs)#undef FS
tools/perf/Documentation/perf-config.txt +12 -0
@@ -110,6 +110,14 @@ Example order = caller sort-key = function + [report] + # Defaults + sort-order = comm,dso,symbol + percent-limit = 0 + queue-size = 0 + children = true + group = true + Variables ~~~~~~~~~
@@ -382,6 +390,10 @@ Variables
 		histogram entry. Default is 0 which means no limitation.

 report.*::
+	report.sort_order::
+		Allows changing the default sort order from "comm,dso,symbol" to
+		some other default, for instance "sym,dso" may be more fitting for
+		kernel developers.
 	report.percent-limit::
 		This one is mostly the same as call-graph.threshold but works for
 		histogram entries. Entries having an overhead lower than this
tools/perf/Documentation/perf-probe.txt +11 -3
@@ -21,6 +21,8 @@ or 'perf probe' [options] --vars='PROBEPOINT' or 'perf probe' [options] --funcs +or +'perf probe' [options] --definition='PROBE' [...] DESCRIPTION -----------
@@ -34,6 +36,8 @@ OPTIONS
 -k::
 --vmlinux=PATH::
 	Specify vmlinux path which has debuginfo (Dwarf binary).
+	Only when using this with --definition, you can give an offline
+	vmlinux file.

 -m::
 --module=MODNAME|PATH::
@@ -96,6 +100,11 @@ OPTIONS
 	can also list functions in a user space executable / shared library.
 	This also can accept a FILTER rule argument.

+-D::
+--definition=::
+	Show trace-event definition converted from given probe-event instead
+	of write it into tracing/[k,u]probe_events.
+
 --filter=FILTER::
 	(Only for --vars and --funcs) Set filter. FILTER is a combination of glob
 	pattern, see FILTER PATTERN for detail.
@@ -176,13 +185,12 @@ Each probe argument follows below syntax.

 'NAME' specifies the name of this argument (optional). You can use the name of local variable, local data structure member (e.g. var->field, var.field2), local array with fixed index (e.g. array[1], var->array[0], var->pointer[2]), or kprobe-tracer argument format (e.g. $retval, %ax, etc). Note that the name of this argument will be set as the last member name if you specify a local data structure member (e.g. field2 for 'var->field1.field2'.)
 '$vars' and '$params' special arguments are also available for NAME, '$vars' is expanded to the local variables (including function parameters) which can access at given probe point. '$params' is expanded to only the function parameters.
-'TYPE' casts the type of this argument (optional). If omitted, perf probe automatically set the type based on debuginfo. Currently, basic types (u8/u16/u32/u64/s8/s16/s32/s64), signedness casting (u/s), "string" and bitfield are supported. (see TYPES for detail)
-
+'TYPE' casts the type of this argument (optional). If omitted, perf probe automatically set the type based on debuginfo (*). Currently, basic types (u8/u16/u32/u64/s8/s16/s32/s64), hexadecimal integers (x/x8/x16/x32/x64), signedness casting (u/s), "string" and bitfield are supported. (see TYPES for detail)
 On x86 systems %REG is always the short form of the register: for example %AX. %RAX or %EAX is not valid.

 TYPES
 -----
-Basic types (u8/u16/u32/u64/s8/s16/s32/s64) are integer types. Prefix 's' and 'u' means those types are signed and unsigned respectively. Traced arguments are shown in decimal (signed) or hex (unsigned). You can also use 's' or 'u' to specify only signedness and leave its size auto-detected by perf probe.
+Basic types (u8/u16/u32/u64/s8/s16/s32/s64) and hexadecimal integers (x8/x16/x32/x64) are integer types. Prefix 's' and 'u' means those types are signed and unsigned respectively, and 'x' means that is shown in hexadecimal format. Traced arguments are shown in decimal (sNN/uNN) or hex (xNN). You can also use 's' or 'u' to specify only signedness and leave its size auto-detected by perf probe. Moreover, you can use 'x' to explicitly specify to be shown in hexadecimal (the size is also auto-detected).
 String type is a special type, which fetches a "null-terminated" string from kernel space. This means it will fail and store NULL if the string container has been paged out. You can specify 'string' type only for the local variable or structure member which is an array of or a pointer to 'char' or 'unsigned char' type.
 Bitfield is another special type, which takes 3 parameters, bit-width, bit-offset, and container-size (usually 32). The syntax is;
tools/perf/Documentation/perf-record.txt +69 -4
99 lines not on this page · raw message
tools/perf/Documentation/perf.data-file-format.txt +5 -1
@@ -437,6 +437,10 @@ in pmu-tools parser. This allows to read perf.data from python and dump it. quipper The quipper C++ parser is available at -https://chromium.googlesource.com/chromiumos/platform/chromiumos-wide-profiling/ +https://chromium.googlesource.com/chromiumos/platform2 + +It is under the chromiumos-wide-profiling/ subdirectory. This library can +convert a perf data file to a protobuf and vice versa. + Unfortunately this parser tends to be many versions behind and may not be able to parse data files generated by recent perf.
tools/perf/Documentation/perfconfig.example +9 -0
@@ -27,3 +27,12 @@ use_offset = true jump_arrows = true show_nr_jumps = false + +[report] + + # Defaults + sort-order = comm,dso,symbol + percent-limit = 0 + queue-size = 0 + children = true + group = true
tools/perf/MANIFEST +6 -0
@@ -60,14 +60,18 @@ tools/include/asm-generic/bitops.h tools/include/linux/atomic.h tools/include/linux/bitops.h tools/include/linux/compiler.h +tools/include/linux/coresight-pmu.h tools/include/linux/filter.h tools/include/linux/hash.h tools/include/linux/kernel.h tools/include/linux/list.h tools/include/linux/log2.h +tools/include/uapi/asm-generic/mman-common.h +tools/include/uapi/asm-generic/mman.h tools/include/uapi/linux/bpf.h tools/include/uapi/linux/bpf_common.h tools/include/uapi/linux/hw_breakpoint.h +tools/include/uapi/linux/mman.h tools/include/uapi/linux/perf_event.h tools/include/linux/poison.h tools/include/linux/rbtree.h
@@ -77,4 +81,6 @@ tools/include/linux/stringify.h
 tools/include/linux/types.h
 tools/include/linux/err.h
 tools/include/linux/bitmap.h
+tools/include/linux/time64.h
+tools/arch/*/include/uapi/asm/mman.h
 tools/arch/*/include/uapi/asm/perf_regs.h
tools/perf/Makefile.config +7 -4
@@ -746,10 +746,13 @@ ifdef LIBBABELTRACE endif ifndef NO_AUXTRACE - ifeq ($(feature-get_cpuid), 0) - msg := $(warning Your gcc lacks the __get_cpuid() builtin, disables support for auxtrace/Intel PT, please install a newer gcc); - NO_AUXTRACE := 1 - else + ifeq ($(ARCH),x86) + ifeq ($(feature-get_cpuid), 0) + msg := $(warning Your gcc lacks the __get_cpuid() builtin, disables support for auxtrace/Intel PT, please install a newer gcc); + NO_AUXTRACE := 1 + endif + endif + ifndef NO_AUXTRACE $(call detected,CONFIG_AUXTRACE) CFLAGS += -DHAVE_AUXTRACE_SUPPORT endif
tools/perf/Makefile.perf +13 -1
@@ -165,7 +165,7 @@ SUBCMD_DIR = $(srctree)/tools/lib/subcmd/ # non-config cases config := 1 -NON_CONFIG_TARGETS := clean TAGS tags cscope help +NON_CONFIG_TARGETS := clean TAGS tags cscope help install-doc ifdef MAKECMDGOALS ifeq ($(filter-out $(NON_CONFIG_TARGETS),$(MAKECMDGOALS)),)
@@ -429,6 +429,18 @@ $(PERF_IN): prepare FORCE
 	@(test -f ../../include/asm-generic/bitops/fls64.h && ( \
         (diff -B ../include/asm-generic/bitops/fls64.h ../../include/asm-generic/bitops/fls64.h >/dev/null) \
         || echo "Warning: tools/include/asm-generic/bitops/fls64.h differs from kernel" >&2 )) || true
+	@(test -f ../../include/linux/coresight-pmu.h && ( \
+	(diff -B ../include/linux/coresight-pmu.h ../../include/linux/coresight-pmu.h >/dev/null) \
+	|| echo "Warning: tools/include/linux/coresight-pmu.h differs from kernel" >&2 )) || true
+	@(test -f ../../include/uapi/asm-generic/mman-common.h && ( \
+	(diff -B ../include/uapi/asm-generic/mman-common.h ../../include/uapi/asm-generic/mman-common.h >/dev/null) \
+	|| echo "Warning: tools/include/uapi/asm-generic/mman-common.h differs from kernel" >&2 )) || true
+	@(test -f ../../include/uapi/asm-generic/mman.h && ( \
+	(diff -B -I "^#include <\(uapi/\)*asm-generic/mman-common.h>$$" ../include/uapi/asm-generic/mman.h ../../include/uapi/asm-generic/mman.h >/dev/null) \
+	|| echo "Warning: tools/include/uapi/asm-generic/mman.h differs from kernel" >&2 )) || true
+	@(test -f ../../include/uapi/linux/mman.h && ( \
+	(diff -B -I "^#include <\(uapi/\)*asm/mman.h>$$" ../include/uapi/linux/mman.h ../../include/uapi/linux/mman.h >/dev/null) \
+	|| echo "Warning: tools/include/uapi/linux/mman.h differs from kernel" >&2 )) || true
 	$(Q)$(MAKE) $(build)=perf

 $(OUTPUT)perf: $(PERFLIBS) $(PERF_IN) $(LIBTRACEEVENT_DYNAMIC_LIST)
tools/perf/arch/arm/include/dwarf-regs-table.h new file +9 -0
@@ -0,0 +1,9 @@ +#ifdef DEFINE_DWARF_REGSTR_TABLE +/* This is included in perf/util/dwarf-regs.c */ + +static const char *const arm_regstr_tbl[] = { +"%r0" ,"%r1" ,"%r2" ,"%r3" ,"%r4" , +"%r5" ,"%r6" ,"%r7" ,"%r8" ,"%r9" ,"%r10" , +"%fp" ,"%ip" ,"%sp" ,"%lr" ,"%pc" , +}; +#endif
tools/perf/arch/arm/util/Build +2 -0
@@ -2,3 +2,5 @@ libperf-$(CONFIG_DWARF) += dwarf-regs.o libperf-$(CONFIG_LOCAL_LIBUNWIND) += unwind-libunwind.o libperf-$(CONFIG_LIBDW_DWARF_UNWIND) += unwind-libdw.o + +libperf-$(CONFIG_AUXTRACE) += pmu.o auxtrace.o cs-etm.o
tools/perf/arch/arm/util/auxtrace.c new file +54 -0
54 lines not on this page · raw message
tools/perf/arch/arm/util/cs-etm.c new file +617 -0
306 lines not on this page · raw message
tools/perf/arch/arm/util/cs-etm.h new file +26 -0
Lines of this file are not shown. View the raw message.
tools/perf/arch/arm/util/pmu.c new file +36 -0
Lines of this file are not shown. View the raw message.
tools/perf/arch/arm64/include/dwarf-regs-table.h new file +13 -0
Lines of this file are not shown. View the raw message.
tools/perf/arch/powerpc/include/arch-tests.h new file +13 -0
Lines of this file are not shown. View the raw message.
tools/perf/arch/powerpc/include/dwarf-regs-table.h new file +27 -0
Lines of this file are not shown. View the raw message.
tools/perf/arch/powerpc/include/perf_regs.h +2 -0
Lines of this file are not shown. View the raw message.
tools/perf/arch/powerpc/tests/Build new file +4 -0
Lines of this file are not shown. View the raw message.
tools/perf/arch/powerpc/tests/arch-tests.c new file +15 -0
Lines of this file are not shown. View the raw message.
tools/perf/arch/powerpc/tests/dwarf-unwind.c new file +62 -0
62 lines not on this page · raw message
tools/perf/arch/powerpc/tests/regs_load.S new file +94 -0
94 lines not on this page · raw message
tools/perf/arch/powerpc/util/sym-handling.c +1 -1
Lines of this file are not shown. View the raw message.
tools/perf/arch/s390/include/dwarf-regs-table.h new file +8 -0
Lines of this file are not shown. View the raw message.
tools/perf/arch/sh/include/dwarf-regs-table.h new file +25 -0
Lines of this file are not shown. View the raw message.
tools/perf/arch/sparc/include/dwarf-regs-table.h new file +18 -0
Lines of this file are not shown. View the raw message.
tools/perf/arch/x86/include/dwarf-regs-table.h new file +14 -0
Lines of this file are not shown. View the raw message.
tools/perf/arch/x86/util/intel-pt.c +53 -4
57 lines not on this page · raw message
tools/perf/arch/xtensa/include/dwarf-regs-table.h new file +8 -0
Lines of this file are not shown. View the raw message.
tools/perf/bench/numa.c +27 -26
53 lines not on this page · raw message
tools/perf/builtin-annotate.c +108 -3
111 lines not on this page · raw message
tools/perf/builtin-record.c +35 -15
50 lines not on this page · raw message
tools/perf/builtin-top.c +19 -33
52 lines not on this page · raw message
tools/perf/tests/backward-ring-buffer.c +1 -1
Lines of this file are not shown. View the raw message.
tools/perf/tests/vmlinux-kallsyms.c +34 -27
61 lines not on this page · raw message
tools/perf/trace/beauty/mmap.c +2 -70
72 lines not on this page · raw message
tools/perf/ui/browsers/hists.c +39 -20
59 lines not on this page · raw message
tools/perf/ui/stdio/hist.c +45 -37
82 lines not on this page · raw message
tools/perf/util/annotate.c +155 -71
226 lines not on this page · raw message
tools/perf/util/auxtrace.c +738 -0
738 lines not on this page · raw message
tools/perf/util/auxtrace.h +55 -0
55 lines not on this page · raw message
tools/perf/util/block-range.c new file +328 -0
328 lines not on this page · raw message
tools/perf/util/block-range.h new file +71 -0
71 lines not on this page · raw message
tools/perf/util/cs-etm.h new file +74 -0
74 lines not on this page · raw message
tools/perf/util/drv_configs.c new file +77 -0
77 lines not on this page · raw message
tools/perf/util/drv_configs.h new file +26 -0
Lines of this file are not shown. View the raw message.
tools/perf/util/dwarf-aux.c +205 -2
207 lines not on this page · raw message
tools/perf/util/dwarf-regs.c new file +59 -0
59 lines not on this page · raw message
tools/perf/util/hist.c +152 -2
154 lines not on this page · raw message
tools/perf/util/intel-pt-decoder/intel-pt-decoder.c +30 -0
Lines of this file are not shown. View the raw message.
tools/perf/util/intel-pt-decoder/intel-pt-decoder.h +1 -0
Lines of this file are not shown. View the raw message.
tools/perf/util/intel-pt.c +167 -9
176 lines not on this page · raw message
tools/perf/util/map.c +20 -25
45 lines not on this page · raw message
tools/perf/util/parse-events.c +41 -7
48 lines not on this page · raw message
tools/perf/util/probe-event.c +89 -37
126 lines not on this page · raw message
tools/perf/util/probe-file.c +60 -4
64 lines not on this page · raw message
tools/perf/util/probe-finder.c +75 -21
96 lines not on this page · raw message
tools/perf/util/scripting-engines/trace-event-perl.c +3 -2
Lines of this file are not shown. View the raw message.
tools/perf/util/scripting-engines/trace-event-python.c +3 -2
Lines of this file are not shown. View the raw message.
tools/perf/util/symbol-elf.c +63 -55
118 lines not on this page · raw message
tools/perf/util/symbol.c +110 -69
179 lines not on this page · raw message
The rest of this diff is not shown. View the raw message.
Part of the diff is not shown here. View the raw message.