regression caused by cgroups optimization in 3.17-rc2
Subsystems (3)
I'm seeing a pretty large regression in 3.17-rc2 vs 3.16 coming from the memory cgroups code. This is on a kernel with cgroups enabled at compile time, but not _used_ for anything. See the green lines in the graph:
https://www.sr71.net/~dave/intel/regression-from-05b843012.png
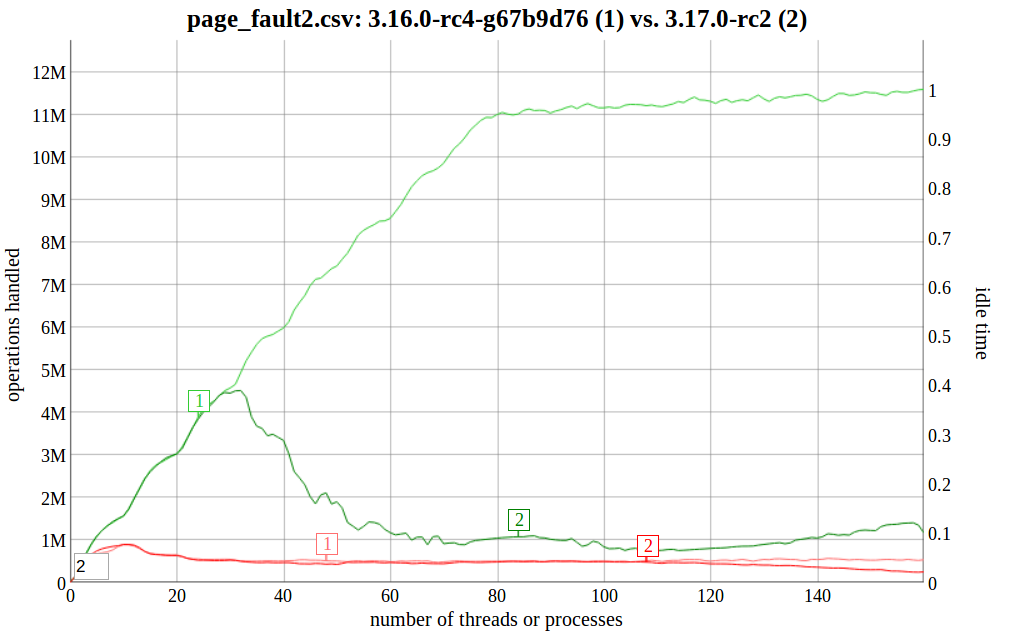
The workload is a little parallel microbenchmark doing page faults:
The hardware is an 8-socket Westmere box with 160 hardware threads. For some reason, this does not affect the version of the microbenchmark which is doing completely anonymous page faults.
I bisected it down to this commit:
Quoted 11 lines
commit
05b8430123359886ef6a4146fba384e30d771b3fAuthor: Johannes Weiner <[email protected]> Date: Wed Aug 6 16:05:59 2014 -0700mm: memcontrol: use
root_mem_cgroupres_counterDue to an old optimization to keep expensive
res_counterchanges at a minimum, theroot_mem_cgroupres_counteris never charged; there is no limit at that level anyway, and any statistics can be generated on demand by summing up the counters of all other cgroups.
Quoted 5 lines
However, with per-cpu charge caches,
res_counteroperations do not even show up in profiles anymore, so this optimization is no longer necessary.Remove it to simplify the code.
It does not revert cleanly because of the hunks below. The code in those hunks was removed, so I tried running without properly merging them and it spews warnings because counter->usage is seen going negative.
So, it doesn't appear we can quickly revert this.
Quoted 21 lines
memcontrol.c +3
-2@@ -3943,7 +3947,7 @@* replacement page, so leave it alone when phasing out the * page that is unused after the migration. */ -if (!end_migration) +if (!end_migration && !mem_cgroup_is_root (memcg))mem_cgroup_do_uncharge (memcg, nr_pages, ctype);return memcg;@@ -4076,7 +4080,8 @@* We uncharge this because swap is freed. This memcg can * be obsolete one. We avoid calling css_tryget_online(). */ -res_counter_uncharge (&memcg->memsw,PAGE_SIZE ); +if (!mem_cgroup_is_root (memcg)) +res_counter_uncharge (&memcg->memsw,PAGE_SIZE );mem_cgroup_swap_statistics (memcg, false);css_put (&memcg->css); }
Quoted 5 lines · Dave Hansen
It does not revert cleanly because of the hunks below. The code in those hunks was removed, so I tried running without properly merging them and it spews warnings because
counter->usageis seen going negative.So, it doesn't appear we can quickly revert this.
I'm fairly confident that I missed some of the cases (especially in the charge-moving code), but the attached patch does at least work around the regression for me. It restores the original performance, or at least gets _close_ to it.
---
 b/mm/memcontrol.c |   14 ++++++++++++++
 1 file changed, 14 insertions(+)
mm/memcontrol.c renamed from mm/memcontrol.c~try-partial-revert-of-root-charge-regression-patch +14 -0
@@ -2534,6 +2534,8 @@ static int try_charge(struct mem_cgroupunsigned long long size;int ret =0 ; +if (mem_cgroup_is_root (memcg)) + goto done; retry:if (consume_stock (memcg, nr_pages)) goto done;
@@ -2640,6 +2642,9 @@ static void __mem_cgroup_cancel_local_ch {unsigned long bytes = nr_pages *PAGE_SIZE ; +if (mem_cgroup_is_root (memcg)) +return ; +res_counter_uncharge_until (&memcg->res, memcg->res.parent, bytes);if (do_swap_account) res_counter_uncharge_until(&memcg->memsw,
@@ -6440,6 +6445,9 @@ void mem_cgroup_commit_charge(struct pagVM_BUG_ON_PAGE (!page->mapping, page);VM_BUG_ON_PAGE (PageLRU (page) && !lrucare, page); +if (mem_cgroup_is_root (memcg)) +return ; +if (mem_cgroup_disabled ())return ;/*
@@ -6484,6 +6492,9 @@ void mem_cgroup_cancel_charge(struct pag {unsigned int nr_pages =1 ; +if (mem_cgroup_is_root (memcg)) +return ; +if (mem_cgroup_disabled ())return ;/*
@@ -6509,6 +6520,9 @@ static void uncharge_batch(struct mem_cg {unsigned long flags; +if (mem_cgroup_is_root (memcg)) +return ; +if (nr_mem)res_counter_uncharge (&memcg->res, nr_mem *PAGE_SIZE );if (nr_memsw)
_
I, of course, forgot to include the most important detail. This appears to be pretty run-of-the-mill spinlock contention in the resource counter code. Nearly 80% of the CPU is spent spinning in the charge or uncharge paths in the kernel. It is apparently spinning on res_counter->lock in both the charge and uncharge paths.
It already does _some_ batching here on the free side, but that apparently breaks down after ~40 threads.
It's a no-brainer since the patch in question removed an optimization skipping the charging, and now we're seeing overhead from the charging.
Here's the first entry from perf top:
    80.18%    80.18%  [kernel]               [k] _raw_spin_lock
                  |
                  --- _raw_spin_lock
                     |
                     |--66.59%-- res_counter_uncharge_until
                     |          res_counter_uncharge
                     |          uncharge_batch
                     |          uncharge_list
                     |          mem_cgroup_uncharge_list
                     |          release_pages
                     |          free_pages_and_swap_cache
                     |          tlb_flush_mmu_free
                     |          |
                     |          |--90.12%-- unmap_single_vma
                     |          |          unmap_vmas
                     |          |          unmap_region
                     |          |          do_munmap
                     |          |          vm_munmap
                     |          |          sys_munmap
                     |          |          system_call_fastpath
                     |          |          __GI___munmap
                     |          |
                     |           --9.88%-- tlb_flush_mmu
                     |                     tlb_finish_mmu
                     |                     unmap_region
                     |                     do_munmap
                     |                     vm_munmap
                     |                     sys_munmap
                     |                     system_call_fastpath
                     |                     __GI___munmap
                     |
                     |--46.13%-- __res_counter_charge
                     |          res_counter_charge
                     |          try_charge
                     |          mem_cgroup_try_charge
                     |          |
                     |          |--99.89%-- do_cow_fault
                     |          |          handle_mm_fault
                     |          |          __do_page_fault
                     |          |          do_page_fault
                     |          |          page_fault
                     |          |          testcase
                     |           --0.11%-- [...]
                     |
                     |--1.14%-- do_cow_fault
                     |          handle_mm_fault
                     |          __do_page_fault
                     |          do_page_fault
                     |          page_fault
                     |          testcase
                      --8217937613.29%-- [...]
Johannes Weiner
maintainerHi Dave,
Quoted 8 lines · Dave Hansen
I'm seeing a pretty large regression in 3.17-rc2 vs 3.16 coming from the memory cgroups code. This is on a kernel with cgroups enabled at compile time, but not _used_ for anything. See the green lines in the graph:
https://www.sr71.net/~dave/intel/regression-from-05b843012.pngThe workload is a little parallel microbenchmark doing page faults:
Ouch.
Quoted 24 lines
The hardware is an 8-socket Westmere box with 160 hardware threads. For some reason, this does not affect the version of the microbenchmark which is doing completely anonymous page faults.
I bisected it down to this commit:
Quoted 16 lines
commit
05b8430123359886ef6a4146fba384e30d771b3fAuthor: Johannes Weiner <[email protected]> Date: Wed Aug 6 16:05:59 2014 -0700mm: memcontrol: use
root_mem_cgroupres_counterDue to an old optimization to keep expensive
res_counterchanges at a minimum, theroot_mem_cgroupres_counteris never charged; there is no limit at that level anyway, and any statistics can be generated on demand by summing up the counters of all other cgroups.However, with per-cpu charge caches,
res_counteroperations do not even show up in profiles anymore, so this optimization is no longer necessary.Remove it to simplify the code.
Accounting new pages is buffered through per-cpu caches, but taking them off the counters on free is not, so I'm guessing that above a certain allocation rate the cost of locking and changing the counters takes over. Is there a chance you could profile this to see if locks and res_counter-related operations show up?
I can't reproduce this complete breakdown on my smaller test gear, but I do see an improvement with the following patch:
---
Quoted 1 line
From
29a51326c24b7bb45d17e9c864c34506f10868f6Mon Sep 17 00:00:00 2001
From: Johannes Weiner <[email protected]>
Date: Tue, 2 Sep 2014 18:11:39 -0400
Subject: [patch] mm: memcontrol: use per-cpu caches for uncharging
---
 mm/memcontrol.c | 28 ++++++++++++++++++++++------
 1 file changed, 22 insertions(+), 6 deletions(-)
mm/memcontrol.c +22 -6
@@ -2365,6 +2365,7 @@ static void drain_stock(struct memcg_stock_pcp *stock)res_counter_uncharge (&old->res, bytes);if (do_swap_account)res_counter_uncharge (&old->memsw, bytes); +memcg_oom_recover (old); stock->nr_pages =0 ; } stock->cached =NULL ;
@@ -2405,6 +2406,13 @@ static void refill_stock(struct mem_cgroup *memcg, unsigned int nr_pages) stock->cached = memcg; } stock->nr_pages += nr_pages; +if (stock->nr_pages >CHARGE_BATCH *4 ) { +res_counter_uncharge (&memcg->res,CHARGE_BATCH ); +if (do_swap_account) +res_counter_uncharge (&memcg->memsw,CHARGE_BATCH ); +memcg_oom_recover (memcg); + stock->nr_pages -=CHARGE_BATCH ; + }put_cpu_var (memcg_stock); }
@@ -6509,12 +6517,20 @@ static void uncharge_batch(struct mem_cgroup *memcg, unsigned long pgpgout, {unsigned long flags; -if (nr_mem) -res_counter_uncharge (&memcg->res, nr_mem *PAGE_SIZE ); -if (nr_memsw) -res_counter_uncharge (&memcg->memsw, nr_memsw *PAGE_SIZE ); - -memcg_oom_recover (memcg); +/* +* The percpu caches count both memory and memsw charges in a +* single conuter, but there might be less memsw charges when +* some of the pages have been swapped out. +*/ +if (nr_mem == nr_memsw) +refill_stock (memcg, nr_mem); +else { +if (nr_mem) +res_counter_uncharge (&memcg->res, nr_mem *PAGE_SIZE ); +if (nr_memsw) +res_counter_uncharge (&memcg->memsw, nr_memsw *PAGE_SIZE ); +memcg_oom_recover (memcg); + }local_irq_save (flags);__this_cpu_sub (memcg->stat->count[MEM_CGROUP_STAT_RSS ], nr_anon);
Signature · 1 line
2.0.4
Quoted 5 lines · Johannes Weiner
Accounting new pages is buffered through per-cpu caches, but taking them off the counters on free is not, so I'm guessing that above a certain allocation rate the cost of locking and changing the counters takes over. Is there a chance you could profile this to see if locks and res_counter-related operations show up?
It looks pretty much the same, although it might have equalized the charge and uncharge sides a bit. Full 'perf top' output attached.
PerfTop: 275580 irqs/sec kernel:98.0% exact: 0.0% [4000Hz cycles], (all, 160 CPUs)
-------------------------------------------------------------------------------
68.10% 68.10% [kernel] [k] _raw_spin_lock
|
--- _raw_spin_lock
|
|--57.35%-- __res_counter_charge
| res_counter_charge
| try_charge
| mem_cgroup_try_charge
| |
| |--99.93%-- do_cow_fault
| | handle_mm_fault
| | __do_page_fault
| | do_page_fault
| | page_fault
| | testcase
| --0.07%-- [...]
|
|--53.93%-- res_counter_uncharge_until
| res_counter_uncharge
| refill_stock
| uncharge_batch
| uncharge_list
| mem_cgroup_uncharge_list
| release_pages
| free_pages_and_swap_cache
| tlb_flush_mmu_free
| |
| |--98.62%-- unmap_single_vma
| | unmap_vmas
| | unmap_region
| | do_munmap
| | vm_munmap
| | sys_munmap
| | system_call_fastpath
| | __GI___munmap
| |
| --1.38%-- tlb_flush_mmu
| tlb_finish_mmu
| unmap_region
| do_munmap
| vm_munmap
| sys_munmap
| system_call_fastpath
| __GI___munmap
|
|--2.18%-- do_cow_fault
| handle_mm_fault
| __do_page_fault
| do_page_fault
| page_fault
| testcase
--9307219025.55%-- [...]
64.00% 1.34% page_fault2_processes [.] testcase
|
--- testcase
62.64% 0.37% [kernel] [k] page_fault
|
--- page_fault
|
|--114.21%-- testcase
--10118485450.89%-- [...]
62.27% 0.01% [kernel] [k] do_page_fault
|
--- do_page_fault
|
|--114.28%-- page_fault
| |
| |--99.93%-- testcase
| --0.07%-- [...]
--10178525138.33%-- [...]
62.25% 0.07% [kernel] [k] __do_page_fault
|
--- __do_page_fault
|
|--114.27%-- do_page_fault
| page_fault
| |
| |--99.93%-- testcase
| --0.07%-- [...]
--10182230022.41%-- [...]
62.08% 0.26% [kernel] [k] handle_mm_fault
|
--- handle_mm_fault
|
|--114.28%-- __do_page_fault
| do_page_fault
| page_fault
| |
| |--99.94%-- testcase
| --0.06%-- [...]
--10210709377.69%-- [...]
44.32% 0.22% [kernel] [k] do_cow_fault
|
--- do_cow_fault
|
|--114.28%-- handle_mm_fault
| __do_page_fault
| do_page_fault
| page_fault
| testcase
--14302986980.21%-- [...]
35.23% 0.00% [kernel] [k] sys_munmap
|
--- sys_munmap
system_call_fastpath
__GI___munmap
34.84% 0.04% [kernel] [k] mem_cgroup_try_charge
|
--- mem_cgroup_try_charge
|
|--114.18%-- do_cow_fault
| handle_mm_fault
| __do_page_fault
| do_page_fault
| page_fault
| testcase
--18195666899.12%-- [...]
34.74% 0.49% [kernel] [k] unmap_single_vma
|
--- unmap_single_vma
unmap_vmas
unmap_region
do_munmap
vm_munmap
sys_munmap
system_call_fastpath
__GI___munmap
34.66% 0.00% [kernel] [k] tlb_flush_mmu_free
|
--- tlb_flush_mmu_free
|
|--112.70%-- unmap_single_vma
| unmap_vmas
| unmap_region
| do_munmap
| vm_munmap
| sys_munmap
| system_call_fastpath
| __GI___munmap
|
|--1.59%-- tlb_flush_mmu
| tlb_finish_mmu
| unmap_region
| do_munmap
| vm_munmap
| sys_munmap
| system_call_fastpath
| __GI___munmap
--18285481100.94%-- [...]
34.66% 0.12% [kernel] [k] free_pages_and_swap_cache
|
--- free_pages_and_swap_cache
tlb_flush_mmu_free
|
|--112.70%-- unmap_single_vma
| unmap_vmas
| unmap_region
| do_munmap
| vm_munmap
| sys_munmap
| system_call_fastpath
| __GI___munmap
|
|--1.59%-- tlb_flush_mmu
| tlb_finish_mmu
| unmap_region
| do_munmap
| vm_munmap
| sys_munmap
| system_call_fastpath
| __GI___munmap
--18286531934.97%-- [...]
34.61% 0.04% [kernel] [k] try_charge
|
--- try_charge
|
|--114.26%-- mem_cgroup_try_charge
| |
| |--99.93%-- do_cow_fault
| | handle_mm_fault
| | __do_page_fault
| | do_page_fault
| | page_fault
| | testcase
| --0.07%-- [...]
--18312751937.56%-- [...]
34.57% 0.00% [kernel] [k] res_counter_charge
|
--- res_counter_charge
|
|--114.27%-- try_charge
| mem_cgroup_try_charge
| |
| |--99.93%-- do_cow_fault
| | handle_mm_fault
| | __do_page_fault
| | do_page_fault
| | page_fault
| | testcase
| --0.07%-- [...]
--18334689838.42%-- [...]
34.56% 0.08% [kernel] [k] release_pages
|
--- release_pages
|
|--114.21%-- free_pages_and_swap_cache
| tlb_flush_mmu_free
| |
| |--98.61%-- unmap_single_vma
| | unmap_vmas
| | unmap_region
| | do_munmap
| | vm_munmap
| | sys_munmap
| | system_call_fastpath
| | __GI___munmap
| |
| --1.39%-- tlb_flush_mmu
| tlb_finish_mmu
| unmap_region
| do_munmap
| vm_munmap
| sys_munmap
| system_call_fastpath
| __GI___munmap
--18340488029.00%-- [...]
34.26% 0.08% [kernel] [k] __res_counter_charge
|
--- __res_counter_charge
|
|--114.28%-- res_counter_charge
| try_charge
| mem_cgroup_try_charge
| |
| |--99.93%-- do_cow_fault
| | handle_mm_fault
| | __do_page_fault
| | do_page_fault
| | page_fault
| | testcase
| --0.07%-- [...]
--18502823676.22%-- [...]
33.45% 0.00% [kernel] [k] mem_cgroup_uncharge_list
|
--- mem_cgroup_uncharge_list
|
|--114.28%-- release_pages
| free_pages_and_swap_cache
| tlb_flush_mmu_free
| |
| |--98.62%-- unmap_single_vma
| | unmap_vmas
| | unmap_region
| | do_munmap
| | vm_munmap
| | sys_munmap
| | system_call_fastpath
| | __GI___munmap
| |
| --1.38%-- tlb_flush_mmu
| tlb_finish_mmu
| unmap_region
| do_munmap
| vm_munmap
| sys_munmap
| system_call_fastpath
| __GI___munmap
--18949679654.78%-- [...]
33.45% 0.01% [kernel] [k] uncharge_list
|
--- uncharge_list
|
|--114.29%-- mem_cgroup_uncharge_list
| release_pages
| free_pages_and_swap_cache
| tlb_flush_mmu_free
| |
| |--98.62%-- unmap_single_vma
| | unmap_vmas
| | unmap_region
| | do_munmap
| | vm_munmap
| | sys_munmap
| | system_call_fastpath
| | __GI___munmap
| |
| --1.38%-- tlb_flush_mmu
| tlb_finish_mmu
| unmap_region
| do_munmap
| vm_munmap
| sys_munmap
| system_call_fastpath
| __GI___munmap
--18951232568.52%-- [...]
33.43% 0.02% [kernel] [k] uncharge_batch
|
--- uncharge_batch
|
|--114.28%-- uncharge_list
| mem_cgroup_uncharge_list
| release_pages
| free_pages_and_swap_cache
| tlb_flush_mmu_free
| |
| |--98.62%-- unmap_single_vma
| | unmap_vmas
| | unmap_region
| | do_munmap
| | vm_munmap
| | sys_munmap
| | system_call_fastpath
| | __GI___munmap
| |
| --1.38%-- tlb_flush_mmu
| tlb_finish_mmu
| unmap_region
| do_munmap
| vm_munmap
| sys_munmap
| system_call_fastpath
| __GI___munmap
--18962452122.61%-- [...]
32.43% 0.01% [kernel] [k] refill_stock
|
--- refill_stock
|
|--114.27%-- uncharge_batch
| uncharge_list
| mem_cgroup_uncharge_list
| release_pages
| free_pages_and_swap_cache
| tlb_flush_mmu_free
| |
| |--98.62%-- unmap_single_vma
| | unmap_vmas
| | unmap_region
| | do_munmap
| | vm_munmap
| | sys_munmap
| | system_call_fastpath
| | __GI___munmap
| |
| --1.38%-- tlb_flush_mmu
| tlb_finish_mmu
| unmap_region
| do_munmap
| vm_munmap
| sys_munmap
| system_call_fastpath
| __GI___munmap
--19543678319.29%-- [...]Johannes Weiner
maintainerQuoted 9 lines · Dave Hansen
Quoted 5 lines · Johannes Weiner
Accounting new pages is buffered through per-cpu caches, but taking them off the counters on free is not, so I'm guessing that above a certain allocation rate the cost of locking and changing the counters takes over. Is there a chance you could profile this to see if locks and res_counter-related operations show up?
It looks pretty much the same, although it might have equalized the charge and uncharge sides a bit. Full 'perf top' output attached.
That looks like a partial profile, where did the page allocator, page zeroing etc. go? Because the distribution among these listed symbols doesn't seem all that crazy:
Quoted 366 lines
PerfTop: 275580 irqs/sec kernel:98.0% exact: 0.0% [4000Hz cycles], (all, 160 CPUs)-------------------------------------------------------------------------------
68.10% 68.10% [kernel] [k] _raw_spin_lock | --- _raw_spin_lock | |--57.35%-- __res_counter_charge | res_counter_charge | try_charge | mem_cgroup_try_charge | | | |--99.93%-- do_cow_fault | | handle_mm_fault | | __do_page_fault | | do_page_fault | | page_fault | | testcase | --0.07%-- [...] | |--53.93%-- res_counter_uncharge_until | res_counter_uncharge | refill_stock | uncharge_batch | uncharge_list | mem_cgroup_uncharge_list | release_pages | free_pages_and_swap_cache | tlb_flush_mmu_free | | | |--98.62%-- unmap_single_vma | | unmap_vmas | | unmap_region | | do_munmap | | vm_munmap | | sys_munmap | | system_call_fastpath | | __GI___munmap | | | --1.38%-- tlb_flush_mmu | tlb_finish_mmu | unmap_region | do_munmap | vm_munmap | sys_munmap | system_call_fastpath | __GI___munmap | |--2.18%-- do_cow_fault | handle_mm_fault | __do_page_fault | do_page_fault | page_fault | testcase --9307219025.55%-- [...] 64.00% 1.34% page_fault2_processes [.] testcase | --- testcase 62.64% 0.37% [kernel] [k] page_fault | --- page_fault | |--114.21%-- testcase --10118485450.89%-- [...] 62.27% 0.01% [kernel] [k] do_page_fault | --- do_page_fault | |--114.28%-- page_fault | | | |--99.93%-- testcase | --0.07%-- [...] --10178525138.33%-- [...] 62.25% 0.07% [kernel] [k] __do_page_fault | --- __do_page_fault | |--114.27%-- do_page_fault | page_fault | | | |--99.93%-- testcase | --0.07%-- [...] --10182230022.41%-- [...] 62.08% 0.26% [kernel] [k] handle_mm_fault | --- handle_mm_fault | |--114.28%-- __do_page_fault | do_page_fault | page_fault | | | |--99.94%-- testcase | --0.06%-- [...] --10210709377.69%-- [...] 44.32% 0.22% [kernel] [k] do_cow_fault | --- do_cow_fault | |--114.28%-- handle_mm_fault | __do_page_fault | do_page_fault | page_fault | testcase --14302986980.21%-- [...] 35.23% 0.00% [kernel] [k] sys_munmap | --- sys_munmap system_call_fastpath __GI___munmap 34.84% 0.04% [kernel] [k] mem_cgroup_try_charge | --- mem_cgroup_try_charge | |--114.18%-- do_cow_fault | handle_mm_fault | __do_page_fault | do_page_fault | page_fault | testcase --18195666899.12%-- [...] 34.74% 0.49% [kernel] [k] unmap_single_vma | --- unmap_single_vma unmap_vmas unmap_region do_munmap vm_munmap sys_munmap system_call_fastpath __GI___munmap 34.66% 0.00% [kernel] [k] tlb_flush_mmu_free | --- tlb_flush_mmu_free | |--112.70%-- unmap_single_vma | unmap_vmas | unmap_region | do_munmap | vm_munmap | sys_munmap | system_call_fastpath | __GI___munmap | |--1.59%-- tlb_flush_mmu | tlb_finish_mmu | unmap_region | do_munmap | vm_munmap | sys_munmap | system_call_fastpath | __GI___munmap --18285481100.94%-- [...] 34.66% 0.12% [kernel] [k] free_pages_and_swap_cache | --- free_pages_and_swap_cache tlb_flush_mmu_free | |--112.70%-- unmap_single_vma | unmap_vmas | unmap_region | do_munmap | vm_munmap | sys_munmap | system_call_fastpath | __GI___munmap | |--1.59%-- tlb_flush_mmu | tlb_finish_mmu | unmap_region | do_munmap | vm_munmap | sys_munmap | system_call_fastpath | __GI___munmap --18286531934.97%-- [...] 34.61% 0.04% [kernel] [k] try_charge | --- try_charge | |--114.26%-- mem_cgroup_try_charge | | | |--99.93%-- do_cow_fault | | handle_mm_fault | | __do_page_fault | | do_page_fault | | page_fault | | testcase | --0.07%-- [...] --18312751937.56%-- [...] 34.57% 0.00% [kernel] [k] res_counter_charge | --- res_counter_charge | |--114.27%-- try_charge | mem_cgroup_try_charge | | | |--99.93%-- do_cow_fault | | handle_mm_fault | | __do_page_fault | | do_page_fault | | page_fault | | testcase | --0.07%-- [...] --18334689838.42%-- [...] 34.56% 0.08% [kernel] [k] release_pages | --- release_pages | |--114.21%-- free_pages_and_swap_cache | tlb_flush_mmu_free | | | |--98.61%-- unmap_single_vma | | unmap_vmas | | unmap_region | | do_munmap | | vm_munmap | | sys_munmap | | system_call_fastpath | | __GI___munmap | | | --1.39%-- tlb_flush_mmu | tlb_finish_mmu | unmap_region | do_munmap | vm_munmap | sys_munmap | system_call_fastpath | __GI___munmap --18340488029.00%-- [...] 34.26% 0.08% [kernel] [k] __res_counter_charge | --- __res_counter_charge | |--114.28%-- res_counter_charge | try_charge | mem_cgroup_try_charge | | | |--99.93%-- do_cow_fault | | handle_mm_fault | | __do_page_fault | | do_page_fault | | page_fault | | testcase | --0.07%-- [...] --18502823676.22%-- [...] 33.45% 0.00% [kernel] [k] mem_cgroup_uncharge_list | --- mem_cgroup_uncharge_list | |--114.28%-- release_pages | free_pages_and_swap_cache | tlb_flush_mmu_free | | | |--98.62%-- unmap_single_vma | | unmap_vmas | | unmap_region | | do_munmap | | vm_munmap | | sys_munmap | | system_call_fastpath | | __GI___munmap | | | --1.38%-- tlb_flush_mmu | tlb_finish_mmu | unmap_region | do_munmap | vm_munmap | sys_munmap | system_call_fastpath | __GI___munmap --18949679654.78%-- [...] 33.45% 0.01% [kernel] [k] uncharge_list | --- uncharge_list | |--114.29%-- mem_cgroup_uncharge_list | release_pages | free_pages_and_swap_cache | tlb_flush_mmu_free | | | |--98.62%-- unmap_single_vma | | unmap_vmas | | unmap_region | | do_munmap | | vm_munmap | | sys_munmap | | system_call_fastpath | | __GI___munmap | | | --1.38%-- tlb_flush_mmu | tlb_finish_mmu | unmap_region | do_munmap | vm_munmap | sys_munmap | system_call_fastpath | __GI___munmap --18951232568.52%-- [...] 33.43% 0.02% [kernel] [k] uncharge_batch | --- uncharge_batch | |--114.28%-- uncharge_list | mem_cgroup_uncharge_list | release_pages | free_pages_and_swap_cache | tlb_flush_mmu_free | | | |--98.62%-- unmap_single_vma | | unmap_vmas | | unmap_region | | do_munmap | | vm_munmap | | sys_munmap | | system_call_fastpath | | __GI___munmap | | | --1.38%-- tlb_flush_mmu | tlb_finish_mmu | unmap_region | do_munmap | vm_munmap | sys_munmap | system_call_fastpath | __GI___munmap --18962452122.61%-- [...] 32.43% 0.01% [kernel] [k] refill_stock | --- refill_stock | |--114.27%-- uncharge_batch | uncharge_list | mem_cgroup_uncharge_list | release_pages | free_pages_and_swap_cache | tlb_flush_mmu_free | | | |--98.62%-- unmap_single_vma | | unmap_vmas | | unmap_region | | do_munmap | | vm_munmap | | sys_munmap | | system_call_fastpath | | __GI___munmap | | | --1.38%-- tlb_flush_mmu
Quoted 8 lines
                     |                     tlb_finish_mmu
                     |                     unmap_region
                     |                     do_munmap
                     |                     vm_munmap
                     |                     sys_munmap
                     |                     system_call_fastpath
                     |                     __GI___munmap
                      --19543678319.29%-- [...]
--
To unsubscribe, send a message with 'unsubscribe linux-mm' in the body to [email protected]. For more info on Linux MM,
see: http://www.linux-mm.org/ .
Don't email: <a href=mailto:"[email protected]"> [email protected] </a>
Quoted 4 lines · Johannes Weiner
That looks like a partial profile, where did the page allocator, page zeroing etc. go? Because the distribution among these listed symbols doesn't seem all that crazy:
Please argue this *after* the commit has been reverted. You guys can try to make the memcontrol batching actually work and scale later. It's not appropriate to argue against major regressions when reported and bisected by users.
Showing the spinlock at the top of the profile is very much crazy (apparently taking 68% of all cpu time), when it's all useless make-believe work. I don't understand why you wouldn't call that crazy.
Linus
--
To unsubscribe, send a message with 'unsubscribe linux-mm' in the body to [email protected]. For more info on Linux MM,
see: http://www.linux-mm.org/ .
Don't email: <a href=mailto:"[email protected]"> [email protected] </a>
Quoted 8 lines · Johannes Weiner
Quoted 7 lines · Dave Hansen
Quoted 5 lines · Johannes Weiner
Accounting new pages is buffered through per-cpu caches, but taking them off the counters on free is not, so I'm guessing that above a certain allocation rate the cost of locking and changing the counters takes over. Is there a chance you could profile this to see if locks and res_counter-related operations show up?
Quoted 6 lines
Quoted 2 lines
It looks pretty much the same, although it might have equalized the charge and uncharge sides a bit. Full 'perf top' output attached.
That looks like a partial profile, where did the page allocator, page zeroing etc. go? Because the distribution among these listed symbols doesn't seem all that crazy:
Perf was only outputting the top 20 functions. Believe it or not, page zeroing and the rest of the allocator path wasn't even in the path of the top 20 functions because there is so much lock contention.
Here's a longer run of 'perf top' along with the top 100 functions:
http://www.sr71.net/~dave/intel/perf-top-1409702817.txt.gz
you can at least see copy_page_rep in there.
--
To unsubscribe, send a message with 'unsubscribe linux-mm' in the body to [email protected]. For more info on Linux MM,
see: http://www.linux-mm.org/ .
Don't email: <a href=mailto:"[email protected]"> [email protected] </a>
Johannes Weiner
maintainerQuoted 10 lines · Linus Torvalds
Quoted 4 lines · Johannes Weiner
That looks like a partial profile, where did the page allocator, page zeroing etc. go? Because the distribution among these listed symbols doesn't seem all that crazy:
Please argue this *after* the commit has been reverted. You guys can try to make the memcontrol batching actually work and scale later. It's not appropriate to argue against major regressions when reported and bisected by users.
I'll send a clean revert later.
Quoted 4 lines
Showing the spinlock at the top of the profile is very much crazy (apparently taking 68% of all cpu time), when it's all useless make-believe work. I don't understand why you wouldn't call that crazy.
If you limit perf to a subset of symbols, it will show a relative distribution between them, i.e: perf top --symbols kfree,memset during some disk access:
PerfTop: 1292 irqs/sec kernel:84.4% exact: 0.0% [4000Hz cycles], (all, 4 CPUs)
-------------------------------------------------------------------------------
    56.23%  [kernel]      [k] kfree
    41.86%  [kernel]      [k] memset
     1.91%  libc-2.19.so  [.] memset
kfree isn't eating 56% of "all cpu time" here, and it wasn't clear to me whether Dave filtered symbols from only memcontrol.o, memory.o, and mmap.o in a similar way. I'm not arguing against the regression, I'm just trying to make sense of the numbers from the *patched* kernel.
Quoted 4 lines · Johannes Weiner
kfree isn't eating 56% of "all cpu time" here, and it wasn't clear to me whether Dave filtered symbols from only memcontrol.o, memory.o, and mmap.o in a similar way. I'm not arguing against the regression, I'm just trying to make sense of the numbers from the *patched* kernel.
I guess I could have included it in the description, but that was a pretty vanilla run:
perf top --call-graph=fp --stdio > foo.txt
I didn't use any filtering. I didn't even know I _could_ filter. :)
--
To unsubscribe, send a message with 'unsubscribe linux-mm' in the body to [email protected]. For more info on Linux MM,
see: http://www.linux-mm.org/ .
Don't email: <a href=mailto:"[email protected]"> [email protected] </a>
[Sorry to reply so late]
Quoted 14 lines · Dave Hansen
I, of course, forgot to include the most important detail. This appears to be pretty run-of-the-mill spinlock contention in the resource counter code. Nearly 80% of the CPU is spent spinning in the charge or uncharge paths in the kernel. It is apparently spinning on
res_counter->lockin both the charge and uncharge paths.It already does _some_ batching here on the free side, but that apparently breaks down after ~40 threads.
It's a no-brainer since the patch in question removed an optimization skipping the charging, and now we're seeing overhead from the charging.
Here's the first entry from perf top:
Quoted 11 lines
    80.18%    80.18%  [kernel]               [k] _raw_spin_lock
                  |
                  --- _raw_spin_lock
                     |
                     |--66.59%-- res_counter_uncharge_until
                     |          res_counter_uncharge
                     |          uncharge_batch
                     |          uncharge_list
                     |          mem_cgroup_uncharge_list
                     |          release_pages
                     |          free_pages_and_swap_cache
Ouch. free_pages_and_swap_cache completely kills the uncharge batching because it reduces it to PAGEVEC_SIZE batches.
I think we really do not need PAGEVEC_SIZE batching anymore. We are already batching on tlb_gather layer. That one is limited so I think the below should be safe but I have to think about this some more. There is a risk of prolonged lru_lock wait times but the number of pages is limited to 10k and the heavy work is done outside of the lock. If this is really a problem then we can tear LRU part and the actual freeing/uncharging into a separate functions in this path.
Could you test with this half baked patch, please? I didn't get to test it myself unfortunately.
---
mm/swap_state.c +4 -10
@@ -265,18 +265,12 @@ void free_page_and_swap_cache(struct page *page)void free_pages_and_swap_cache (struct page **pages,int nr) {struct page **pagep = pages; +int i;lru_add_drain (); -while (nr) { -int todo =min (nr,PAGEVEC_SIZE ); -int i; - -for (i =0 ; i < todo; i++) -free_swap_cache (pagep[i]); -release_pages (pagep, todo, false); - pagep += todo; - nr -= todo; - } +for (i =0 ; i < nr; i++) +free_swap_cache (pagep[i]); +release_pages (pagep, nr, false); }/*
Signature · 8 lines
Michal Hocko
SUSE Labs

--
To unsubscribe, send a message with 'unsubscribe linux-mm' in
the body to [email protected].  For more info on Linux MM,
see: http://www.linux-mm.org/ .
Don't email: <a href=mailto:"[email protected]"> [email protected] </a>
Johannes Weiner
maintainerQuoted 20 lines · Dave Hansen
Quoted 8 lines · Johannes Weiner
Quoted 7 lines · Dave Hansen
Quoted 5 lines · Johannes Weiner
Accounting new pages is buffered through per-cpu caches, but taking them off the counters on free is not, so I'm guessing that above a certain allocation rate the cost of locking and changing the counters takes over. Is there a chance you could profile this to see if locks and res_counter-related operations show up?
Quoted 6 lines
Quoted 2 lines
It looks pretty much the same, although it might have equalized the charge and uncharge sides a bit. Full 'perf top' output attached.
That looks like a partial profile, where did the page allocator, page zeroing etc. go? Because the distribution among these listed symbols doesn't seem all that crazy:
Perf was only outputting the top 20 functions. Believe it or not, page zeroing and the rest of the allocator path wasn't even in the path of the top 20 functions because there is so much lock contention.
Quoted 5 lines
Here's a longer run of 'perf top' along with the top 100 functions:
http://www.sr71.net/~dave/intel/perf-top-1409702817.txt.gzyou can at least see
copy_page_repin there.
Thanks for the clarification, that is truly horrible. Does the following revert restore performance in your case?
---
Quoted 11 lines · Michal Hocko
Ouch.
free_pages_and_swap_cachecompletely kills the uncharge batching because it reduces it toPAGEVEC_SIZEbatches.I think we really do not need
PAGEVEC_SIZEbatching anymore. We are already batching ontlb_gatherlayer. That one is limited so I think the below should be safe but I have to think about this some more. There is a risk of prolongedlru_lockwait times but the number of pages is limited to 10k and the heavy work is done outside of the lock. If this is really a problem then we can tear LRU part and the actual freeing/uncharging into a separate functions in this path.
Quoted 2 lines
Could you test with this half baked patch, please? I didn't get to test it myself unfortunately.
3.16 settled out at about 11.5M faults/sec before the regression. This patch gets it back up to about 10.5M, which is good. The top spinlock contention in the kernel is still from the resource counter code via mem_cgroup_commit_charge(), though.
I'm running Johannes' patch now.
Quoted 10 lines · Johannes Weiner
Dave Hansen reports a massive scalability regression in an uncontained page fault benchmark with more than 30 concurrent threads, which he bisected down to
05b843012335("mm: memcontrol: useroot_mem_cgroupres_counter") and pin-pointed onres_counterspinlock contention.That change relied on the per-cpu charge caches to mostly swallow the
res_countercosts, but it's apparent that the caches don't scale yet.Revert memcg back to bypassing
res_counterson the root level in order to restore performance for uncontained workloads.
A quick sniff test shows performance coming back to what it was around 3.16 with this patch. I'll run a more thorough set of tests and verify that it's working well.
Quoted 15 lines · Dave Hansen
Quoted 11 lines · Michal Hocko
Ouch.
free_pages_and_swap_cachecompletely kills the uncharge batching because it reduces it toPAGEVEC_SIZEbatches.I think we really do not need
PAGEVEC_SIZEbatching anymore. We are already batching ontlb_gatherlayer. That one is limited so I think the below should be safe but I have to think about this some more. There is a risk of prolongedlru_lockwait times but the number of pages is limited to 10k and the heavy work is done outside of the lock. If this is really a problem then we can tear LRU part and the actual freeing/uncharging into a separate functions in this path.Quoted 2 lines
Could you test with this half baked patch, please? I didn't get to test it myself unfortunately.
Quoted 6 lines
3.16 settled out at about 11.5M faults/sec before the regression. This patch gets it back up to about 10.5M, which is good. The top spinlock contention in the kernel is still from the resource counter code via
mem_cgroup_commit_charge(), though.I'm running Johannes' patch now.
This looks pretty good. The area where it plateaus (above 80 threads where hyperthreading kicks in) might be a bit slower than it was in 3.16, but that could easily be from other things.
Feel free to add my Tested-by:
--
To unsubscribe, send a message with 'unsubscribe linux-mm' in the body to [email protected]. For more info on Linux MM,
see: http://www.linux-mm.org/ .
Don't email: <a href=mailto:"[email protected]"> [email protected] </a>
Michal Hocko
Acked-byOn Thu 04-09-14 11:08:46, Johannes Weiner wrote:
[...]
Quoted 10 lines
From
6fa7599054868cd0df940d7b0973dd64f8acb0b5Mon Sep 17 00:00:00 2001
From: Johannes Weiner <[email protected]>
Date: Thu, 4 Sep 2014 10:04:34 -0400
Subject: [patch] mm: memcontrol: revert use ofroot_mem_cgroupres_counterDave Hansen reports a massive scalability regression in an uncontained page fault benchmark with more than 30 concurrent threads, which he bisected down to
05b843012335("mm: memcontrol: useroot_mem_cgroupres_counter") and pin-pointed onres_counterspinlock contention.
Quoted 8 lines
That change relied on the per-cpu charge caches to mostly swallow the
res_countercosts, but it's apparent that the caches don't scale yet.Revert memcg back to bypassing
res_counterson the root level in order to restore performance for uncontained workloads.Reported-by Dave Hansen <[email protected]>Signed-off-by Johannes Weiner <[email protected]>
The revert looks good to me.
Quoted 219 lines
---
 mm/memcontrol.c | 103 ++++++++++++++++++++++++++++++++++++++++++--------------
 1 file changed, 78 insertions(+), 25 deletions(-)
mm/memcontrol.c +78
-25@@ -2534,6 +2534,8 @@ static int try_charge(struct mem_cgroup *memcg, gfp_t gfp_mask,unsigned long long size;int ret =0 ; +if (mem_cgroup_is_root (memcg)) + goto done; retry:if (consume_stock (memcg, nr_pages)) goto done;@@ -2611,9 +2613,7 @@ nomem:if (!(gfp_mask & __GFP_NOFAIL))return -ENOMEM ; bypass: - memcg = root_mem_cgroup; - ret = -EINTR ; - goto retry; +return -EINTR ; done_restock:if (batch > nr_pages)@@ -2626,6 +2626,9 @@ static void cancel_charge(struct mem_cgroup *memcg, unsigned int nr_pages) {unsigned long bytes = nr_pages *PAGE_SIZE ; +if (mem_cgroup_is_root (memcg)) +return ; +res_counter_uncharge (&memcg->res, bytes);if (do_swap_account)res_counter_uncharge (&memcg->memsw, bytes);@@ -2640,6 +2643,9 @@ static void __mem_cgroup_cancel_local_charge(struct mem_cgroup *memcg, {unsigned long bytes = nr_pages *PAGE_SIZE ; +if (mem_cgroup_is_root (memcg)) +return ; +res_counter_uncharge_until (&memcg->res, memcg->res.parent, bytes);if (do_swap_account) res_counter_uncharge_until(&memcg->memsw,@@ -4093,6 +4099,46 @@ out:return retval; } +static unsigned long mem_cgroup_recursive_stat (struct mem_cgroup *memcg, +enum mem_cgroup_stat_index idx) +{ +struct mem_cgroup *iter; +long val =0 ; + +/* Per-cpu values can be negative, use a signed accumulator */ +for_each_mem_cgroup_tree (iter, memcg) + val +=mem_cgroup_read_stat (iter, idx); + +if (val <0 )/* race ? */ + val =0 ; +return val; +} + +static inline u64 mem_cgroup_usage (struct mem_cgroup *memcg,bool swap) +{ +u64 val; + +if (!mem_cgroup_is_root (memcg)) { +if (!swap) +return res_counter_read_u64 (&memcg->res,RES_USAGE ); +else +return res_counter_read_u64 (&memcg->memsw,RES_USAGE ); + } + +/* +* Transparent hugepages are still accounted for in MEM_CGROUP_STAT_RSS +* as well as in MEM_CGROUP_STAT_RSS_HUGE. +*/ + val =mem_cgroup_recursive_stat (memcg,MEM_CGROUP_STAT_CACHE ); + val +=mem_cgroup_recursive_stat (memcg,MEM_CGROUP_STAT_RSS ); + +if (swap) + val +=mem_cgroup_recursive_stat (memcg,MEM_CGROUP_STAT_SWAP ); + +return val <<PAGE_SHIFT ; +} + +static u64 mem_cgroup_read_u64 (struct cgroup_subsys_state *css,struct cftype *cft) {@@ -4102,8 +4148,12 @@ static u64 mem_cgroup_read_u64(struct cgroup_subsys_state *css,switch (type) {case _MEM: +if (name ==RES_USAGE ) +return mem_cgroup_usage (memcg, false);return res_counter_read_u64 (&memcg->res, name);case _MEMSWAP: +if (name ==RES_USAGE ) +return mem_cgroup_usage (memcg, true);return res_counter_read_u64 (&memcg->memsw, name);case _KMEM:return res_counter_read_u64 (&memcg->kmem, name);@@ -4572,10 +4622,7 @@ static void __mem_cgroup_threshold(struct mem_cgroup *memcg, bool swap)if (!t) goto unlock; -if (!swap) - usage =res_counter_read_u64 (&memcg->res,RES_USAGE ); -else - usage =res_counter_read_u64 (&memcg->memsw,RES_USAGE ); + usage =mem_cgroup_usage (memcg, swap);/* * current_threshold points to threshold just below or equal to usage. @@ -4673,10 +4720,10 @@ static int __mem_cgroup_usage_register_event(struct mem_cgroup *memcg,if (type == _MEM) { thresholds = &memcg->thresholds; - usage =res_counter_read_u64 (&memcg->res,RES_USAGE ); + usage =mem_cgroup_usage (memcg, false); }else if (type == _MEMSWAP) { thresholds = &memcg->memsw_thresholds; - usage =res_counter_read_u64 (&memcg->memsw,RES_USAGE ); + usage =mem_cgroup_usage (memcg, true); }else BUG ();@@ -4762,10 +4809,10 @@ static void __mem_cgroup_usage_unregister_event(struct mem_cgroup *memcg,if (type == _MEM) { thresholds = &memcg->thresholds; - usage =res_counter_read_u64 (&memcg->res,RES_USAGE ); + usage =mem_cgroup_usage (memcg, false); }else if (type == _MEMSWAP) { thresholds = &memcg->memsw_thresholds; - usage =res_counter_read_u64 (&memcg->memsw,RES_USAGE ); + usage =mem_cgroup_usage (memcg, true); }else BUG ();@@ -5525,9 +5572,9 @@ mem_cgroup_css_online(struct cgroup_subsys_state *css)* core guarantees its existence. */ }else { -res_counter_init (&memcg->res, &root_mem_cgroup->res); -res_counter_init (&memcg->memsw, &root_mem_cgroup->memsw); -res_counter_init (&memcg->kmem, &root_mem_cgroup->kmem); +res_counter_init (&memcg->res,NULL ); +res_counter_init (&memcg->memsw,NULL ); +res_counter_init (&memcg->kmem,NULL );/* * Deeper hierachy with use_hierarchy == false doesn't make * much sense so let cgroup subsystem know about this @@ -5969,8 +6016,9 @@ static void __mem_cgroup_clear_mc(void)/* we must fixup refcnts and charges */ if (mc.moved_swap) {/* uncharge swap account from the old cgroup */ -res_counter_uncharge (&mc.from->memsw, -PAGE_SIZE * mc.moved_swap); +if (!mem_cgroup_is_root (mc.from)) +res_counter_uncharge (&mc.from->memsw, +PAGE_SIZE * mc.moved_swap);for (i =0 ; i < mc.moved_swap; i++)css_put (&mc.from->css);@@ -5979,8 +6027,9 @@ static void __mem_cgroup_clear_mc(void)* we charged both to->res and to->memsw, so we should * uncharge to->res. */ -res_counter_uncharge (&mc.to->res, -PAGE_SIZE * mc.moved_swap); +if (!mem_cgroup_is_root (mc.to)) +res_counter_uncharge (&mc.to->res, +PAGE_SIZE * mc.moved_swap);/* we've already done css_get(mc.to) */ mc.moved_swap =0 ; }@@ -6345,7 +6394,8 @@ void mem_cgroup_uncharge_swap(swp_entry_t entry)rcu_read_lock (); memcg =mem_cgroup_lookup (id);if (memcg) { -res_counter_uncharge (&memcg->memsw,PAGE_SIZE ); +if (!mem_cgroup_is_root (memcg)) +res_counter_uncharge (&memcg->memsw,PAGE_SIZE );mem_cgroup_swap_statistics (memcg, false);css_put (&memcg->css); }@@ -6509,12 +6559,15 @@ static void uncharge_batch(struct mem_cgroup *memcg, unsigned long pgpgout, {unsigned long flags; -if (nr_mem) -res_counter_uncharge (&memcg->res, nr_mem *PAGE_SIZE ); -if (nr_memsw) -res_counter_uncharge (&memcg->memsw, nr_memsw *PAGE_SIZE ); - -memcg_oom_recover (memcg); +if (!mem_cgroup_is_root (memcg)) { +if (nr_mem) +res_counter_uncharge (&memcg->res, + nr_mem *PAGE_SIZE ); +if (nr_memsw) +res_counter_uncharge (&memcg->memsw, + nr_memsw *PAGE_SIZE ); +memcg_oom_recover (memcg); + }local_irq_save (flags);__this_cpu_sub (memcg->stat->count[MEM_CGROUP_STAT_RSS ], nr_anon);Signature · 1 line
2.0.4
Signature · 8 lines
Michal Hocko
SUSE Labs

--
To unsubscribe, send a message with 'unsubscribe linux-mm' in
the body to [email protected].  For more info on Linux MM,
see: http://www.linux-mm.org/ .
Don't email: <a href=mailto:"[email protected]"> [email protected] </a>
Quoted 12 lines · Dave Hansen
Quoted 11 lines · Michal Hocko
Ouch.
free_pages_and_swap_cachecompletely kills the uncharge batching because it reduces it toPAGEVEC_SIZEbatches.I think we really do not need
PAGEVEC_SIZEbatching anymore. We are already batching ontlb_gatherlayer. That one is limited so I think the below should be safe but I have to think about this some more. There is a risk of prolongedlru_lockwait times but the number of pages is limited to 10k and the heavy work is done outside of the lock. If this is really a problem then we can tear LRU part and the actual freeing/uncharging into a separate functions in this path.
Quoted 5 lines
Quoted 2 lines
Could you test with this half baked patch, please? I didn't get to test it myself unfortunately.
3.16 settled out at about 11.5M faults/sec before the regression. This patch gets it back up to about 10.5M, which is good.
Dave, would you be willing to test the following patch as well? I do not have a huge machine at hand right now. It would be great if you could run the same load within a !root memcg. We have basically the same sub-optimality there as well. The root bypass will be re-introduced for now but I think we can make the regular memcg load better regardless and this would be also preparation for later root bypass removal again.
---
Quoted 21 lines · Dave Hansen
Quoted 20 lines · Dave Hansen
Quoted 11 lines · Michal Hocko
Ouch.
free_pages_and_swap_cachecompletely kills the uncharge batching because it reduces it toPAGEVEC_SIZEbatches.I think we really do not need
PAGEVEC_SIZEbatching anymore. We are already batching ontlb_gatherlayer. That one is limited so I think the below should be safe but I have to think about this some more. There is a risk of prolongedlru_lockwait times but the number of pages is limited to 10k and the heavy work is done outside of the lock. If this is really a problem then we can tear LRU part and the actual freeing/uncharging into a separate functions in this path.Quoted 2 lines
Could you test with this half baked patch, please? I didn't get to test it myself unfortunately.
3.16 settled out at about 11.5M faults/sec before the regression. This patch gets it back up to about 10.5M, which is good. The top spinlock contention in the kernel is still from the resource counter code via
mem_cgroup_commit_charge(), though.
Quoted 5 lines
Quoted 1 line
I'm running Johannes' patch now.
This looks pretty good. The area where it plateaus (above 80 threads where hyperthreading kicks in) might be a bit slower than it was in 3.16, but that could easily be from other things.
Good news indeed. But I think it would be safer to apply Johannes' revert for now. Both changes are still worth having anyway because they have potential to improve memcg case.
Quoted 3 lines
Feel free to add my Tested-by:
Thanks a lot! I have posted another patch which reduces the batching for LRU handling because this would be too risky. So I haven't added your Tested-by yet.
Signature · 8 lines
Michal Hocko
SUSE Labs

--
To unsubscribe, send a message with 'unsubscribe linux-mm' in
the body to [email protected].  For more info on Linux MM,
see: http://www.linux-mm.org/ .
Don't email: <a href=mailto:"[email protected]"> [email protected] </a>
Johannes Weiner
maintainerQuoted 12 lines · Dave Hansen
Quoted 11 lines · Michal Hocko
Ouch.
free_pages_and_swap_cachecompletely kills the uncharge batching because it reduces it toPAGEVEC_SIZEbatches.I think we really do not need
PAGEVEC_SIZEbatching anymore. We are already batching ontlb_gatherlayer. That one is limited so I think the below should be safe but I have to think about this some more. There is a risk of prolongedlru_lockwait times but the number of pages is limited to 10k and the heavy work is done outside of the lock. If this is really a problem then we can tear LRU part and the actual freeing/uncharging into a separate functions in this path.
Quoted 7 lines
Quoted 2 lines
Could you test with this half baked patch, please? I didn't get to test it myself unfortunately.
3.16 settled out at about 11.5M faults/sec before the regression. This patch gets it back up to about 10.5M, which is good. The top spinlock contention in the kernel is still from the resource counter code via
mem_cgroup_commit_charge(), though.
Thanks for testing, that looks a lot better.
But commit doesn't touch resource counters - did you mean try_charge() or uncharge() by any chance?
--
To unsubscribe, send a message with 'unsubscribe linux-mm' in the body to [email protected]. For more info on Linux MM,
see: http://www.linux-mm.org/ .
Don't email: <a href=mailto:"[email protected]"> [email protected] </a>
Johannes Weiner
maintainerQuoted 28 lines · Michal Hocko
(quoted diff) +9
-3@@ -900,10 +900,10 @@ void lru_add_drain_all(void) * grabbed the page via the LRU. If it did, give up: shrink_inactive_list() * will free it. */ -void release_pages(struct page **pages, int nr, bool cold) +static void release_lru_pages(struct page **pages, int nr, + struct list_head *pages_to_free) { int i; - LIST_HEAD(pages_to_free); struct zone *zone = NULL; struct lruvec *lruvec; unsigned long uninitialized_var(flags);@@ -943,11 +943,26 @@ void release_pages(struct page **pages, int nr, bool cold) /* Clear Active bit in case of parallel mark_page_accessed */ __ClearPageActive(page); - list_add(&page->lru, &pages_to_free); + list_add(&page->lru, pages_to_free); } if (zone) spin_unlock_irqrestore(&zone->lru_lock, flags); +} +/* + * Batched page_cache_release(). Frees and uncharges all given pages + * for which the reference count drops to 0. + */ +void release_pages(struct page **pages, int nr, bool cold)
Review void release_pages(struct page **pages, int nr, bool cold) · line 965
Quoted 10 lines
(quoted diff) +9
-0+{ + LIST_HEAD(pages_to_free); + while (nr) { + int batch = min(nr, PAGEVEC_SIZE); + + release_lru_pages(pages, batch, &pages_to_free); + pages += batch; + nr -= batch; + }
We might be able to process a lot more pages in one go if nobody else needs the lock or the CPU. Can't we just cycle the lock or reschedule if necessary?
mm/swap.c +9 -0
@@ -944,6 +944,15 @@ void release_pages(struct page **pages, int nr, bool cold)__ClearPageActive (page);list_add (&page->lru, &pages_to_free); + +if (should_resched () || + (zone &&spin_needbreak (&zone->lru_lock))) { +if (zone) { +spin_unlock_irqrestore (&zone->lru_lock, flags); + zone =NULL ; + } +cond_resched (); + } }if (zone)spin_unlock_irqrestore (&zone->lru_lock, flags);
mm/swap_state.c +4 -11
@@ -262,19 +262,12 @@ void free_page_and_swap_cache(struct page *page)*/ void free_pages_and_swap_cache (struct page **pages,int nr) { -struct page **pagep = pages; +int i;lru_add_drain (); -while (nr) { -int todo =min (nr,PAGEVEC_SIZE ); -int i; - -for (i =0 ; i < todo; i++) -free_swap_cache (pagep[i]); -release_pages (pagep, todo, false); - pagep += todo; - nr -= todo; - } +for (i =0 ; i < nr; i++) +free_swap_cache (pages[i]); +release_pages (pages, nr, false); }/*
Quoted 32 lines · Johannes Weiner
Quoted 31 lines · Michal Hocko
(quoted diff) +11
-3@@ -900,10 +900,10 @@ void lru_add_drain_all(void) * grabbed the page via the LRU. If it did, give up: shrink_inactive_list() * will free it. */ -void release_pages(struct page **pages, int nr, bool cold) +static void release_lru_pages(struct page **pages, int nr, + struct list_head *pages_to_free) { int i; - LIST_HEAD(pages_to_free); struct zone *zone = NULL; struct lruvec *lruvec; unsigned long uninitialized_var(flags);@@ -943,11 +943,26 @@ void release_pages(struct page **pages, int nr, bool cold) /* Clear Active bit in case of parallel mark_page_accessed */ __ClearPageActive(page); - list_add(&page->lru, &pages_to_free); + list_add(&page->lru, pages_to_free); } if (zone) spin_unlock_irqrestore(&zone->lru_lock, flags); +} +/* + * Batched page_cache_release(). Frees and uncharges all given pages + * for which the reference count drops to 0. + */ +void release_pages(struct page **pages, int nr, bool cold) +{ + LIST_HEAD(pages_to_free);
Quoted 11 lines
Review void release_pages(struct page **pages, int nr, bool cold) · line 965
Quoted 7 lines
(quoted diff) +7
-0+ while (nr) { + int batch = min(nr, PAGEVEC_SIZE); + + release_lru_pages(pages, batch, &pages_to_free); + pages += batch; + nr -= batch; + }We might be able to process a lot more pages in one go if nobody else needs the lock or the CPU. Can't we just cycle the lock or reschedule if necessary?
Is it safe to cond_resched here for all callers? I hope it is but there are way too many callers to check so I am not 100% sure.
Besides that spin_needbreak doesn't seem to be available for all architectures. git grep "arch_spin_is_contended(" -- arch/ arch/arm/include/asm/spinlock.h:static inline int arch_spin_is_contended(arch_spinlock_t *lock) arch/arm64/include/asm/spinlock.h:static inline int arch_spin_is_contended(arch_spinlock_t *lock) arch/ia64/include/asm/spinlock.h:static inline int arch_spin_is_contended(arch_spinlock_t *lock) arch/mips/include/asm/spinlock.h:static inline int arch_spin_is_contended(arch_spinlock_t *lock) arch/x86/include/asm/spinlock.h:static inline int arch_spin_is_contended(arch_spinlock_t *lock)
Moreover it doesn't seem to do anything for !CONFIG_PREEMPT but this should be trivial to fix.
I am also not sure this will work well in all cases. If we have a heavy reclaim activity on other CPUs then this path might be interrupted too often resulting in too much lock bouncing. So I guess we want at least few pages to be processed in one run. On the other hand if the lock is not contended then doing batches and retake the lock shouldn't add too much overhead, no?
Quoted 48 lines
mm/swap.c +9
-0@@ -944,6 +944,15 @@ void release_pages(struct page **pages, int nr, bool cold)__ClearPageActive (page);list_add (&page->lru, &pages_to_free); + +if (should_resched () || + (zone &&spin_needbreak (&zone->lru_lock))) { +if (zone) { +spin_unlock_irqrestore (&zone->lru_lock, flags); + zone =NULL ; + } +cond_resched (); + } }if (zone)spin_unlock_irqrestore (&zone->lru_lock, flags);mm/swap_state.c +4
-11@@ -262,19 +262,12 @@ void free_page_and_swap_cache(struct page *page)*/ void free_pages_and_swap_cache (struct page **pages,int nr) { -struct page **pagep = pages; +int i;lru_add_drain (); -while (nr) { -int todo =min (nr,PAGEVEC_SIZE ); -int i; - -for (i =0 ; i < todo; i++) -free_swap_cache (pagep[i]); -release_pages (pagep, todo, false); - pagep += todo; - nr -= todo; - } +for (i =0 ; i < nr; i++) +free_swap_cache (pages[i]); +release_pages (pages, nr, false); }/*
Signature · 8 lines
Michal Hocko
SUSE Labs

--
To unsubscribe, send a message with 'unsubscribe linux-mm' in
the body to [email protected].  For more info on Linux MM,
see: http://www.linux-mm.org/ .
Don't email: <a href=mailto:"[email protected]"> [email protected] </a>
Quoted 21 lines · Johannes Weiner
Quoted 12 lines · Dave Hansen
Quoted 11 lines · Michal Hocko
Ouch.
free_pages_and_swap_cachecompletely kills the uncharge batching because it reduces it toPAGEVEC_SIZEbatches.I think we really do not need
PAGEVEC_SIZEbatching anymore. We are already batching ontlb_gatherlayer. That one is limited so I think the below should be safe but I have to think about this some more. There is a risk of prolongedlru_lockwait times but the number of pages is limited to 10k and the heavy work is done outside of the lock. If this is really a problem then we can tear LRU part and the actual freeing/uncharging into a separate functions in this path.Quoted 7 lines
Quoted 2 lines
Could you test with this half baked patch, please? I didn't get to test it myself unfortunately.
3.16 settled out at about 11.5M faults/sec before the regression. This patch gets it back up to about 10.5M, which is good. The top spinlock contention in the kernel is still from the resource counter code via
mem_cgroup_commit_charge(), though.
Quoted 4 lines
Thanks for testing, that looks a lot better.
But commit doesn't touch resource counters - did you mean
try_charge()oruncharge()by any chance?
I don't have the perf output that I was looking at when I said this, but here's the path that I think I was referring to. The inlining makes this non-obvious, but this memcg_check_events() calls mem_cgroup_update_tree() which is contending on mctz->lock.
So, you were right, it's not the resource counters code, it's a lock in 'struct mem_cgroup_tree_per_zone'. But, the contention isn't _that_ high (2% of CPU) in this case. But, that is 2% that we didn't see before.
Quoted 7 lines
     1.87%     1.87%  [kernel]               [k] _raw_spin_lock_irqsave
                               |
                               --- _raw_spin_lock_irqsave
                                  |
                                  |--107.09%-- memcg_check_events
                                  |          |
                                  |          |--79.98%-- mem_cgroup_commit_charge
Quoted 8 lines
                                  |          |          |
                                  |          |          |--99.81%-- do_cow_fault
                                  |          |          |          handle_mm_fault
                                  |          |          |          __do_page_fault
                                  |          |          |          do_page_fault
                                  |          |          |          page_fault
                                  |          |          |          testcase
                                  |          |           --0.19%-- [...]
--
To unsubscribe, send a message with 'unsubscribe linux-mm' in the body to [email protected]. For more info on Linux MM,
see: http://www.linux-mm.org/ .
Don't email: <a href=mailto:"[email protected]"> [email protected] </a>
Johannes Weiner
maintainerQuoted 27 lines · Dave Hansen
Quoted 21 lines · Johannes Weiner
Quoted 12 lines · Dave Hansen
Quoted 11 lines · Michal Hocko
Ouch.
free_pages_and_swap_cachecompletely kills the uncharge batching because it reduces it toPAGEVEC_SIZEbatches.I think we really do not need
PAGEVEC_SIZEbatching anymore. We are already batching ontlb_gatherlayer. That one is limited so I think the below should be safe but I have to think about this some more. There is a risk of prolongedlru_lockwait times but the number of pages is limited to 10k and the heavy work is done outside of the lock. If this is really a problem then we can tear LRU part and the actual freeing/uncharging into a separate functions in this path.Quoted 7 lines
Quoted 2 lines
Could you test with this half baked patch, please? I didn't get to test it myself unfortunately.
3.16 settled out at about 11.5M faults/sec before the regression. This patch gets it back up to about 10.5M, which is good. The top spinlock contention in the kernel is still from the resource counter code via
mem_cgroup_commit_charge(), though.Quoted 4 lines
Thanks for testing, that looks a lot better.
But commit doesn't touch resource counters - did you mean
try_charge()oruncharge()by any chance?
Quoted 24 lines
I don't have the perf output that I was looking at when I said this, but here's the path that I think I was referring to. The inlining makes this non-obvious, but this
memcg_check_events()callsmem_cgroup_update_tree()which is contending onmctz->lock.So, you were right, it's not the resource counters code, it's a lock in 'struct
mem_cgroup_tree_per_zone'. But, the contention isn't _that_ high (2% of CPU) in this case. But, that is 2% that we didn't see before.Quoted 15 lines
     1.87%     1.87%  [kernel]               [k] _raw_spin_lock_irqsave
                               |
                               --- _raw_spin_lock_irqsave
                                  |
                                  |--107.09%-- memcg_check_events
                                  |          |
                                  |          |--79.98%-- mem_cgroup_commit_charge
                                  |          |          |
                                  |          |          |--99.81%-- do_cow_fault
                                  |          |          |          handle_mm_fault
                                  |          |          |          __do_page_fault
                                  |          |          |          do_page_fault
                                  |          |          |          page_fault
                                  |          |          |          testcase
                                  |          |           --0.19%-- [...]
The mctz->lock is only taken when there is, or has been, soft limit excess. However, the soft limit defaults to infinity, so unless you set it explicitly on the root level, I can't see how this could be mctz->lock contention.
It's more plausible that this is the res_counter lock for testing soft limit excess - for me, both these locks get inlined into check_events, could you please double check you got the right lock?
As the limit defaults to infinity, and really doesn't mean anything on the root level it's idiotic to test it, we can easily eliminate that. With the patch below, I don't have that trace show up in the profile anymore. Could you please give it a try?
You also said that this cost hasn't been there before, but I do see that trace in both v3.16 and v3.17-rc3 with roughly the same impact (although my machines show less contention than yours). Could you please double check that this is in fact a regression independent of 05b843012335 ("mm: memcontrol: use root_mem_cgroup res_counter")?
Thanks!
---
Quoted 8 lines · Johannes Weiner
The
mctz->lockis only taken when there is, or has been, soft limit excess. However, the soft limit defaults to infinity, so unless you set it explicitly on the root level, I can't see how this could bemctz->lockcontention.It's more plausible that this is the
res_counterlock for testing soft limit excess - for me, both these locks get inlined intocheck_events, could you please double check you got the right lock?
I got the wrong lock. Here's how it looks after mainline, plus your free_pages_and_swap_cache() patch:
Samples: 2M of event 'cycles', Event count (approx.): 51647128377
+   60.60%     1.33%  page_fault2_processes              [.] testcase                       ▒
+   59.14%     0.41%  [kernel]                           [k] page_fault                     ◆
+   58.72%     0.01%  [kernel]                           [k] do_page_fault                  ▒
+   58.70%     0.08%  [kernel]                           [k] __do_page_fault                ▒
+   58.50%     0.29%  [kernel]                           [k] handle_mm_fault                ▒
+   40.14%     0.28%  [kernel]                           [k] do_cow_fault                   ▒
-   34.56%    34.56%  [kernel]                           [k] _raw_spin_lock                 ▒
   - _raw_spin_lock                                                                         ▒
      - 78.11% __res_counter_charge                                                         ▒
           res_counter_charge                                                               ▒
           try_charge                                                                       ▒
         - mem_cgroup_try_charge                                                            ▒
            + 99.99% do_cow_fault                                                           ▒
      - 10.30% res_counter_uncharge_until                                                   ▒
           res_counter_uncharge                                                             ▒
           uncharge_batch                                                                   ▒
           uncharge_list                                                                    ▒
           mem_cgroup_uncharge_list                                                         ▒
           release_pages                                                                    ▒
      + 4.75% free_pcppages_bulk                                                            ▒
      + 3.65% do_cow_fault                                                                  ▒
      + 2.24% get_page_from_freelist                                                        ▒
Quoted 5 lines
You also said that this cost hasn't been there before, but I do see that trace in both v3.16 and v3.17-rc3 with roughly the same impact (although my machines show less contention than yours). Could you please double check that this is in fact a regression independent of
05b843012335("mm: memcontrol: useroot_mem_cgroupres_counter")?
Here's the same workload on the same machine with only Johannes' revert applied:
-   35.92%    35.92%  [kernel]                           [k] _raw_spin_lock                 ▒
   - _raw_spin_lock                                                                         ▒
      - 49.09% get_page_from_freelist                                                       ▒
         - __alloc_pages_nodemask                                                           ▒
            + 99.90% alloc_pages_vma                                                        ▒
      - 43.67% free_pcppages_bulk                                                           ▒
         - 100.00% free_hot_cold_page                                                       ▒
            + 99.93% free_hot_cold_page_list                                                ▒
      - 7.08% do_cow_fault                                                                  ▒
           handle_mm_fault                                                                  ▒
           __do_page_fault                                                                  ▒
           do_page_fault                                                                    ▒
           page_fault                                                                       ▒
           testcase                                                                         ▒
So I think it's probably part of the same regression.
Quoted 13 lines · Michal Hocko
Quoted 12 lines · Dave Hansen
Quoted 11 lines · Michal Hocko
Ouch.
free_pages_and_swap_cachecompletely kills the uncharge batching because it reduces it toPAGEVEC_SIZEbatches.I think we really do not need
PAGEVEC_SIZEbatching anymore. We are already batching ontlb_gatherlayer. That one is limited so I think the below should be safe but I have to think about this some more. There is a risk of prolongedlru_lockwait times but the number of pages is limited to 10k and the heavy work is done outside of the lock. If this is really a problem then we can tear LRU part and the actual freeing/uncharging into a separate functions in this path.
Quoted 8 lines
Quoted 5 lines
Quoted 2 lines
Could you test with this half baked patch, please? I didn't get to test it myself unfortunately.
3.16 settled out at about 11.5M faults/sec before the regression. This patch gets it back up to about 10.5M, which is good.
Dave, would you be willing to test the following patch as well? I do not have a huge machine at hand right now. It would be great if you could
I was playing with 48CPU with 32G of RAM machine but the res_counter lock didn't show up in the traces much (this was with 96 processes doing mmap (256M private file, faul, unmap in parallel):
                          |--0.75%-- __res_counter_charge
                          |          res_counter_charge
                          |          try_charge
                          |          mem_cgroup_try_charge
                          |          |
                          |          |--81.56%-- do_cow_fault
                          |          |          handle_mm_fault
                          |          |          __do_page_fault
                          |          |          do_page_fault
                          |          |          page_fault
[...]
                          |          |
                          |           --18.44%-- __add_to_page_cache_locked
                          |                     add_to_page_cache_lru
                          |                     mpage_readpages
                          |                     ext4_readpages
                          |                     __do_page_cache_readahead
                          |                     ondemand_readahead
                          |                     page_cache_async_readahead
                          |                     filemap_fault
                          |                     __do_fault
                          |                     do_cow_fault
                          |                     handle_mm_fault
                          |                     __do_page_fault
                          |                     do_page_fault
                          |                     page_fault
Nothing really changed in that regards when I reduced mmap size to 128M and run with 4*CPUs.
I do not have a bigger machine to play with unfortunately. I think the patch makes sense on its own. I would really appreciate if you could give it a try on your machine with !root memcg case to see how much it helped. I would expect similar results to your previous testing without the revert and Johannes' patch.
[...]
Signature · 2 lines
Michal Hocko
SUSE Labs
Quoted 5 lines · Michal Hocko
I do not have a bigger machine to play with unfortunately. I think the patch makes sense on its own. I would really appreciate if you could give it a try on your machine with !root memcg case to see how much it helped. I would expect similar results to your previous testing without the revert and Johannes' patch.
So you want to see before/after this patch:
Subject: [PATCH] mm, memcg: Do not kill release batching in
free_pages_and_swap_cache
And you want it on top of a kernel with the revert or without?
--
To unsubscribe, send a message with 'unsubscribe linux-mm' in the body to [email protected]. For more info on Linux MM,
see: http://www.linux-mm.org/ .
Don't email: <a href=mailto:"[email protected]"> [email protected] </a>
Quoted 7 lines · Dave Hansen
Quoted 5 lines · Michal Hocko
I do not have a bigger machine to play with unfortunately. I think the patch makes sense on its own. I would really appreciate if you could give it a try on your machine with !root memcg case to see how much it helped. I would expect similar results to your previous testing without the revert and Johannes' patch.
Quoted 6 lines
So you want to see before/after this patch:
Subject: [PATCH] mm, memcg: Do not kill release batching in
free_pages_and_swap_cacheAnd you want it on top of a kernel with the revert or without?
Revert doesn't make any difference if you run the load inside a memcg (without any limit set).
So just before and after the patch would be sufficient.
Thanks a lot Dave!
Signature · 8 lines
Michal Hocko
SUSE Labs

--
To unsubscribe, send a message with 'unsubscribe linux-mm' in
the body to [email protected].  For more info on Linux MM,
see: http://www.linux-mm.org/ .
Don't email: <a href=mailto:"[email protected]"> [email protected] </a>